
File:Carbon dioxide pressure-temperature phase diagram international.svg

Size of this PNG preview of this SVG file: 630 × 600 pixels. Other resolutions: 252 × 240 pixels | 504 × 480 pixels | 807 × 768 pixels | 1,075 × 1,024 pixels | 2,151 × 2,048 pixels | 711 × 677 pixels.
Original file (SVG file, nominally 711 × 677 pixels, file size: 30 KB)
| This is a file from the Wikimedia Commons. Information from its description page there is shown below. Commons is a freely licensed media file repository. You can help. |
Summary
| Description |
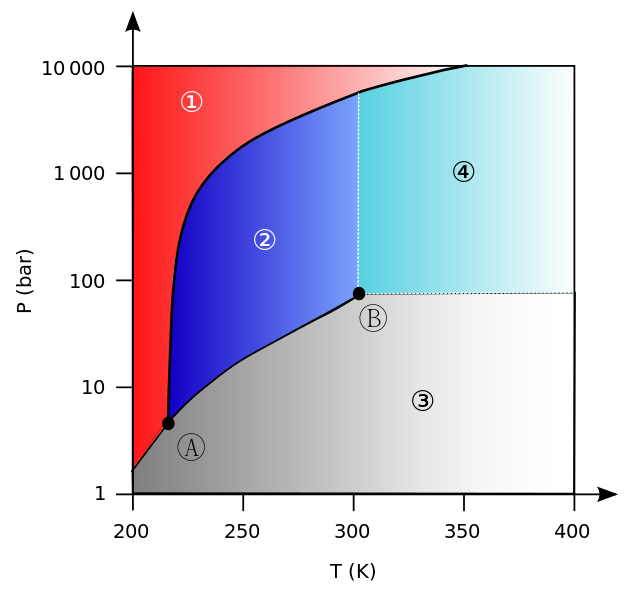
English: Phase diagram of CO2 (carbon dioxide), suitable for international use.
X axis is temperature in kelvin; Y axis is pressure in bar. Legend:
Español: Diagrama de fase de CO2 (dióxido de carbono), válido para uso internacioal.
El eje X representa la temperatura en kelvin; y el eje Y la presión en bares. Leyenda:
Français : Diagramme de phases du CO2 (dioxyde de carbone), convenant à un usage international.
L’axe X represente la température en kelvin; l’axe Y la pression en bars. Légende :
|
| Date | |
| Source |
English: Derived from Image:Carbon dioxide pressure-temperature phase diagram.svg
Español: Derivado de Image:Carbon dioxide pressure-temperature phase diagram.svg
Français : Adapté de Image:Carbon dioxide pressure-temperature phase diagram.svg |
| Author |
|
| Other versions |
[]
.jpg:
.png:
|


Licensing
I, the copyright holder of this work, hereby publish it under the following license:
| This file is made available under the Creative Commons CC0 1.0 Universal Public Domain Dedication. | |
| The person who associated a work with this deed has dedicated the work to the public domain by waiving all of their rights to the work worldwide under copyright law, including all related and neighboring rights, to the extent allowed by law. You can copy, modify, distribute and perform the work, even for commercial purposes, all without asking permission.
|
File history
Click on a date/time to view the file as it appeared at that time.
| Date/Time | Thumbnail | Dimensions | User | Comment | |
|---|---|---|---|---|---|
| current | 03:45, 30 November 2010 | | 711 × 677 (30 KB) | Bignose | {{Information |Description={{en|1=Phase diagram of CO<sub>2</sub> (carbon dioxide), suitable for international use. X axis is temperature in kelvin; Y axis is pressure in bar. Legend: * ①: solid phase |
File usage
The following pages on the English Wikipedia use this file (pages on other projects are not listed):
Global file usage
The following other wikis use this file:
- Usage on ar.wikipedia.org
- Usage on es.wikipedia.org
- Usage on es.wikibooks.org
- Usage on eu.wikipedia.org
- Usage on fr.wikiversity.org
- Usage on fr.wiktionary.org
- Usage on he.wikipedia.org
- Usage on hu.wikipedia.org
- Usage on ja.wikipedia.org
- Usage on nl.wikipedia.org
- Usage on pl.wikipedia.org
- Usage on ru.wikipedia.org