Plan 2029 The City of Turku Sustainable Energy and Climate Action Plan 2029 Updated in 2022 Turku City Council 16 May 2022 § 103
Turku Climate
Turku Climate Plan 2029 adheres to the shared SECAP (Sustainable Energy and Climate Action Plan) model of the European Union.
The Turku City Council set the climate targets and approved the climate programme for the first time on 26 October 2009 (§ 239), and Turku then joined the Covenant of Mayors, a shared climate action movement of European cities and regions on 20 October 2010 (§ 184).
City of Turku Environmental Publications 3/2022 ISSN 2343-0710 (online publication) ISSN 2343-0222 (printed)
CITY OF TURKU 2
Abstract
This document is the updated City of Turku Climate Plan unanimously approved by the City Council on 16 May 2022. The implementation of the Climate Plan is reported to the City Council annually, and the plan is updated each council term. The Turku City Council approved the climate plan 2029 for the first time on 11 June 2018 § 142. The implementation of the plan has progressed well, and Turku was selected as the best mid-sized climate city in Europe in 2020. The updated plan further reinforces the climate targets and meas ures and is based on the latest data and experiences gained during the implementation process.
Turku Climate Plan 2029 adheres to the shared SECAP (Sustainable Energy and Climate Action Plan) model of the European Union and includes climate policies and milestones for years 2021 (completed), 2025 and 2029, as well as the development path leading up to year 2035. The plan covers both climate change mitigation and adaptation. The objective is to collectively implement the goal of a carbon-neutral city area by 2029, prepare for the impacts of climate change and consolidate Turku's position as an international pioneer of climate solutions. The plan also includes justifications as to why and how the objective of carbon neutrality will be met.
CITY OF TURKU 3
2. Greenhouse gas emissions
CITY OF TURKU 4
....
............................................................................................11
Contents 1.Target, strategy and vision, implementation and monitoring
6 1.1 Climate targets 6 1.2 Key means for meeting climate targets/strategy and vision 9 1.3 Implementation and monitoring
1.4 Climate communications and participation 13
.......................................................
.......................................................................
2.4
15 2.1 Calculation methods and their development
15
Greenhouse gas emissions from consumption 22
........................................
3.1
.......................................................................................................
3.2
..................................................
3.7
................................................................................................
43 4.1
4.2
..............................................................................
4.3
............................................
5.1
..........................................................................
5.2
5.3
5.4
.................................................................................
3. Climate change mitigation measures
24
Targeting the measures
24
Carbon-neutral energy system 25 3.3 Low-carbon sustainable mobility 28 3.4 Sustainable urban structure and low-carbon construction
33 3.5 Investments, procurement and climate responsibility 37 3.6 Strengthening biodiversity and carbon sinks 39
SECAP climate action cards
41 4. Evidencing attainability of climate target..................................
Climate targets of Turku 43
Methods and assumptions of scenario
43
Attainability of climate targets 45 5. Analysis of risks and vulnerability
50
Changing of climate in Southwest Finland
50
Method and concepts 52
Results of the analysis 55
Further development of analysis work
57
6. Assessment of the current state of adaptation and adaptation measures
6.1 Assessment of the current state of adaptation 58 6.2 Adaptation measures ........................................................................................................... 59
7. Conclusion ................................................................................... 65
Annexes of the Climate Plan 2029 ................................................. 66
ANNEX 1. Description of the calculation method ..................................................................... 67
ANNEX 2. SECAP climate action cards 72
ANNEX 3. Climate risk cards 79
ANNEX 4. Assessment of the current state of adaptation ........................................................ 90
ANNEX 5. Concepts of the Climate Plan 92
CITY OF TURKU 5
.......................................................................................... 58
1.Target, strategy and vision, implementation and monitoring
1.1 Climate targets
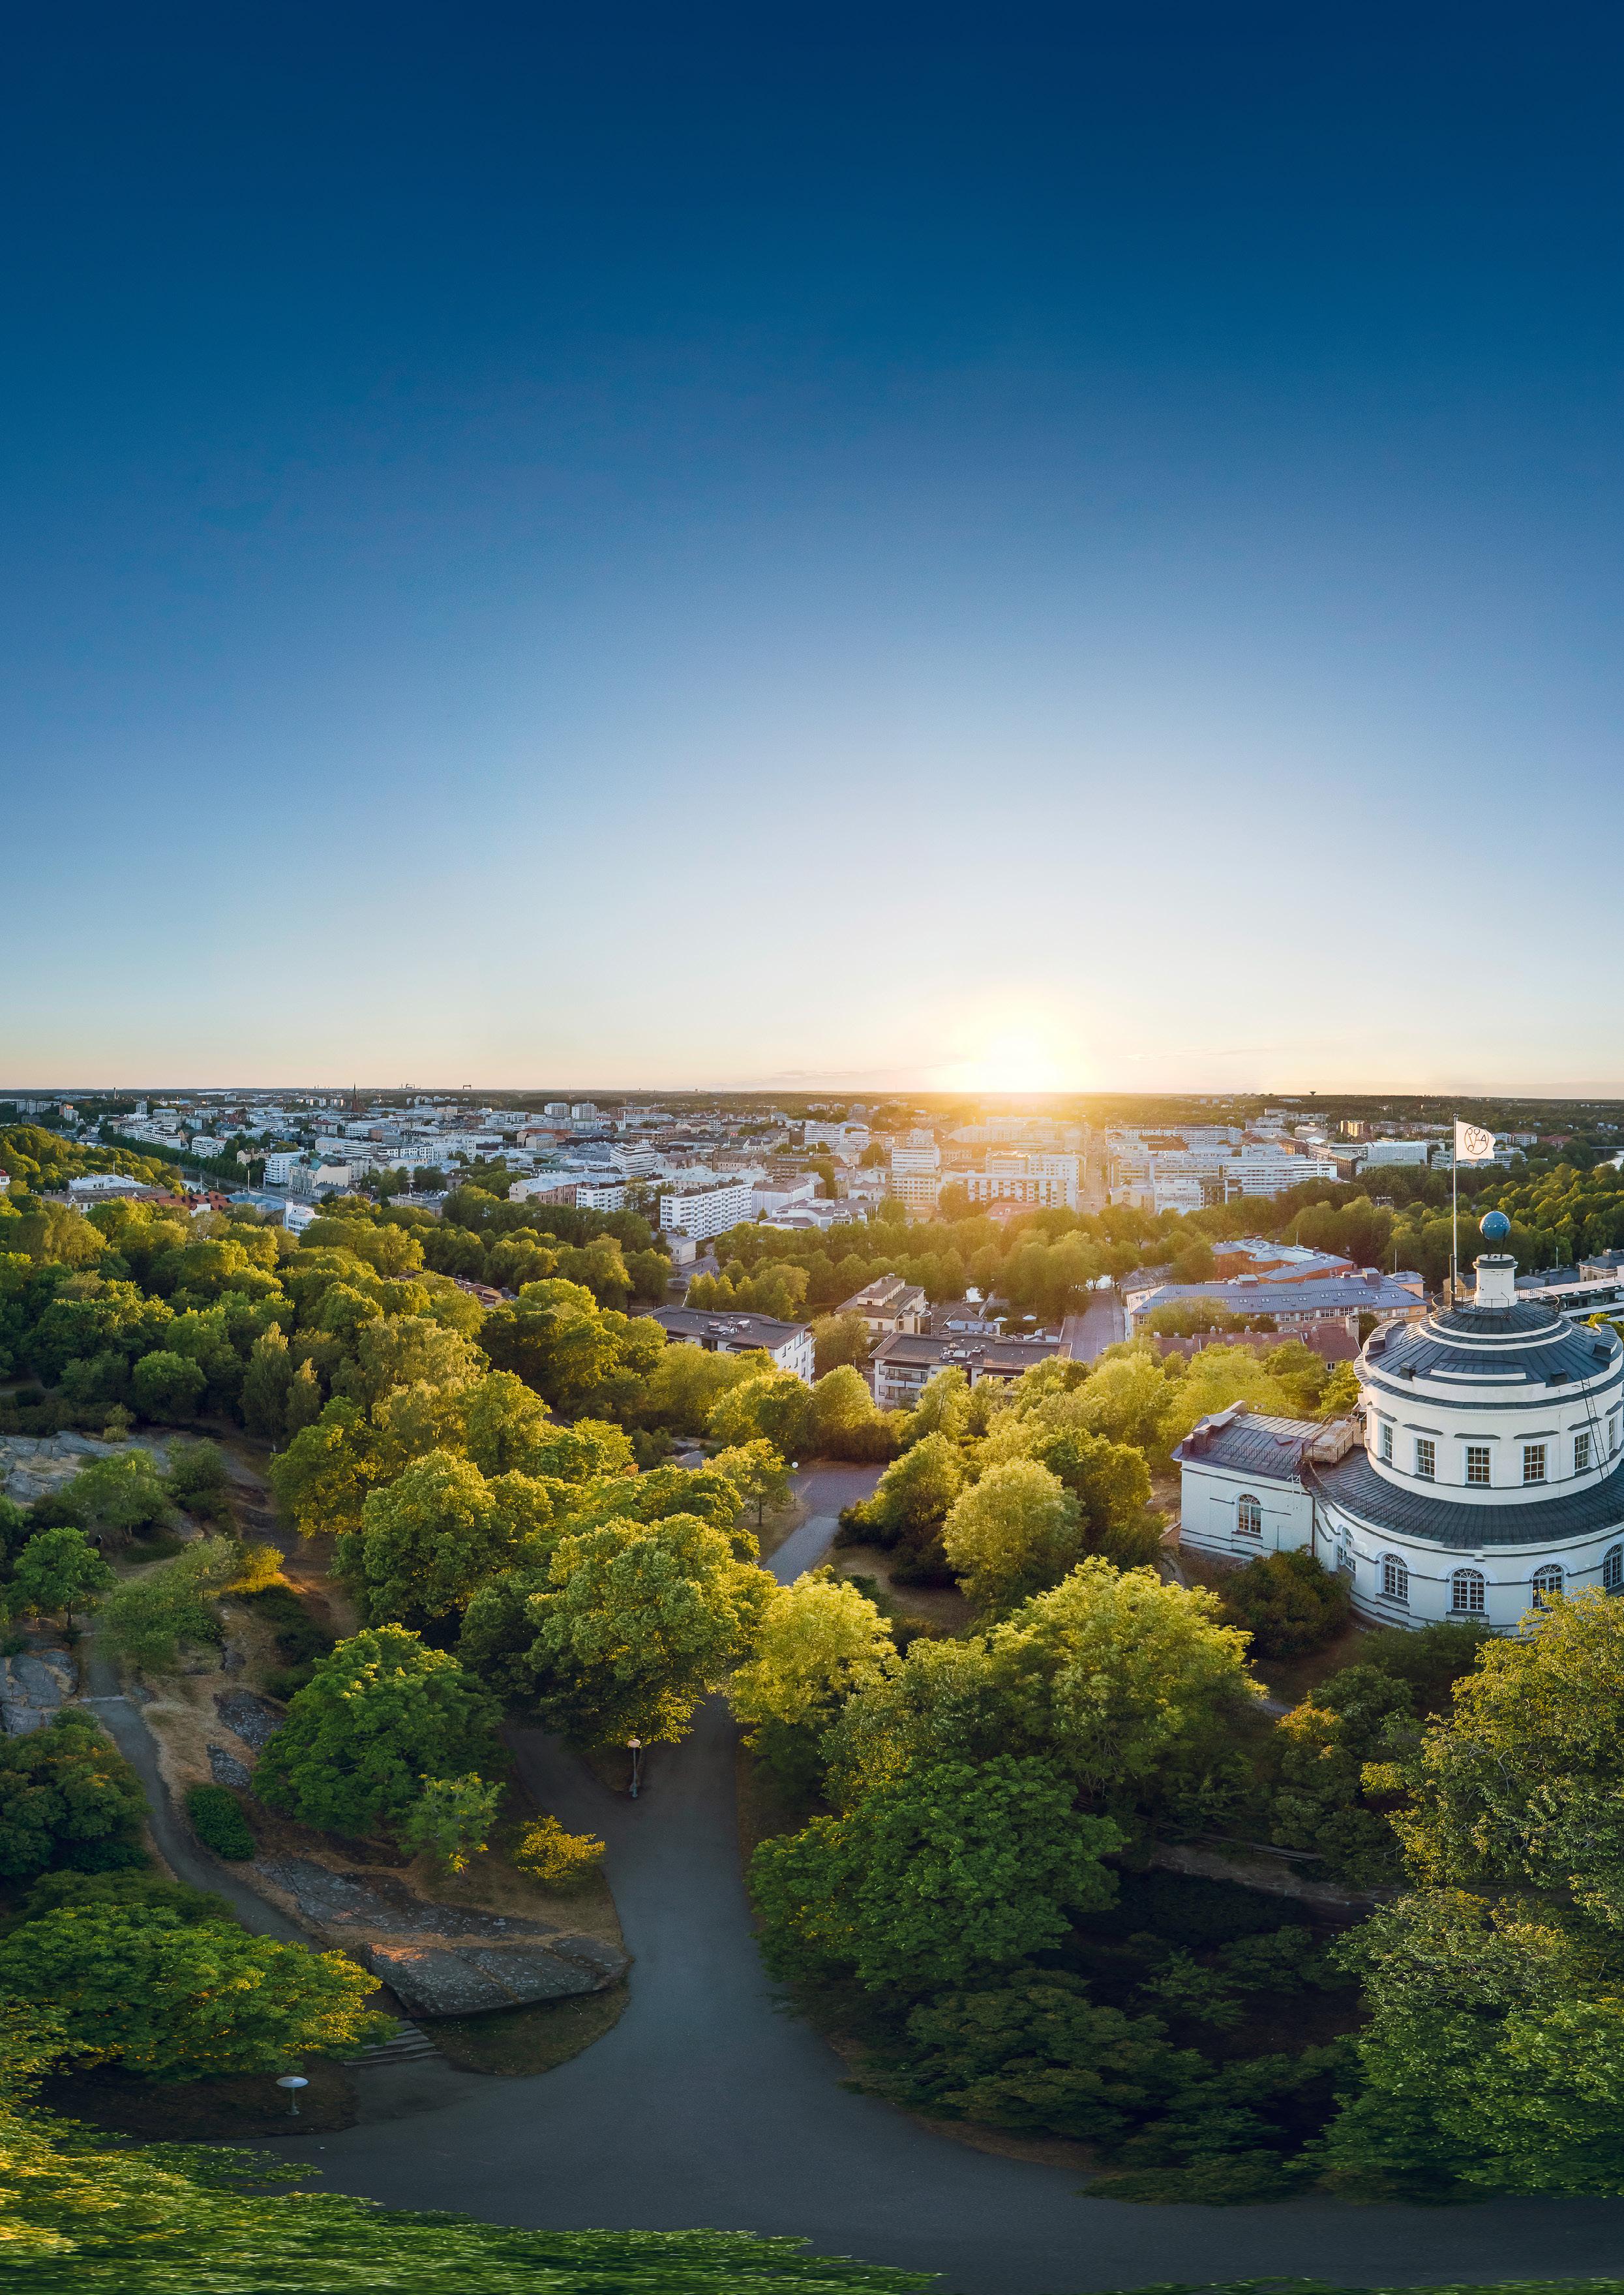
In accordance with the City Strategy (City Council 14 February 2022 § 20), Turku ad heres to sustainable development in all oper ations, implementing the sustainable develop ment goals of the United Nations, and strives to be one the leading climate and nature cities in the world. The impact of Turku on climate change mitigation exceeds its own size. The local residents, businesses and communities are actively involved in the creation and implementation of climate solutions both locally and internationally. The city also prepares for changes caused by global warming as well as for extreme weather events.
The Turku City Council set the climate targets and approved the climate programme for the first time on 26 October 2009, and Turku then joined the Covenant of Mayors, a shared climate action movement of European cities and regions on 20 October 2010. The target of carbon neutrality by 2029 was decided by the City Council in the City Strategy on 16 April 2018. On 11 June 2018, the City Council approved the climate plan that adheres to the shared European (SECAP) model. The climate targets were further reinforced when the City Council decided on the revised city strategy on 14 February 2022.
The City of Turku climate plan implements climate policy that adheres to the Paris Climate Change Agreement, aiming to limit global warming to a maximum of 1.5 degrees
compared to the pre-industrial era. The cli mate work of Turku reinforces circular econ omy and advances the goals of sustainable development of the United Nations. Turku is an active climate operator as part of local, national, European and international climate collaboration between cities, areas, countries and civil societies.
The main objectives of the City of Turku cli mate policy include having a carbon-neutral city area by 2029, being climate positive from that point onwards, and preparing comprehensively for the effects of climate change.
CITY OF TURKU 6
In accordance with the City Strategy, Turku adheres to sustainable development in all operations, implementing the sustainable development goals of the United Nations, and strives to be one the leading climate and nature cities in the world.
Simultaneously with reducing emissions, the City of Turku prepares for climate change as comprehensively as possible, and the city is developed to cope better with the change.
y By year 2029 at the latest, Turku will reach carbon neutrality. This means that the sum of Turku’s emissions, carbon sinks and po tential offsets is zero or below.
y From 2029 onwards, Turku strives towards an increasing climate positivity, which means that the sum of local emissions, carbon sinks and compensations is increas ingly negative.
y The city will prepare for the effects of cli mate change effectively and comprehen sively: the risks, vulnerabilities and effects will be analysed once every council term as a minimum and preparedness measures will be taken to address them.
Emission reduction targets have been set for each council term as follows:
y The target set for year 2021, reducing greenhouse gas emissions in the Turku area by at least 50 per cent compared to the level in 1990, was achieved already in 2020 (The City of Turku climate report 2020 (City Council 20 September 2021 § 221)).
y By 2025, emissions will be reduced by at least 75 per cent compared to the level in 1990.
y By 2029, emissions will be reduced by at least 90 per cent compared to the level in 1990.
In addition to reducing emissions in the Turku region, we also aim to reduce consumption-related emissions outside the area and to offer good climate solutions that can be used in an area wider than Turku. We will seek to reduce and monitor emissions caused by Turku residents that occur outside the area – the carbon footprint. Reaching the target of the Paris Climate Change Agreement requires significantly reducing consumption-related emissions and minimising the carbon footprint per capita: adhering to the 1.5-degree lifestyle and strengthening circular economy. In accordance with the city strategy, a sustainable lifestyle and meaningful life go hand in hand in Turku.
Turku implements strong climate policy and seeks to be an internationally acknowledged and well-known pioneer and developer of sustainable solutions and expertise. Turku-based operators and climate solutions have a great impact on climate change mitigation even in an area wider than Turku: the positive carbon handprint of Turku is significant, and it is being increased with determination in collaboration
CITY OF TURKU 7
The main objectives of the City of Turku climate policy include having a carbonneutral city area by 2029, being climate positive from that point onwards, and preparing comprehensively for the effects of climate change.
with the local civil society, education and in novation operators, businesses and develop ment partners.
Turku will reinforce the local, national and global impact of its actions by focusing im pactful climate measures on investments and procurement, by actively embedding the cli mate aspect in local education and by encour aging local businesses towards responsible research, development and innovation and sustainable procurement. In accordance with the City Strategy, circular economy generates wellbeing and new jobs in the Turku region and strengthens the local business, which op erates in a way that is respectful of nature.

CITY OF TURKU 8
Reaching carbon neutrality requires circular economy solutions. Circular economy generates wellbeing and new jobs in the Turku region. It also strengthens the local business and their sustainability.
1.2 Key means for meeting climate targets/strategy and
vision
The following measures are needed in order to meet the set climate targets:
y Reaching a carbon-neutral energy system and increasing renewable energy.
y Bringing emissions from the mobility system to a low level.
y Implementing a sustainable community structure and low-carbon construction.
y Strengthening biodiversity and carbon sinks, developing offsetting measures.
y Implementing the Turku City Group's own climate responsibility and enhancing the development of climate business and climate innovations through procurement and investments.
y Increasing awareness of the risks of, and vulnerabilities to climate change and planning and implementing measures to prepare for change.
y Mobilising citizens, communities, businesses, stakeholders, development partners and universities – the entire civil society – to join the work of creating climate actions and implementing a carbon-neutral Turku.
y Reinforcing such research, training and innovation activities in higher education institutions in Turku that help create climate and circular economy solutions. Enhancing climate expertise at all levels of education.
The Turku City Group’s measures effectively intervene with the most significant emission sources and reduce emissions
comprehensively in all operation. Through these measures, the Turku City Group con sistently implements climate responsibility, encourages others and sets an example.
Through strong climate policy actions and collaboration, Turku will become an interna tionally leading innovation and development area for climate solutions, and the solutions developed and implemented in Turku will be suitable for application elsewhere as well.
The risks, vulnerabilities and effects of cli mate change will be analysed, and efficient adaptation measures will be comprehensively planned and implemented. Timely research data will be utilised in this work.
Adequate resources will be allocated for steering and implementing climate policy. By means of climate budgeting, the planning and steering of investments and operations will be reformed in a way that the climate objectives and life cycle aspects are implemented better.
The effects of different measures on emissions can be classified as follows:
y Direct effect on emissions
y The measure reduces emissions directly – for instance, an investment in renewable energy.
y Indirect effect on emissions
y The measure reduces emissions indirectly in or outside Turku – for instance, an improved public transport service system that is estimated to increase the use of public transport, or procurement decisions that affect consumption-related emissions outside Turku
CITY OF TURKU 9
y Exemplary/pilot effect
y The measure is visible and encourages other operators to implement measures that reduce greenhouse gas emissions – for instance, a solar panel on the roof of a school or a library bus, or a new energy solution for an entire residential area.
In addition to effects on emissions, measures are also defined and justified by the following impacts:
y The climate responsibility of the City of Turku – how the measure demonstrates responsible action from the part of the city
y The Turku City Group’s climate responsibility – how the measure implements the Turku City Group’s climate responsibility
y Innovation/business impact – how the measure produces/implements innovations and develops sustainable business
y Participation effect – how the measure enables and encourages the civil society and stake-holders to participate in climate action
One measure can have several impacts – in fact, a good one often does.
Turku will prepare for the risks caused by climate change and their impacts, striving towards becoming a more climate-proof city. The most significant entities of adaptation measures include:
Turku
Our
y Understanding risks by increasing data on climate
y Reinforcing risk management
y Investments in improving resilience
y Developing disaster preparedness
Turku is an internationally desired partner and sharer of experiences – a climate city with global visibility. Turku has already been ranked as one of the best climate cities in the world (CDP 2019, 2020 and 2021) and the best in Europe (European Commission 2020). Our goal is to become even better – to make Turku the best climate city in the world, together. This calls for strong actions and a shared story that needs to be voiced.
voiced.
CITY OF TURKU 10
has already been ranked as one of the best climate cities in the world (CDP 2019, 2020 and 2021) and the best in Europe (European Commission 2020).
goal is to become even better – to make Turku the best climate city in the world, together. This calls for strong actions and a shared story that needs to be
1.3 Implementation and monitoring
The City Council makes the decisions on the climate plan. The implementation of the plan is reported to the City Council annually. The targets and content of the plan are assessed and reviewed more thoroughly each council term.
y The City Council is annually presented with a climate report that contains the develop ment of emissions and carbon balance. The report provides an overall picture of the pro gression of climate measures, challenges, and new openings.
y Turku also reports annually to the global CDP-ICLEI climate responsibility reporting system.
y The implementation is reported every second year to the shared European system as required by the EU’s SECAP monitoring.
y The attainment of the objectives set for 2021–2025–2029 will be checked each council term in connection with the updating of the climate plan. The plan is updated when necessary, and the results are reported to the shared European system in line with SECAP monitoring
In accordance with administrative regulations, the City Board steers the climate and environmental policy.
y The City Board is given a report on the implementation and development of the climate plan once a year as a minimum (in addition to the climate report given to Turku City Council).
CITY OF TURKU 11
The climate plan is updated every council term. The implementation of the plan is reported to the City Council and City Board annually.
y An extensive update on the measures of all participating operators (SECAP climate action cards, see chapter 3) can also be included in the reporting to the City Board and/or City Council.
y When needed, proposals on the implemen tation and development of the climate plan are brought to the City Board and/or Central Administration Section for consideration
In line with administrative regulations, climate and environmental policy is part of the entities governed directly by the Mayor. The Climate and Environmental Policy Unit is part of the Central Administration Management Support where its responsibilities are the steering and preparing of climate and environmental policy within the Turku City Group.
y Sufficient resources will be allocated for steering and preparing environmental and
y The measures outlined in the climate plan are planned and implemented as part of the annual operating and financial planning and investment plans.
The Turku City Group’s actions have a signif icant role in the attainment of climate targets. However, we cannot reach carbon neutrality or the objective of being the best climate city in the world without wide participation, effort and co-development. Turku will become the world’s best climate city through collaboration – all the while supporting the development of climate action of other cities and partners.
y Climate solutions are actively developed in collaboration with other municipalities, areas and partners in regional, national and international collaboration as well as in pro jects and networks.
y The whole society will be invited to join
1.4 Climate communications and participation
Turku implements continuous open climate action where the Turku City Group is con stantly planning, implementing and monitoring climate measures. Collective climate action is actively open to climate measures of busi nesses and communities, involvement by citizens, and development of new solutions in collaboration.
Creating and telling our shared story of a carbon-neutral Turku requires that the entire city organisation as well as local businesses and residents are aware of the climate objectives and the measures needed to reach them. It’s also important for everyone to be aware of how they can take part in climate action.
y Delivering empowering climate communi cation, taking into consideration the needs that different demographic groups have in terms of information – in particular, we must take into account that children and adoles cents have the right to receive information suitable for their age to alleviate climate anxiety
Businesses and communities
y Encouraging businesses and communities to join collective climate action through their own climate measures. These are gathered and shared on a platform on the climate-themed Carbon Neutral Turku webpages.
y Developing Turku Climate Team into a strong network that serves communities and businesses, implements and communicates climate, circular economy and nature measures and advances resource wisdom.
Personnel of the Turku City Group
The various target groups need to be provided with opportunities to participate in climate action, and we need to deliver communication that enhances participation. This will involve the following:
Residents
y Encouraging residents to adopt a climate-friendly 1.5-degree lifestyle and creating the prerequisites for it through the Turku City Group’s own climate measures and communication.
y Using expertise in climate psychology to develop new and inspiring ways to participate in climate action, also taking into consideration the needs of different demographic groups.
y Communicating opportunities that staff and different units have in terms of climate actions and participating in climate work. Reinforcing ways to participate and creating prerequisites.
y Implementing and developing Eco-support activity to help turn collective climate and environment objectives into practice in everyday life at workplaces.
Climate communication will be a collaborative effort involving the Turku City Group and collaboration partners. The objective is to consolidate the story of Turku as a nature and climate city that combines climate and circular economy solutions. Different communication
CITY OF TURKU 13
channels will be used in a varied way to reach all target groups. The following arenas of cli mate work will be consolidated:
y Climate Forum, once a year, with content such as: presenting the main results of climate action and new openings, acknowl edging praiseworthy actions and operators, the media.
y Website for climate work, as a continuous shared platform, with content such as: data base and visualisation of climate measures (SECAP cards), presentation videos for climate, circular economy and nature meas ures, news and joint projects.
y Dialogues with different target groups and partners to investigate what kinds of activi ties, participation and communication they would like to see in climate, nature and circular economy work, and then planning this together
Communication will also be actively delivered regionally, nationally and internationally in dif ferent networks, where experiences of climate work are shared and climate solutions are developed in collaboration.
2. Greenhouse gas emissions
2.1 Calculation methods and their development
The greenhouse gas emissions of Turku are calculated annually, using the local calcula tion method of the CO2 report, as part of the monitoring of the implementation of the city strategy and climate plan. The emissions are reported every other year to the shared European system using the SECAP method, where emission data based on the CO2 report is adjusted to meet the reporting requirements of the Covenant of Mayors. In line with the UN’s requirements, the emissions are also reported annually through the global CDP
(Disclosure Insight Action) system. The emis sions calculation in Turku is in accordance with the UN global calculation protocol for cities.
The base year of the climate plan, the base line of emissions, is 1990. This is also the general baseline year of international climate policy. In accordance with the requirements of the Covenant of Mayors, emissions from monitoring years 2015 and 2020 as well as from future monitoring years 2025 and 2029 must be reported to the EU. The development of emissions will also be examined until year 2035.
In order to assess carbon sinks, carbon sinks in the forests of the Turku area have been calculated in collaboration with the Natural Resources Institute Finland (see section 2.3). Turku continues to develop the calculating and defining of carbon sinks and offsets e.g., through its own regional offsetting model and through the KUNTANIELU project that has been initiated in collaboration with partners. Turku observes, and actively participates in, discussions about offsetting. Turku also keeps track of research on the topic. Collaboration will be continued and developed with the Finnish Climate Change Panel, the National Resources Institute Finland, local higher education institutions and other partners.
In order to expand the knowledge base and to support the target of a 1.5-degree lifestyle, Turku has also investigated the greenhouse gas emissions resulting from consumption by the municipality and municipal residents (see section 2.4). Together with pioneer municipalities, Turku participated in the development of
CITY OF TURKU 15
The greenhouse gas emissions of Turku are calculated annually, using the local calculation method of the CO2 report. The emissions are reported every other year to the shared European system using the SECAP method, as well as annually through the global CDP system.
municipality-specific greenhouse gas emission calculation in the Kulma project. Turku will continue to expand the knowledge base for the part of greenhouse gas emissions and will also continue to develop the best possible cal culation models in collaboration with partners and other municipalities.
y The distribution of greenhouse gas emis sions in the Turku area affects the allocation of climate policy measures. Changes in emission levels indicate the impacts of cli mate policy.
y By calculating carbon sinks, it has been possible to gain a more comprehensive view of the progression towards climate neutrality and climate positivity in the area.

y The SECAP calculation in line with EU requirements is based on the annual CO2 report but takes into account e.g., the ener gy production and holdings of the Turku City Group and their development in more detail.
y The emissions will be calculated in accord ance with the CO2 report also in the future, but the emission data will be reported to the European Commission in accordance with the SECAP format each council term.
y Going forward, carbon sinks in the Turku area and their development will be mon itored annually. The calculation is under further development.
2.2 Distribution and development of greenhouse gas emissions
Annual calculation of emissions, CO2 report method
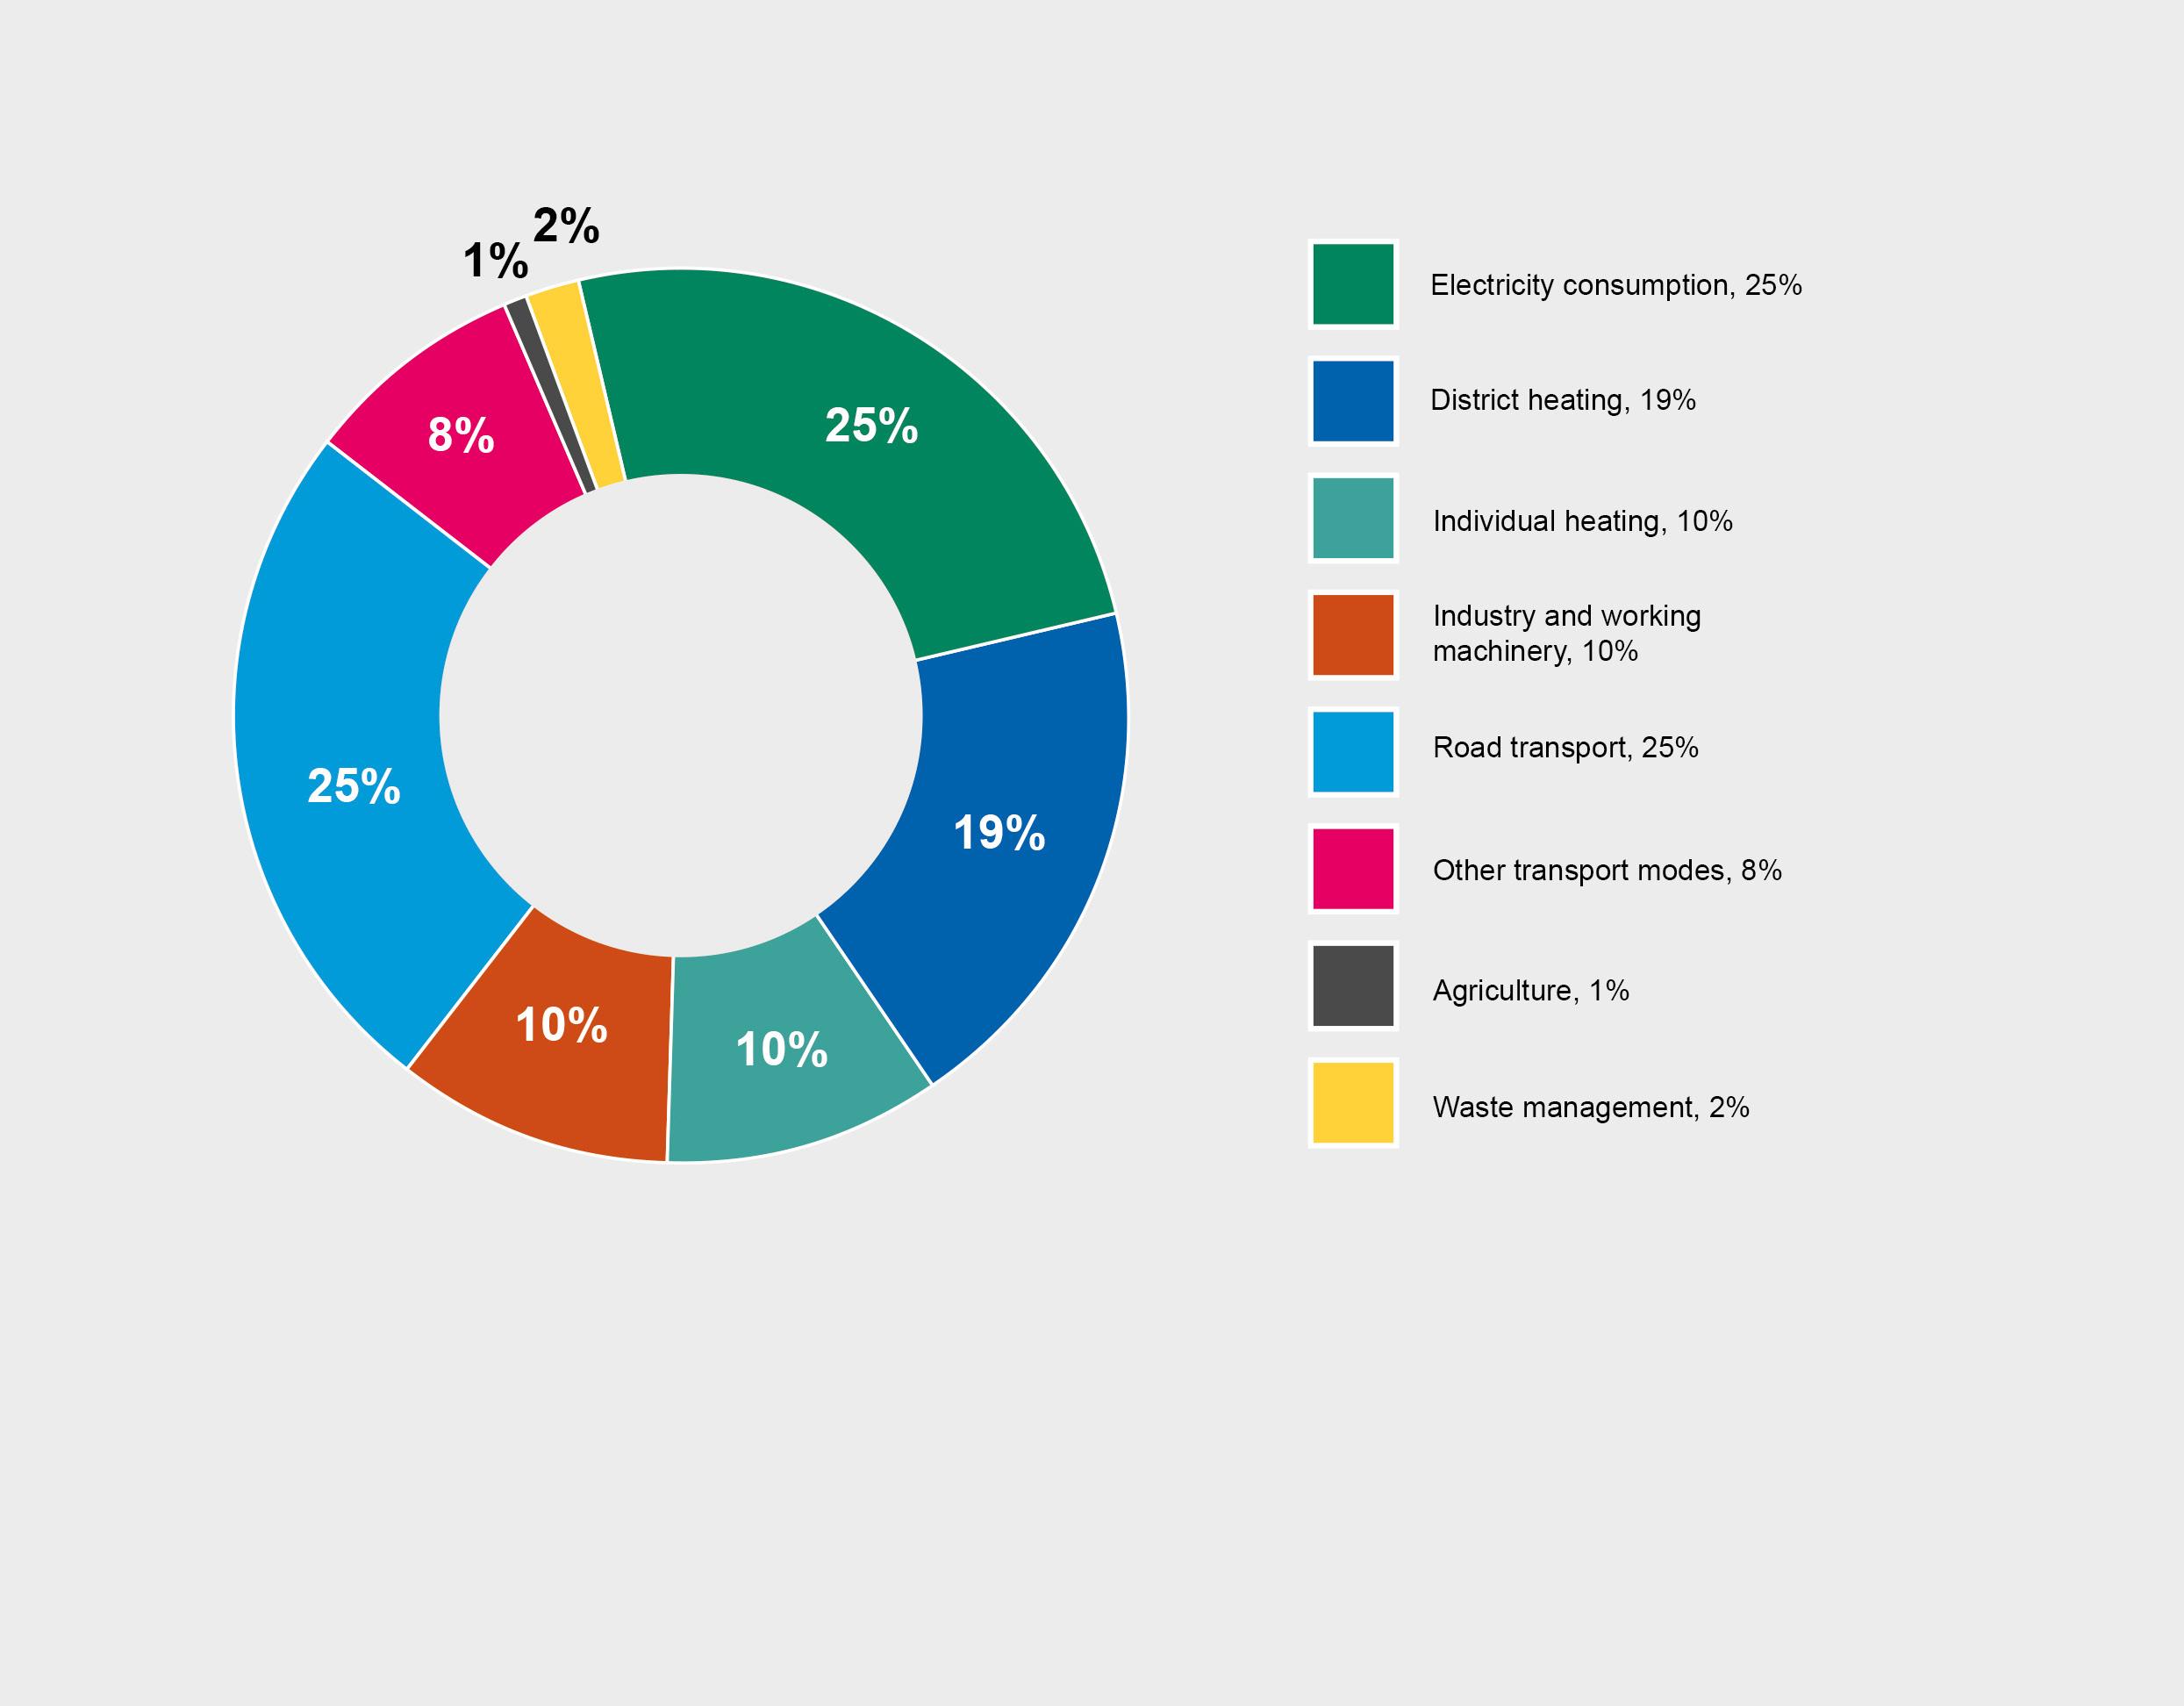
According to the CO2 report calculation meth od, normalised greenhouse gas emissions in Turku in 2020 amounted to 606.5 kt CO2-eq. The most significant sectors causing emis sions in 2020 were road transport (153.5 kt CO2-eq, 25%), electricity consumption (152.6 kt CO2-eq, 25%) and district heating (115.0 kt CO2-eq, 19%) (Figure 1).
Figure 1. Turku’s greenhouse gas emissions by sector in 2020, calculated using the CO2 report method. The development of emissions has been normalised so that it equates to the climatological normal period 1981–2010. A five-year moving average has been used for the emission factor of electricity.
The most significant sectors causing emissions in 2020 were road transport, electricity consumption and district heating.
Greenhouse gas emissions in the Turku area have decreased significantly during the years of monitoring. Since 2009, normalised emissions have remained below the level of 1990 and in 2020, emissions were 53% lower than in 1990 (Figure 2). According to preliminary information, ¹normalised emis sions hit their lowest point of the entire time series in 2021 (578.6 kt CO2-eq).
Compared to year 1990, a significant re duction in emissions has been achieved by increasing renewable energy in the production of district heating. Emissions from district
heating have decreased approximately 70% between 1990 and 2020. Emissions from individual heating (69%), industry and work ing machinery (66%) as well as electricity consumption (42%) have also decreased sig nificantly. Emissions from road transport have decreased by 27% between 1990 and 2020.
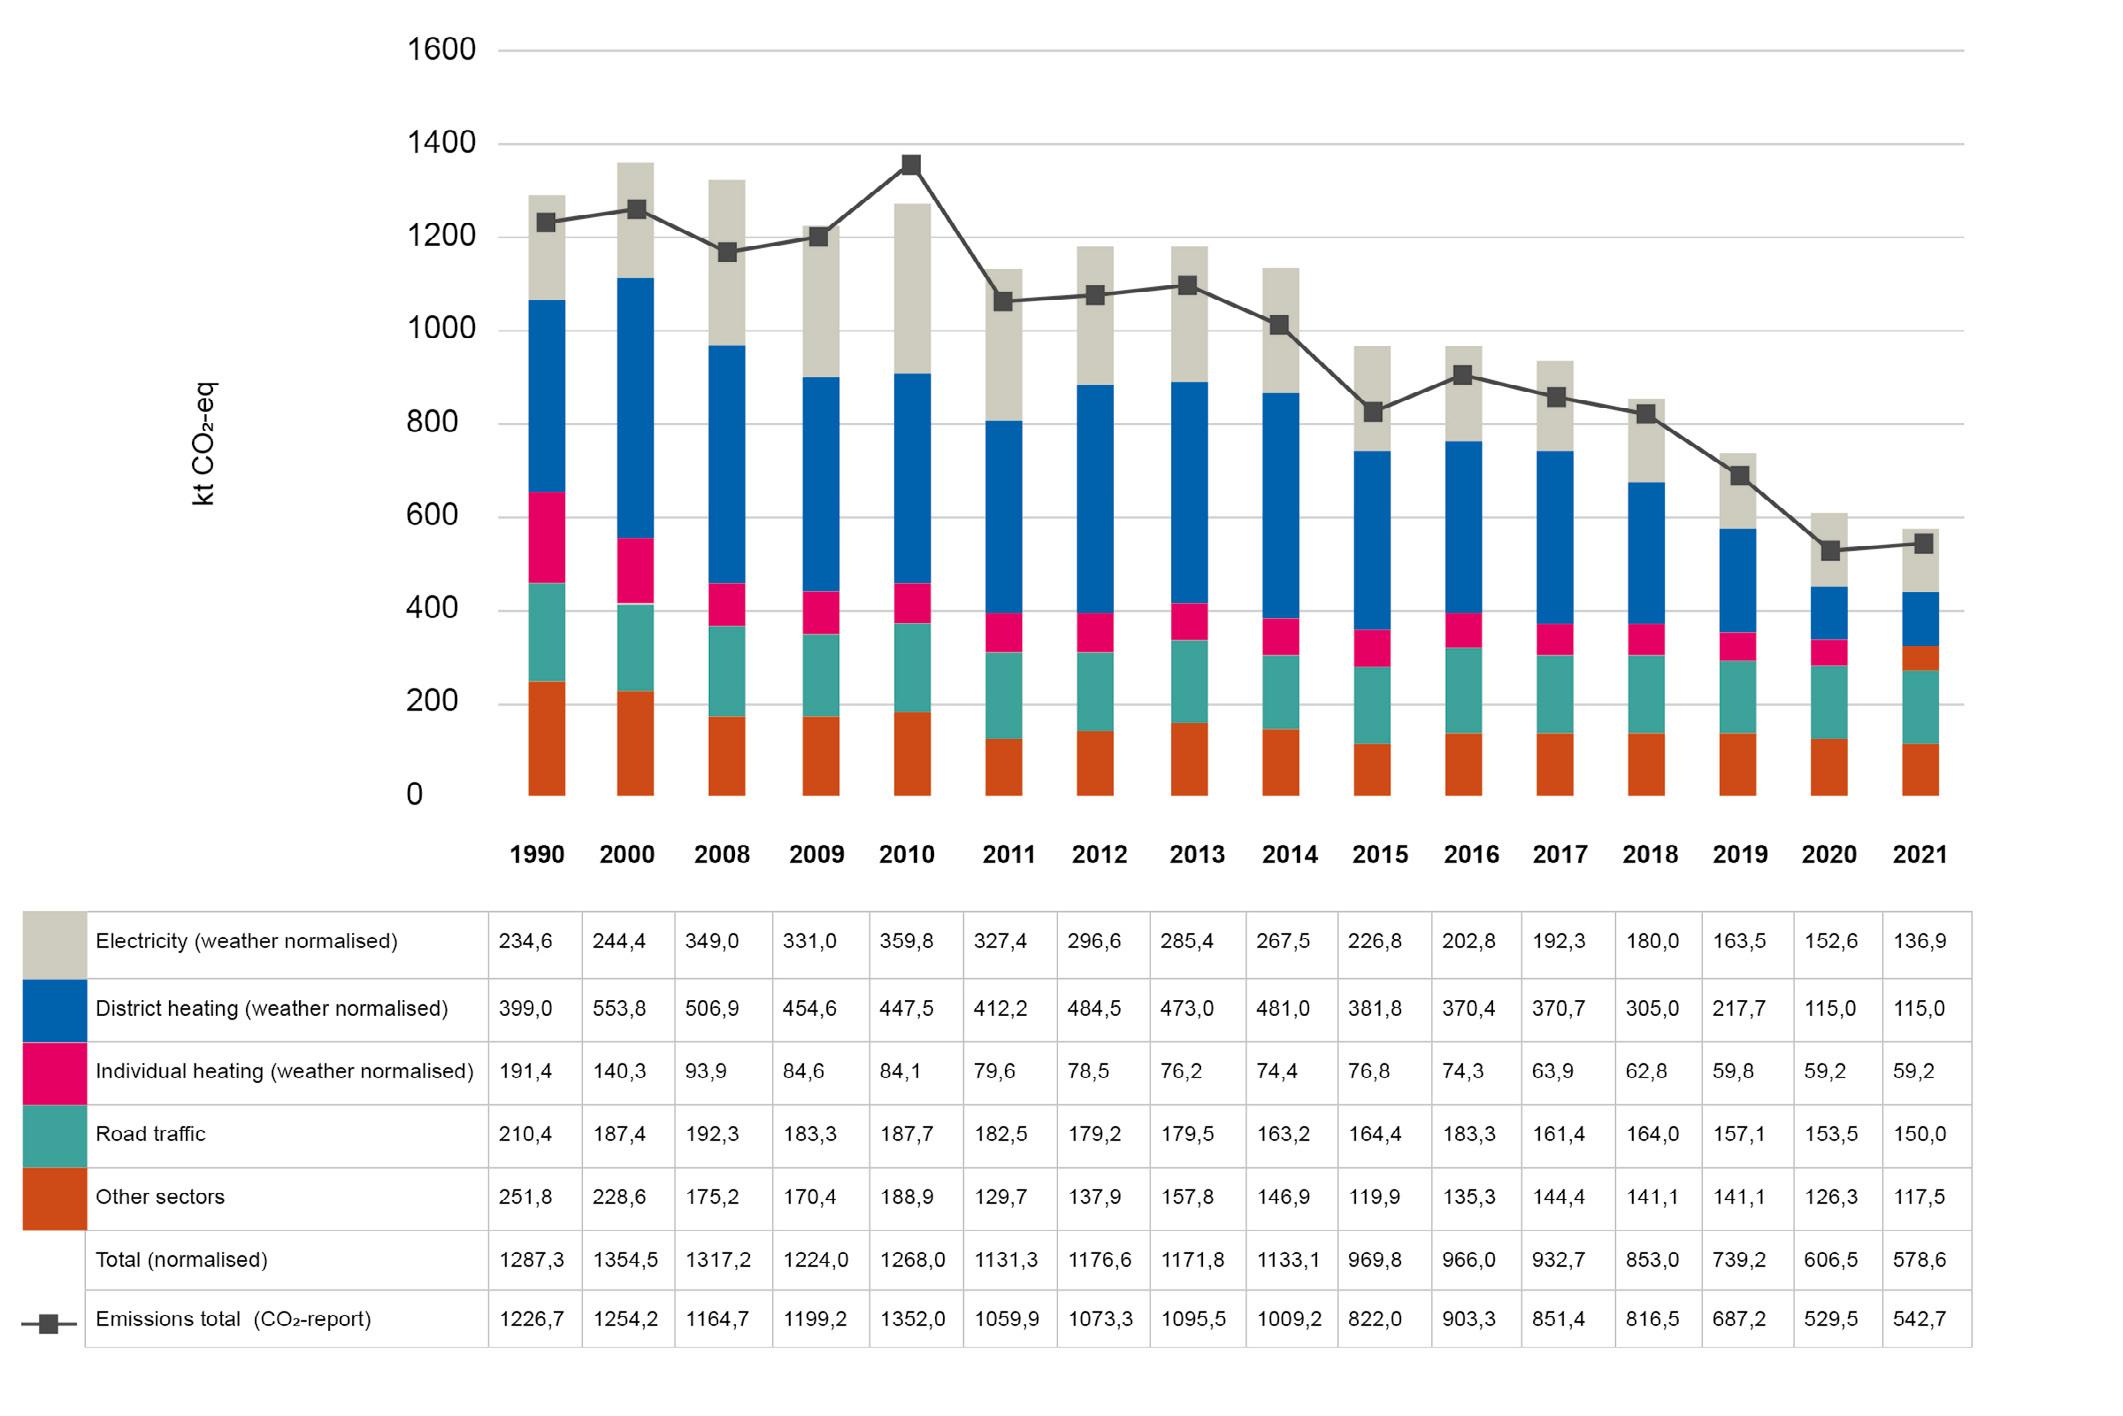
Emissions per capita have decreased by 63% from the level in 1990 (8.1 t C02-eq) by 2021 (3.0 t CO2-eq).
¹ Preliminary information on the calculation of emissions for year 2021, CO2 report 2022
Figure 2. Development of emissions in Turku in 1990, 2000 and 2008–2021, calculated using the CO2 report method. The bars represent normalised emissions, and the line represents materialised emissions.
CITY OF TURKU 18
Emissions calculation reported to the European Commission, SECAP method
The heating degree day corrected emissions of Turku in 2020, calculated using the SECAP method, amounted to 506.9 kt CO2-eq. The most significant sectors in 2020 in terms of emis sions were private and commercial transport (140.0 kt CO2-eq, 28%), residential buildings (138.8 kt CO2-eq, 27%) and non-ETS industry (106.2 kt CO2-eq, 21%) Figure 3).
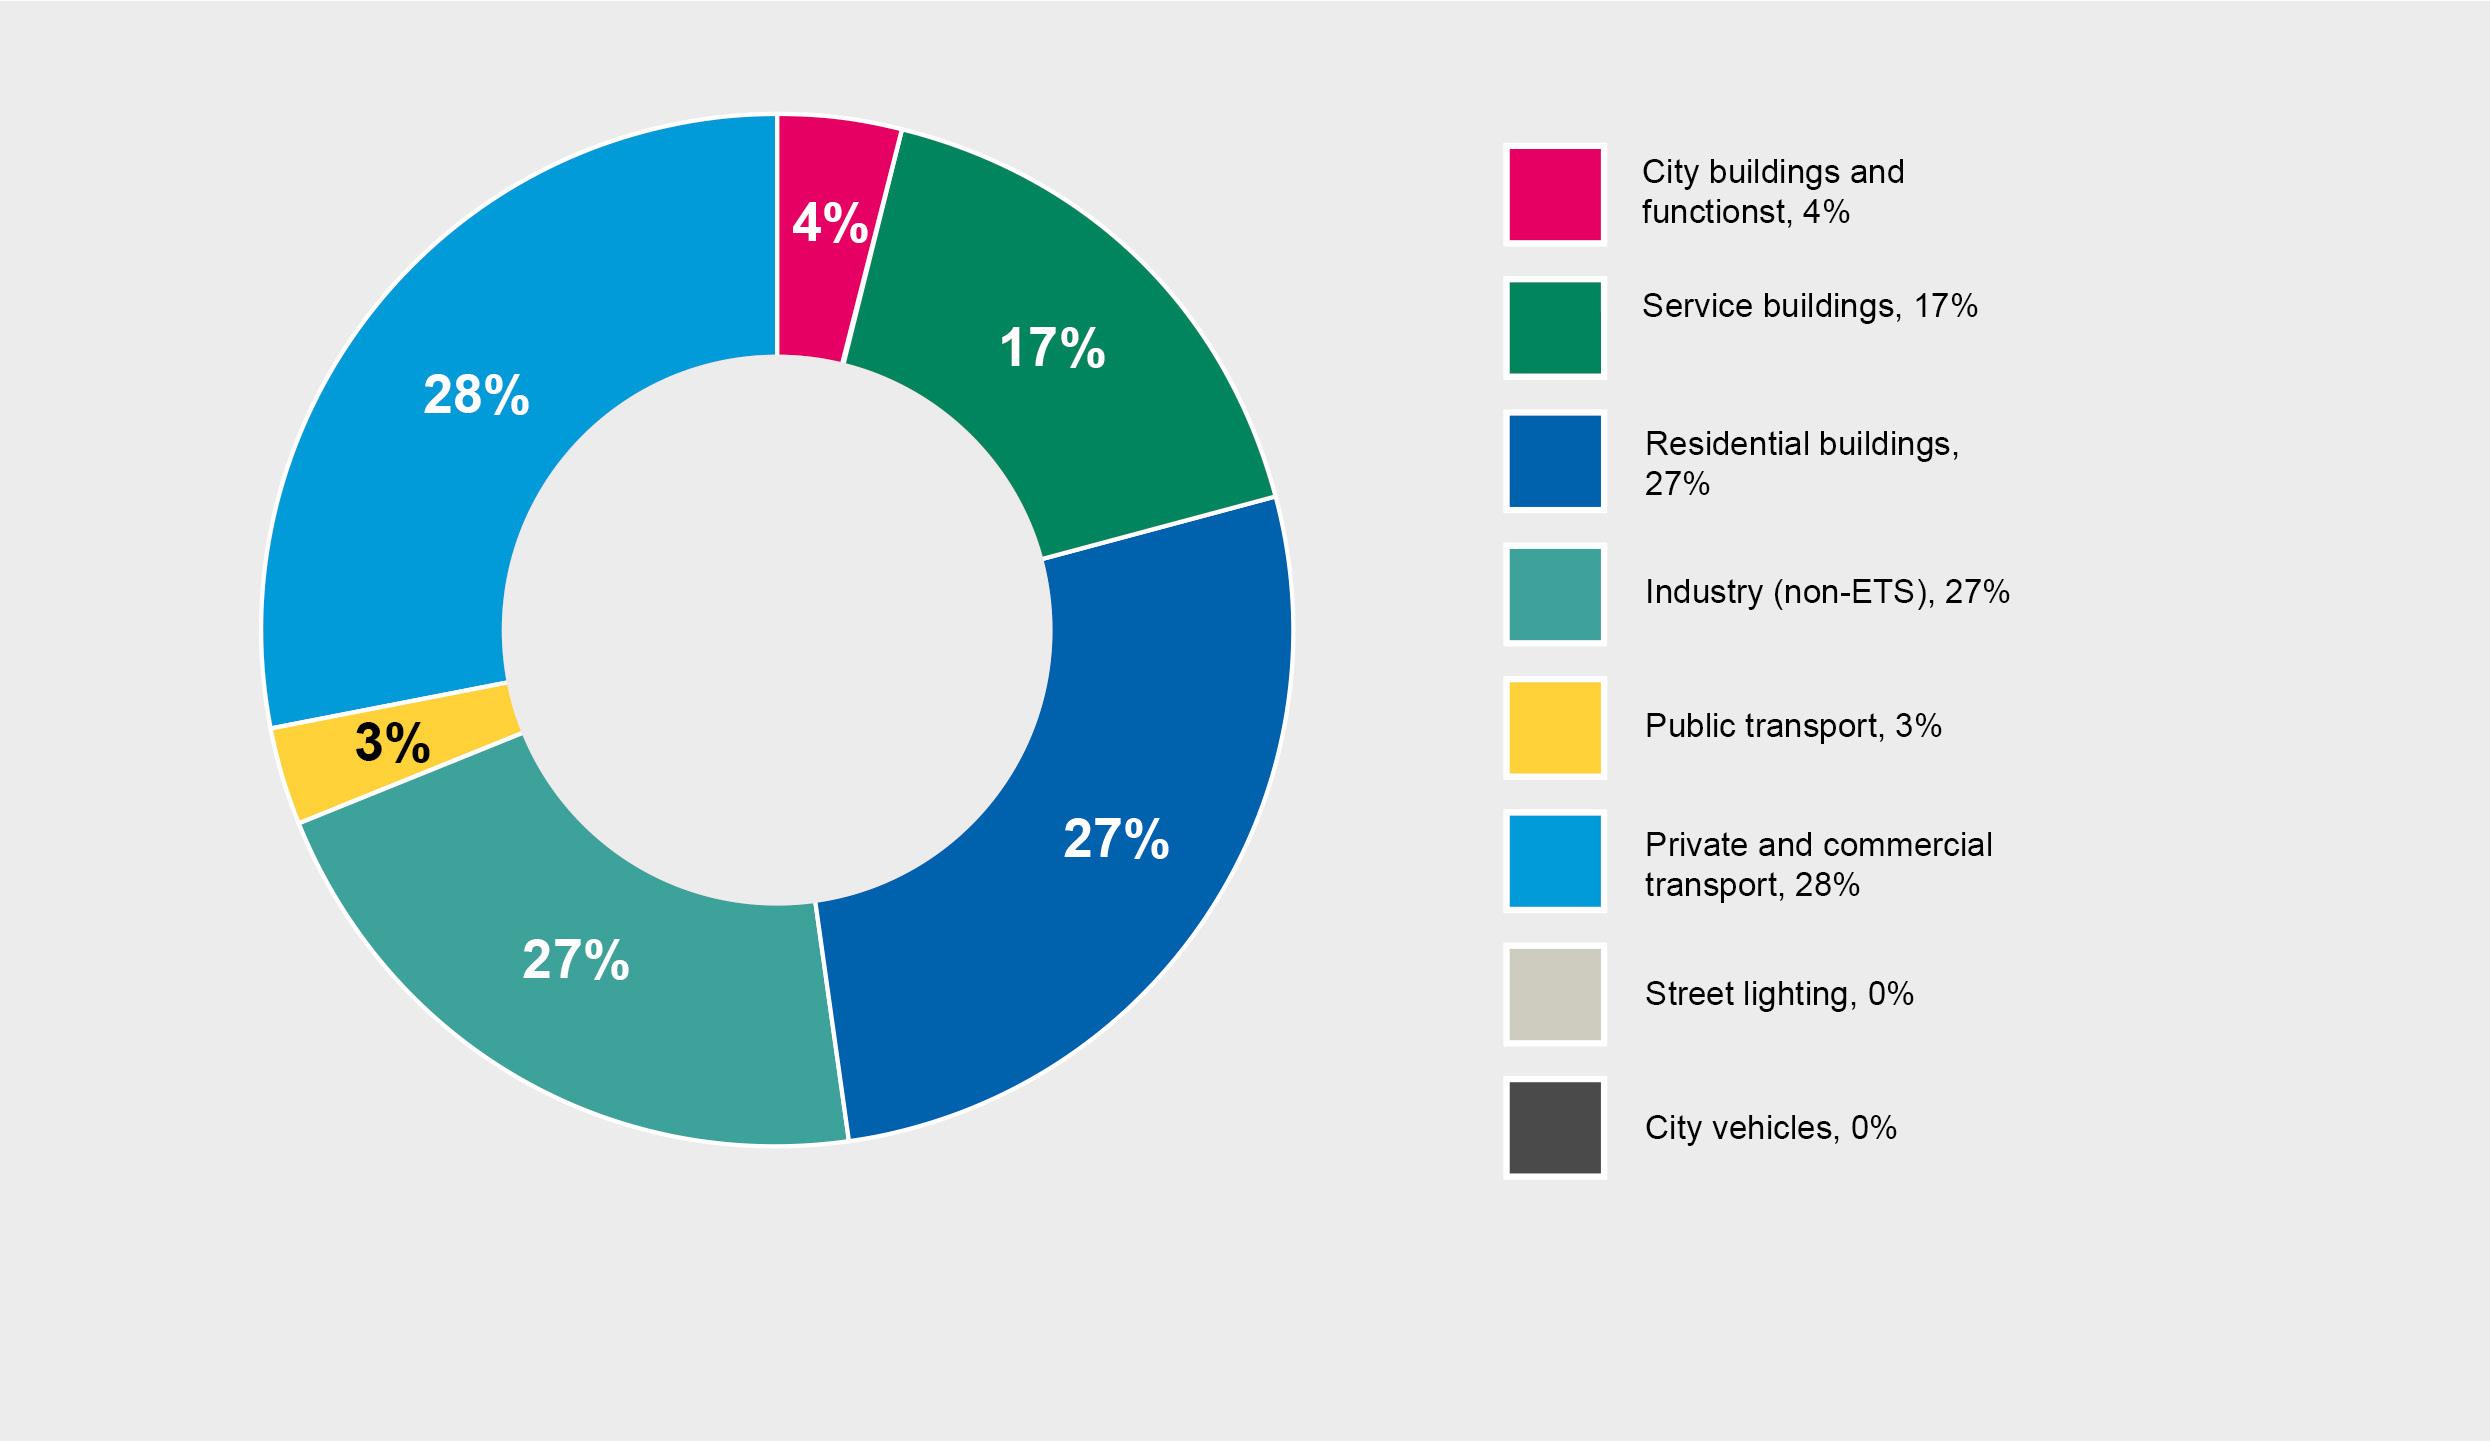
Figure 3. Emissions of Turku by sector in 2020, calculated using the SECAP method and heating degree day corrected so that they equate to the climatological normal period 1981–2010.
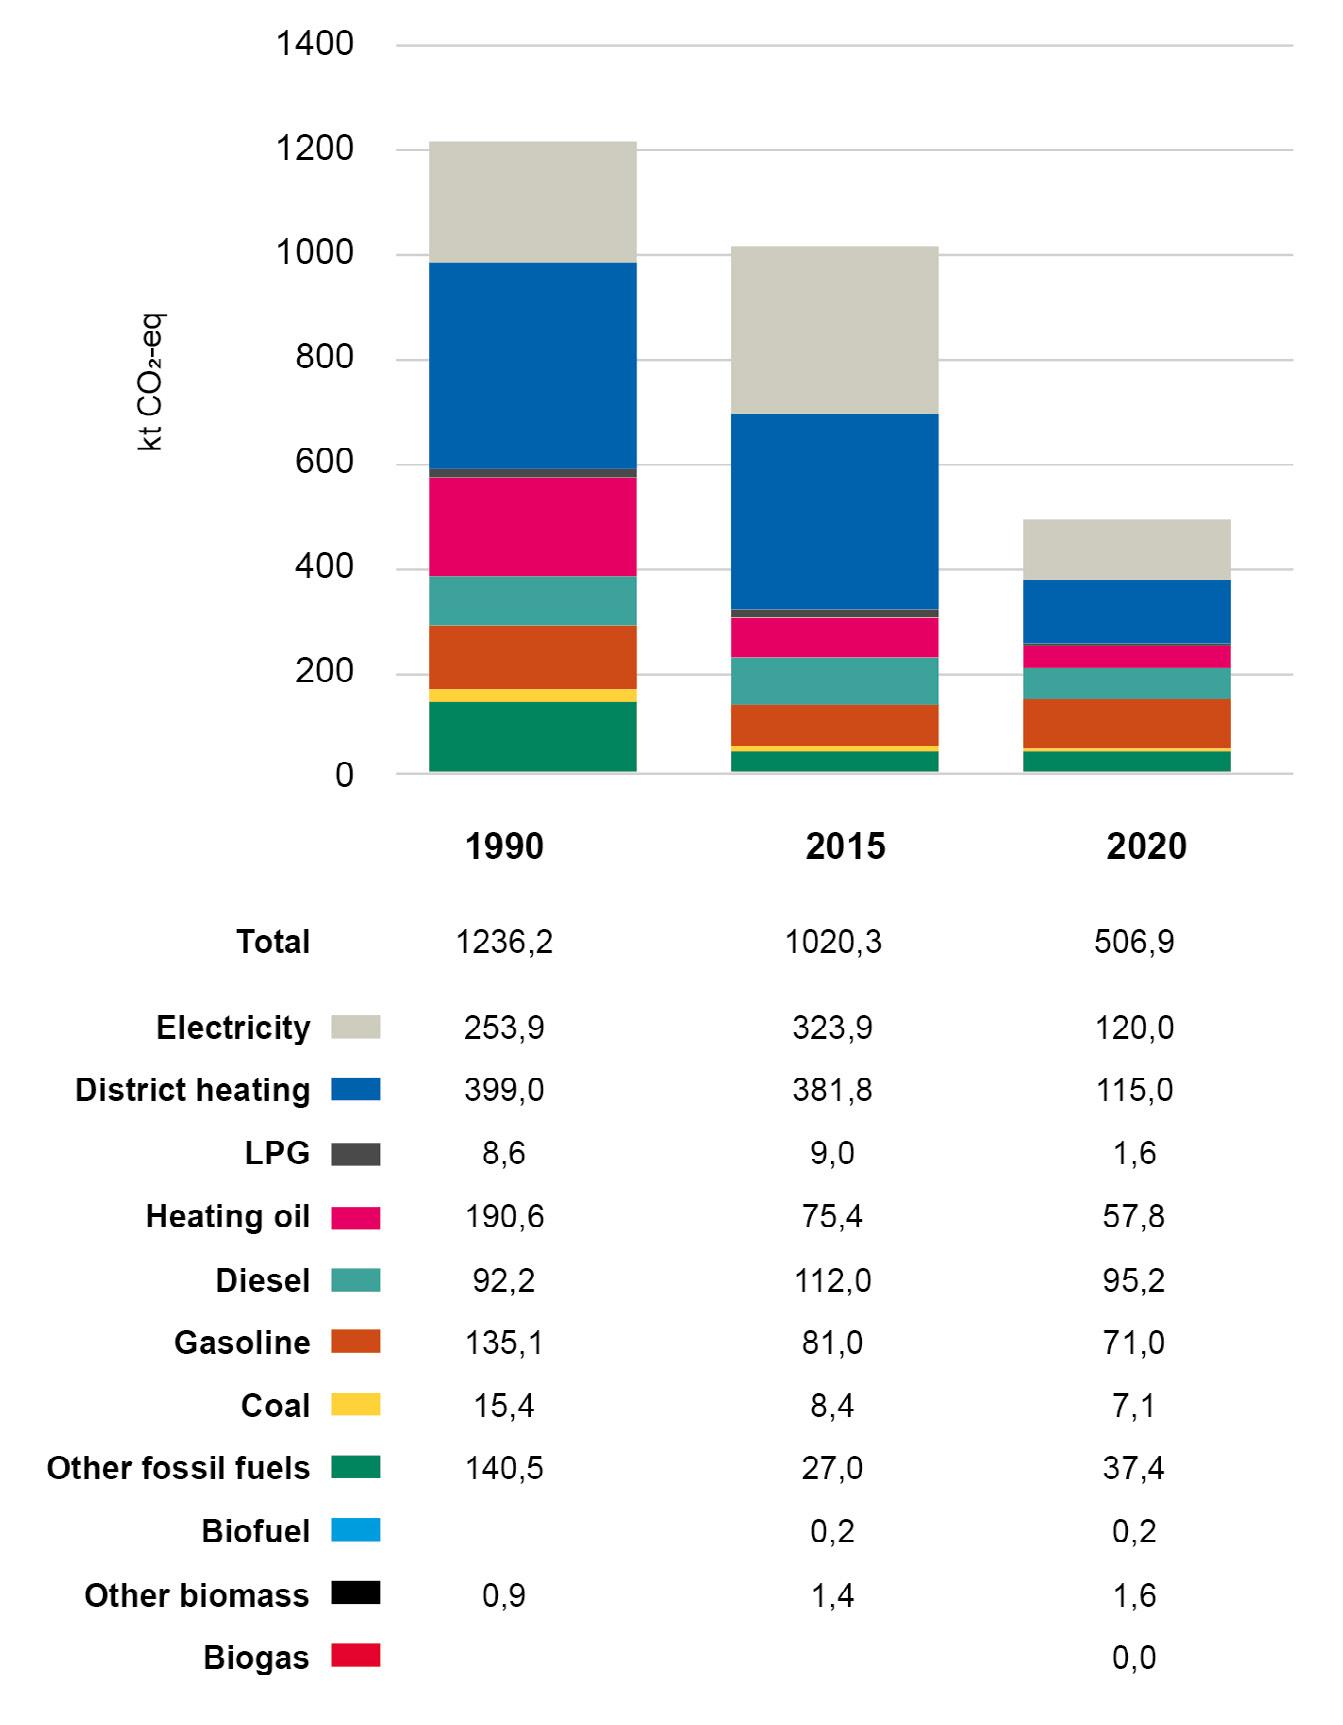
The emissions calculated using the SECAP method can be presented by sector (Figure 3) and also by source of energy (Figure 4). When examining the emissions by source of energy, it can be said that most emissions in 2020 were caused by electricity (24%) and district heating (23%).
Compared to year 1990, emissions have decreased by 59%. Between 1990 and 2020, emissions from district heating have decreased by 71% and emissions from heating oil have decreased by 70%. Similarly, emissions from fossil fuels used for industrial purposes (carbon, liquefied petroleum gas and oil) have decreased. Compared to year 2015, emissions in 2020 have decreased by 50%.
Emissions per capita in 2020 (2.6 t CO2-eq) were merely a third of the emissions in 1990 (7.8 t CO2-eq).
CITY OF TURKU 19
Figure 4. Turku’s heating degree day corrected emissions by source of energy in 1990, 2015 and 2020, calculated using the SECAP method.

CITY OF TURKU 20
Emissions per capita in 2020 were merely a third of the emissions in 1990.
2.3 Calculation of carbon sinks
Data on the annual capacity of the Turku region to absorb carbon from the atmosphere has been updated for the part of forests (approximately 37% of the surface area of Turku) on the basis of the calculation made by the Natural Resources Institute Finland in early 2022. ²This work involved estimating the carbon storages of forest stand and soil in the current situation and the change in these in timberland in the area of Turku. Also development forecasts by forest compartment were calculated for city-owned forestry land, both without fellings and with the felling target outlined in the forest plan (Urban Environment Committee 8 October 2019 § 382), which is equivalent to 40% of the early growth of forest stand.
y In the starting point, the city-owned forest area was 4,132 ha and the average volume of forest stand on forest land and poorly productive forest land was 201 m3/ha. The equivalent figures for forests owned by oth er landowners were 7176 ha and 107 m3/ ha.
y The carbon storage of city-owned forests is currently 1,800 kt CO2-eq and in both forest management scenarios (fellings 0% or 40% of annual growth) it will clearly increase by year 2035.
y The predicted carbon balance of city-owned forests in 2029 and 2035 is approximately 22 kt CO2-eq/year (no felling) and approx imately 15 kt CO2-eq/year (felling level 40%).
y The carbon storage in the forests of other landowners in 2019 was 3,000 kt CO2-eq, of which 2,000 kt CO2-eq was in the soil.
y The greenhouse gas emission balance in the forests of other landowners was negative, in other words they were a source of emissions (approximately -24 kt CO2-eq/ year).
y In this work, the change in land use that has potentially affected the current surface area of forestry land was not taken into consideration.
In the initial situation, the net carbon sinks in forests located within the area of the City of Turku practically rely on city-owned forests. The carbon balance of other forests is heavily affected by annual fellings and the great variation in them, which is currently typical elsewhere in Finland as well.
² Hilasvuori, E. et al. 2022. Metsätalousmaan puuston ja maaperän hiilivarastot ja -tase Turun kaupungin alueella 2019–2035. Natural Resources Institute Finland 2022. The report was commissioned by the City of Turku Canemure subproject.
CITY OF TURKU 21
The net carbon sinks in forests located within the area of the City of Turku practically rely on city-owned forests.
The carbon balance of privately owned forests is heavily affected by annual fellings and the great variation in them.
2.4 Greenhouse gas emissions from consumption
Municipal greenhouse gas emissions usually refer to – and municipal carbon neutrality is determined by – regional emissions cal culation models, such as greenhouse gas emissions calculated using the CO2 report model or the SECAP model. Local emissions calculation models mainly cover emissions resulting from energy consumption and waste management in the municipality as well as other emissions taking place within the geo graphic area of the municipality. For example, emissions resulting from agriculture and man ufacturing of products within the municipal area are included in the calculation regardless of where the products are consumed.
When calculating greenhouse gas emissions from consumption, all emissions resulting from consumption among municipal residents and from public procurement are included regardless of where the consumed goods have been manufactured. For example, emissions resulting from food and items consumed by municipal residents are included in the calculation even if they have been manufactured outside the municipality or outside Finnish borders.
One of Turku’s objectives is also to significantly reduce consumption-based emissions.
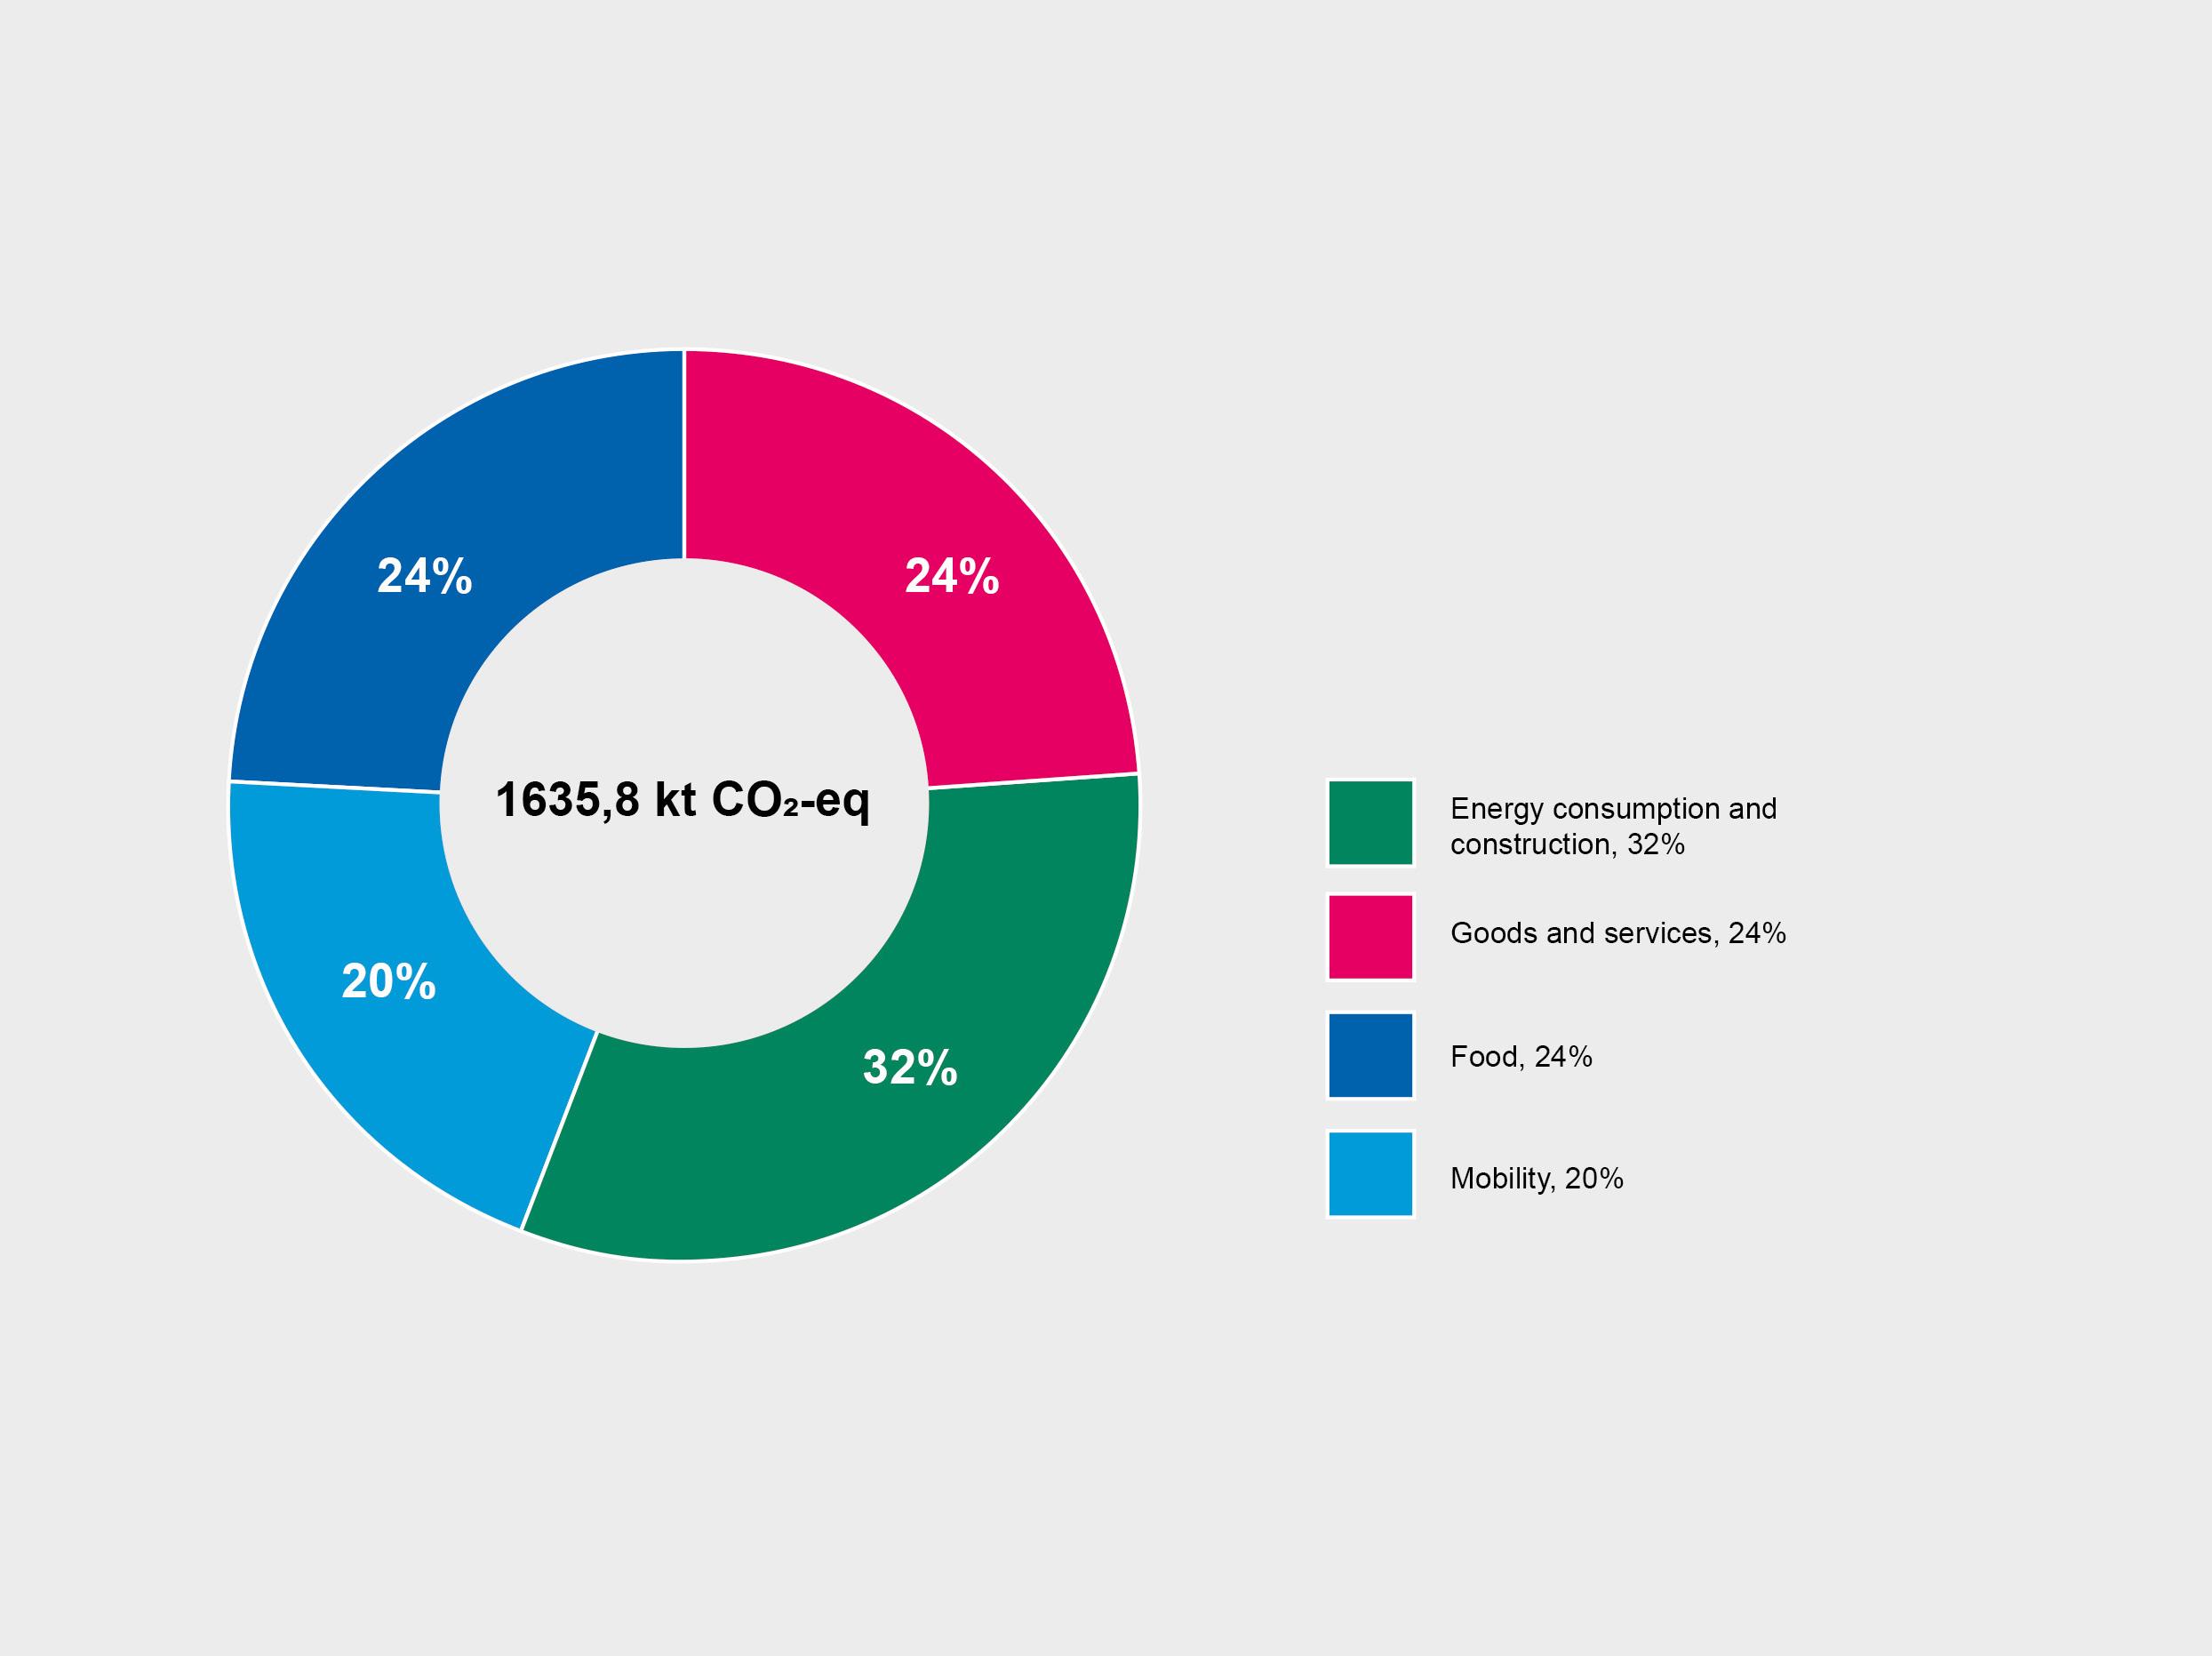
Emissions from consumption per capita in 2020 were 8.42 t CO2-eq. In order to reach the set climate targets, the consumption per capita should drop to one third of the current level by 2030.
³
Figure 5. Greenhouse gas emissions
consumption in Turku in 2020 amounted to 1,635.8 kt CO2-eq.
Local and consumption-based emissions calculation models partly overlap. In other words, they are not alternatives to each other but rather complement each other. Combined, they provide an extensive knowledge base on greenhouse gas emissions resulting from actions of the municipality and municipal residents. One of Turku’s objectives is also to significantly reduce consumption-based emissions.
In 2021, Turku participated in the Kulma project, led by Sitowise and the Natural
Resources Institute Finland. The project involved creating the first Finnish calculation model for greenhouse gas emissions from consumption that has been applied in a comparable way in a large number of municipalities. Emissions from consumption in Turku were 1,635.8 kt CO2-eq in 2020 (Figure 5). Emissions from consumption per capita in 2020 were 8.42 t CO2-eq.³
https://www.turku.fi/sites/default/files/atoms/files/kulma_kuntaraportti_turku_05012022.pdf
CITY OF TURKU 23
from
Liljeström, E. et al. 2022. Turun kulutuksen kasvihuonekaasupäästöt. Sitowise Oy and Natural Resources Institute Finland.
3. Climate change mitigation measures
3.1 Targeting the measures
Mitigation measures will be targeted as efficiently as possible on the basis of the emission distributions presented above. The measures are aimed at reducing emissions as efficiently and sustainably as possible (direct effect on emissions, indirect effect on emissions and exemplary/pilot effect). As presented in chapter 1, the measures are also based on the Turku City Group’s climate responsibility, innovation impact/business impact and participation impact.
The most significant entities of mitigation measures include:
y Carbon-neutral energy system
y Approximately half of greenhouse gas emissions in the Turku area (2020)
y Low-carbon sustainable mobility
y Approximately one third of greenhouse gas emissions in the Turku area (2020)
y Sustainable urban structure and low-carbon construction
y Affects both energy and mobility in the entire urban area
y The Turku City Group’s climate responsibility, investments and procurement
y The Turku City Group is a strong and responsible economic operator that invests in climate solutions with an impact.
y Strengthening biodiversity and carbon sinks
y Biodiversity will be strengthened and the ability of the Turku area to absorb atmospheric carbon will be improved.
y While doing this, we are also reinforcing the durability of the change
The main objectives and policies of mitigation measure entities will be presented in the next section. The measures outlined in the climate plan are continuously developed and complemented during the implementation of the plan, and they are steered as presented in chapter 1. The SECAP climate action card model has been created for defining actions.
CITY OF TURKU 24
3.2 Carbon-neutral energy system
Towards a climate-positive energy system
The Turku City Group and its partners invest in various ways in reforming the energy system. Thanks to this reformation work, the share of fossil energy has decreased rapidly, and energy efficiency has improved. New smart energy solutions are constantly developed, leading to an increased role of municipal residents in the energy transition. As society becomes electrified, more and more people are both users and producers of energy. Together with its partners, Turku is heading towards a climate positive-energy system.
A prerequisite for a carbon-neutral Turku is that all electricity, heat, cooling and steam used in the area is produced in a carbon-neutral manner by 2029 at the latest, taking into account internal offsetting within the energy sector. Several measures to reach this target have already been implemented.
y Greenhouse gas emissions have decreased by 50% between 2017 and 2021. (Source: CO2 report 2022)
y The specific emission of district heating has decreased by 67% between 2017 and 2021. (Source: Turku Energia)
y 75% of the energy produced in 2021 was produced using renewable sources of energy. (Source: Turku Energia)
A prerequisite for a climate-positive Turku is that renewable energy is produced not only for the city’s own needs but also to serve the needs of other areas. The Turku City Group develops the production of renewable energy and holdings in a way that the production
serves an area wider than Turku and helps turn Turku into a climate-positive area. The carbon handprint of Turku Energia also materialises through the development of service products and an energy efficiency partnership – resulting in reduced emissions from customers and partners.
Carbon-neutral energy system
The heat, cooling, steam and electricity used in the Turku area will be produced in a carbon-neutral manner in 2029 at the latest (taking into consideration offsets within the energy system).
y Using carbon for energy in production will end in 2022.
CITY OF TURKU 25
The Turku City Group and its partners invest in various ways in reforming the energy system.
Thanks to this reformation work, the share of fossil energy has decreased rapidly, and energy efficiency has improved.
y The share of renewable energy of electricity and heat sold by Turku Energia will be at least 95 per cent in 2025. Investments into reshaping the energy system will be made in an economically sustainable way.
y When updating the climate plan, it has been taken into consideration that exceptional sit uations relating to the security of supply and reliability of delivery may have an impact on achieving objectives during individual years.
y Impacts on sustainability and regional economy are stressed in the acquisition of renewable fuel.
y New emission-free solutions are constantly explored and developed.
y We will invest in harnessing regional waste heat and in the efficiency of the energy system as part of the development of a car bon-neutral energy system that adheres to the principle of circular economy.
y The solutions will advance economic effi ciency and profitability, and these aspects will be taken into consideration.
Smart solutions, multidirectionality and stor age will be utilised in the development of the energy system in the Turku area and region. The entire potential of the local sources of energy and production opportunities will also be used, and energy efficiency will be improved. Regional features will be taken into consideration in this work, and Turku-based energy expertise will be consolidated.
The energy transition will be implemented together with municipal residents, businesses and communities, enhancing and strengthening collaboration. In innovation and development, we will focus on solutions suitable for the region, taking regional characteristics into consideration.
y New solutions, innovations and energy expertise are developed in collaboration with businesses. We will create an operating environment that is appealing to businesses and supports their operation.
y Energy expertise and new solutions are developed in collaboration with higher
CITY OF TURKU 26
The share of renewable energy of electricity and heat sold by Turku Energia will be at least 95 per cent in 2025.
All electricity, heat, cooling and steam used in the area is produced in a carbon-neutral manner by 2029 at the latest.
education institutions, educational institu tions and development organisations.
y The needs to develop the provision of en ergy loans for renovation building will be investigated, taking national level develop ment into consideration.
y Through means such as communication and informing, residents and businesses will be more extensively activated to do re pair construction, develop energy efficiency and give up oil heating.
y Building control will be developed towards proactive quality control. Energy-efficient and sustainable construction will be ad vanced through guidance and quality con trol. We will strive towards operating models that ensure that new construction thoroughly meets the A category requirements of the energy certificate as a minimum.
In terms of the Turku City Group’s own buildings, new and innovative energy solutions will be actively sought. The level of ambition for new solutions is very high, and innovative solutions for the identified challenges will be sought through collaboration and by piloting.
y Turku Student Village will be turned into an energy positive pilot area by year 2025 with the help of the RESPONSE project.
y Experience gained from the project’s energy positive operating model will be utilised and applied, where possible, to other city districts in collaboration with the Turku City Group. The whole picture and economic viability of the energy system will be taken into consideration.
We will act as pioneers of energy efficiency Investments into energy efficiency will be
made within the entire Turku City Group and energy losses will be harnessed and/or re moved as extensively as possible. The City of Turku is a pioneer of energy efficiency and will seek to remain so also in the future.
y The city will develop and implement com prehensive energy efficiency leadership and invest in improvement of energy efficiency.
y Energy efficiency investments with credit can be made with a repayment period of 5–15 years, making use of green financing in particular. The return on investment is calculated for 10–20 years.
y In investments, the whole entity of the Turku City Group will be examined, taking into consideration both basic energy and energy consumed during use.
CITY OF TURKU 27
Turku Student Village will be turned into an energy positive pilot area by year 2025 with the help of the RESPONSE project. Experience gained from the project’s energy positive operating model will be utilised and applied to other city districts.
y The city will advance objectives for imple menting a resource-wise energy system, outlined in the roadmap towards circular economy; 1) energy will be steered wisely, 2) waste heat will be harnessed into use, 3) communities and households will implement an energy transition.
y The Turku Student Village and Science Park Kupittaa will be special target areas for energy investments until 2025. However, efforts are made to make economical ener gy investments at all times and in all areas.
y The sustainable city district Skanssi will function as a pilot area for a two-way low-temperature network and local heat production. The City of Turku and Turku Energia will continue to actively develop the area.
Energy efficiency will be taken into consideration in the selection of all design solutions. Taking energy efficiency into consideration effectively also requires anticipation and solving of challenges.
The objectives of advancing energy efficiency in the city’s own property stock and infrastructure will be prepared and steered with the help of an energy efficiency agreement.
y Energy efficiency agreement 2008–2016: a saving of 18,100 MWh achieved 2008–2016 (improvement of approximately 7.5 per cent).
y Energy efficiency agreement 2017–2025: improvement of 7.5 per cent 2017–2025 (milestone set as 4 per cent for 2017–2020).
y Energy efficiency measures/objectives/ agreement 2025–2029: the target will be set later.
In developing energy efficiency, investments will be made into technology-neutral develop ment work and into taking the best solutions into use. Smart properties and real-time data will be utilised in optimising energy consump tion and leading with knowledge.
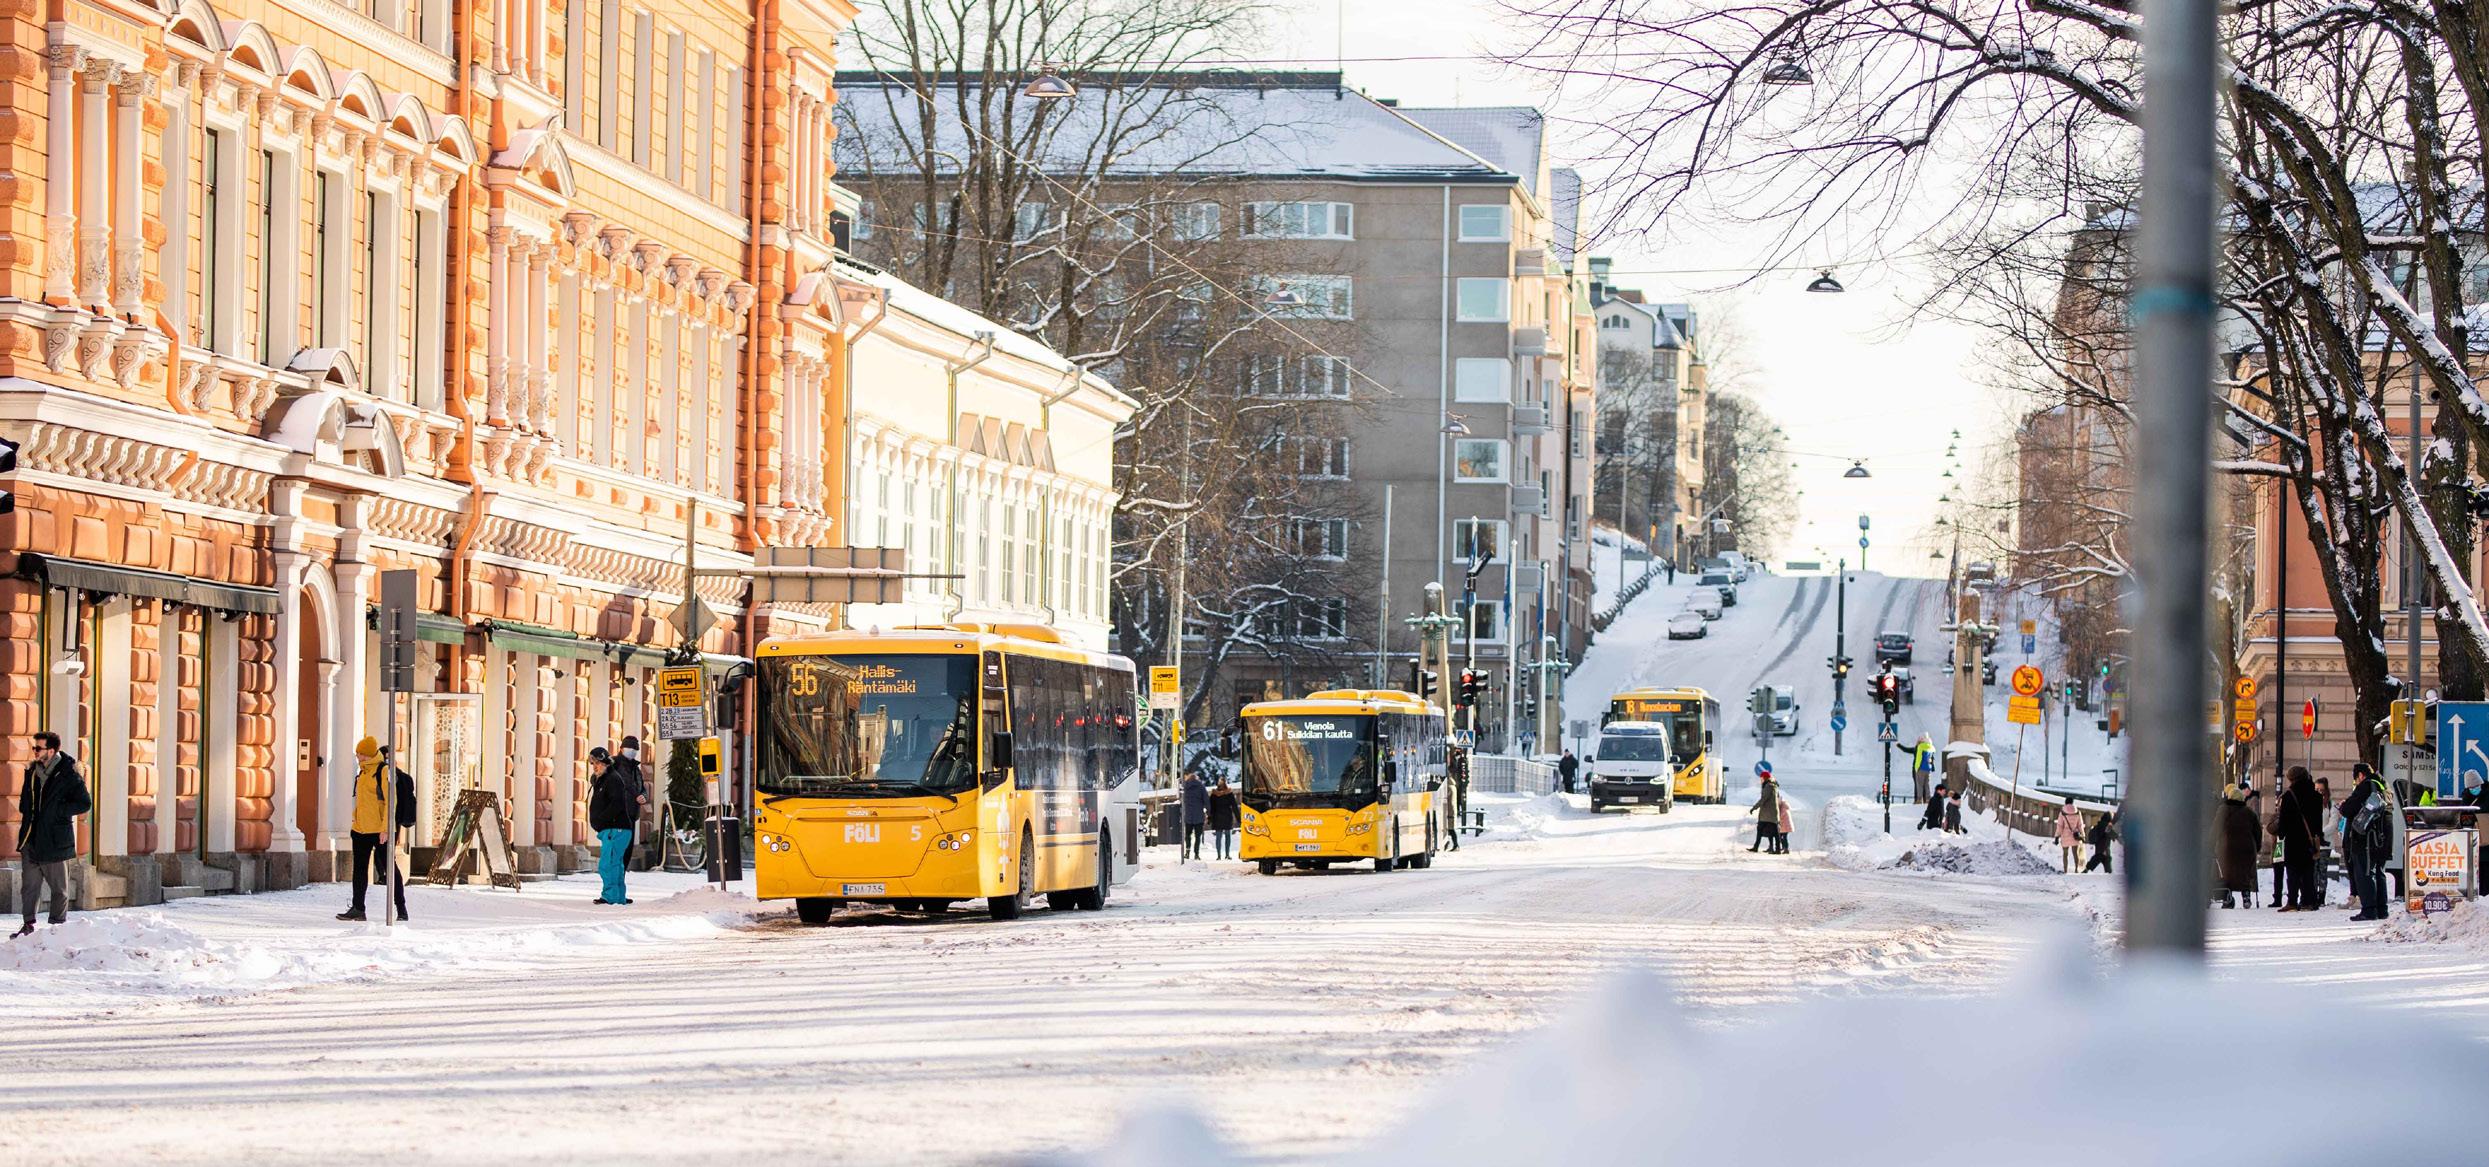
3.3 Low-carbon sustainable mobility
Active mobility and development of pub lic transport have an important role in the implementation of a carbon-neutral Turku. Simultaneously, they have a positive impact on the healthiness and safety of the urban environment, the physical and psychological wellbeing of citizens and the quality of life. New mobility solutions also represent a sig nificant development target and platform for innovations and business.
To reach the main targets of climate policy, the city will seek to reduce greenhouse gas emissions from street and road transport by at least 50% from the level in 2015 by 2029. National level targets and measures enhance reaching the targets of Turku.
CITY OF TURKU 28
The share of walking, cycling and public transport will be increased through active measures in accordance with the objectives of the Turku Master Plan 2029. The objective for the share of sustainable means of transport according to the master plan and the Structural Model 2035 for the Turku Urban Region is over 66 per cent in 2030.
Turku is a pioneer of new kind of mobility and seeks to reach completely carbon-neutral mobility in the 2030s. To reach the climate neutrality target, Turku actively creates sustainable mobility culture that includes both old and new ways of sustainable mobility as well as smart technical and digital solutions facilitating mobility.
y Plans for sustainable urban mobility will be created for both passenger traffic and for goods traffic (SUMP, SULP). These will include concrete annual steps to reduce
emissions from traffic and to implement a change in modes of transport in line with the goals of the climate plan.
y The need for mobility will be reduced by taking systematically into account the perspective of sustainable mobility in the location and construction of the service
CITY OF TURKU 29
To reach the main targets of climate policy, the city will reduce greenhouse gas emissions from street and road transport by at least 50% from the level in 2015 by 2029.
The objective for the share of sustainable means of transport is over 66 per cent in 2030.
network for both private and public services (including purchased services).
y The use of public transport will be signif icantly advanced by means of urban and traffic planning. This is sustained particular ly by a mixed and condensed urban struc ture and service network.
Cycling and walking conditions will be signifi cantly improved around the year and citizens will be encouraged to actively engage in everyday exercise, incidental exercise and free time exercise. Cycling has a significant positive impact on wellbeing and health, and the benefits of cycling and active exercise will be promoted variedly.
y The development programme for cycling will be actively implemented and resources will be allocated for updating it.
y The development programme for walking and public spaces will be finalised and brought forward for decision-making.
y Enhanced winter maintenance of cycling routes will be expanded.
y The network plan for bicycle transport will be finalised and brought forward for decision-making. The drafting of a similar plan for outside the city centre will be initiated. Sufficient resources will be secured to prepare and implement the plans.
y The offering of city bikes will be extended and diversified.
y Parking policies and guidelines for sizing of parking lots will be implemented in a result-oriented way and sufficient resources will be allocated for them.
y The city will also invest in new alternative means of transport such as electric bikes and related charging and parking infrastructure. Such alternative modes of transport will be advanced that reduce the use of private cars as part of the trip chain by promoting walking, cycling and public transport.
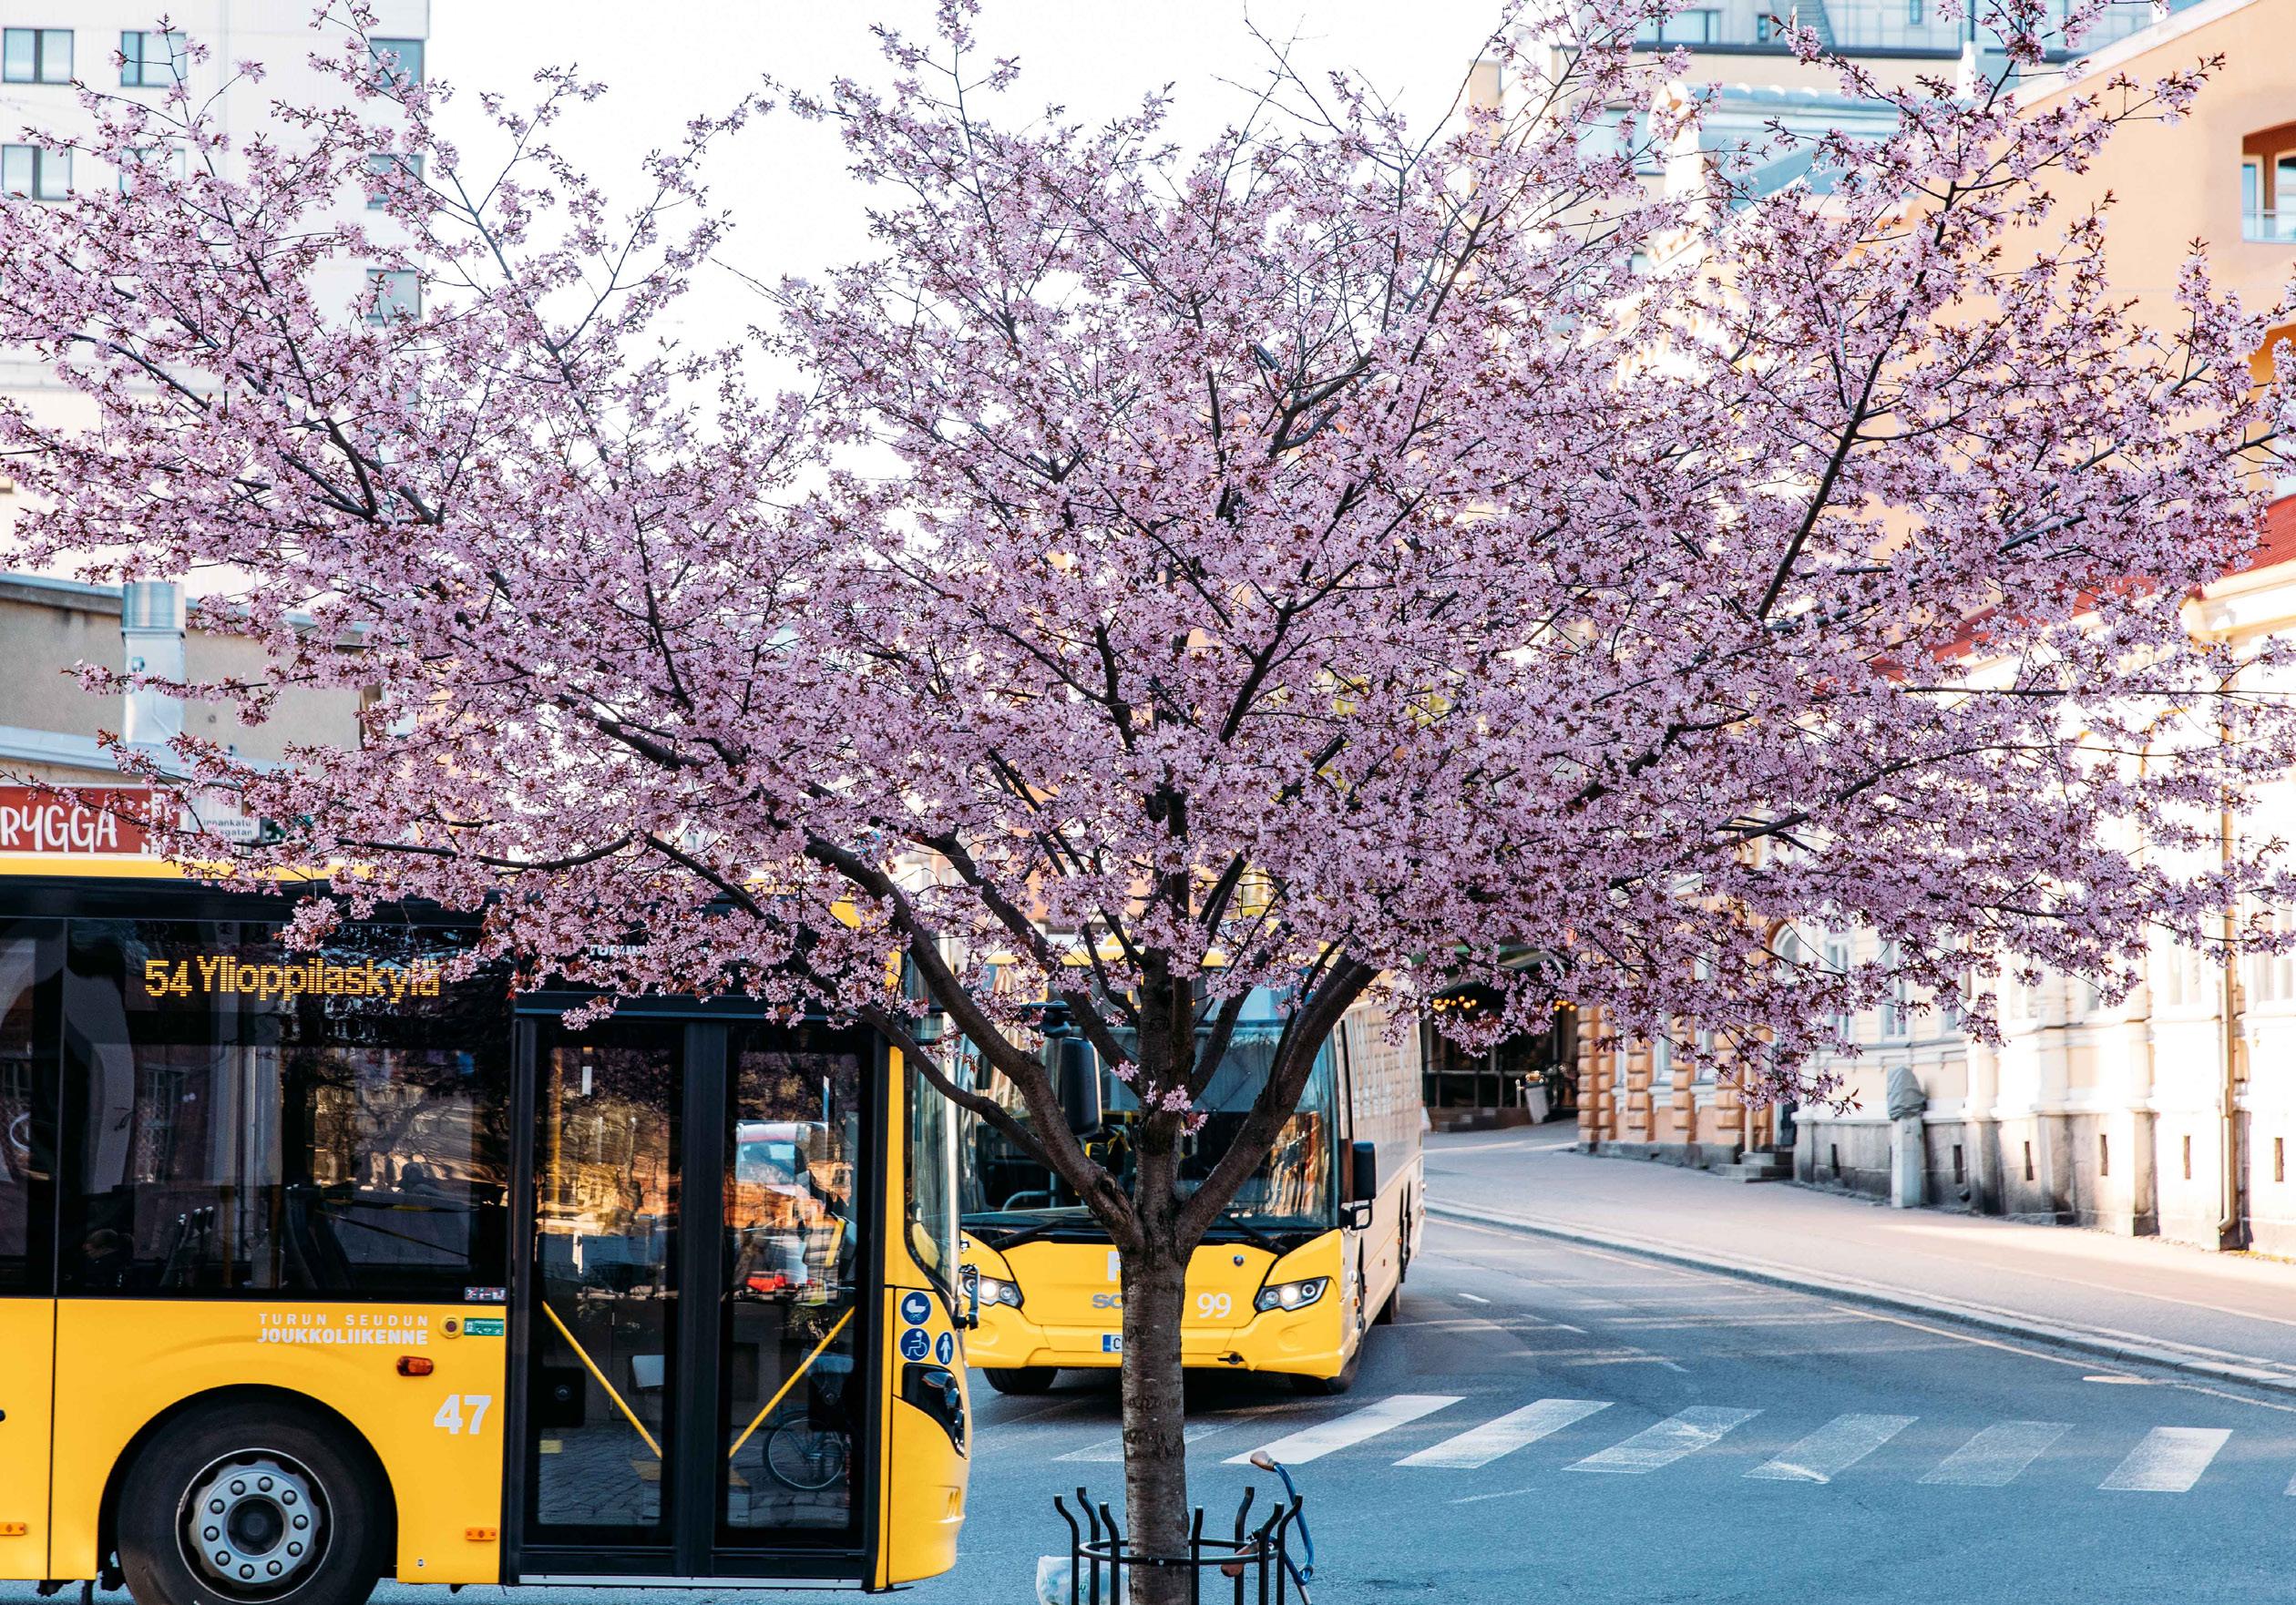
Developing public transport and increasing its use is important for reducing greenhouse gas emissions caused by mobility. At the same time, reducing emissions caused by growing public transport is a significant and exemplary climate measure.
y Public transport in Turku will be turned into a carbon neutral service by 2029. Turun kaupunkiliikenne Oy will transition to carbon neutrality already by 2025.
y Electrification of lines will proceed in the pace enabled by technical development and competitive tendering. Electrification will be
CITY OF TURKU 30
Cycling and walking conditions will be significantly improved around the year and citizens will be encouraged to actively engage in exercise in every possible occasion.
complemented with other vehicles that comply with the Clean Vehicles Directive.
The service capacity of public transport will be significantly improved in order to reach the carbon neutrality objective of the City of Turku and to support sustainable and attractive urban development.
y Trunk routes will be taken into use by 1 July 2025 at the latest as planned.
y A decision on the implementation of the tramway will be made once the plans have been completed.
y The public transport service will be subject to active communication and its use will be supported through campaigns and spreading of information.
Public transport is a strong and natural part of trip chains and development and imple mentation of Mobility as a Service concepts. Innovative businesses and developers have a significant role as solution makers.
y Trip chains will be advanced by creating so-called mobility points where it is easy to switch from one means of transport to another.
y The role of commuter train transport as part of smooth and sustainable trip chains will be advanced.
The transition to low-carbon vehicles and mo bility services will be actively advanced.
y Investments in Mobility as a Service solu tions will help reshape means of transport and steer the market towards lower emissions.
y Emissions from car traffic will also be reduced by investing in promotion of electric cars and charging networks. A general plan will be created for electric charging and its implementation will be advanced.
y Through guidance and communication, housing companies will be encouraged to implement charging points.
y The offering of emission-free shared-use vehicles will be actively advanced.
y Offering the city’s own vehicles for resident use will be advanced.
Low-emission logistics will be developed in the area with the help of smart digital solutions and other measures.
CITY OF TURKU 31
Public transport in Turku will be turned into a carbon neutral service by 2029.
The transition to low-carbon vehicles and mobility services will be actively advanced.
y Opportunities to have an impact on the emissions of the logistics chain by using low-emission zones will be investigated.
y The green deal agreement for emission-free construction sites will be implemented. The Turku City Group’s subsidiaries will be en couraged to join with their own measures.
y Together with operators in the field, the City of Turku will advance transition to emis sion-free transport services.
y Together with operators in the field, the City of Turku will invest in the use of biogas and hydrogen in transport, particularly in heavy transport.

The Turku City Group is committed to sustain able mobility.
y From the outset, vehicles acquired for the City of Turku and for the Turku City Group’s subsidiaries will be electric or use renewable sources of energy. Fossil-fuelled vehicles can only be acquired in exceptional cases, and this needs to be justified.
Existing fossil-fuelled vehicles will be re placed in accelerated pace (taking the life cycle impact into account).
y In the procurement of transport services, the City of Turku will invest in electric vehi cles and vehicles that function with renewa ble energy.
y Charging points for electric cars and electric bikes will be implemented in city properties, contributing to the formation of a wider ser vice network for electric charging.
y Effort will be put into creating better condi tions for active commuting in City of Turku and Turku City Group offices, and taking electric employee bikes into use will be advanced.
y Staff will be encouraged to use public transport by providing employee travel tickets.
y Electric shared-use vehicles and/or services offering them will be procured for business-related mobility.
y Staff parking will be reduced, and parking will be made chargeable. Staff will be en couraged to use sustainable forms of trans port and emission-free cars
The development of waterborne transport, air transport and tourism towards a low-carbon direction will be advanced.
y The city will actively contribute to strength ening low-carbon trip chains and services in tourism in the archipelago and the whole Southwest Finland.
y Taking shore-side electricity into use in the harbour will be advanced.
y In leisure boating, switching to emis sion-free options will be encouraged.
y The Turku City Group will seek to support the transition into low-carbon sea and air transport in collaboration with operators in the field.
y The climate aspects of mobility will be taken into consideration in City of Turku marketing.
3.4 Sustainable urban structure and low-carbon construction
Reaching the climate targets of the City of Turku requires sustainable development of the urban structure in the entire functional urban region and implementation of low-carbon construction in house building, infrastructure building as well as in pre-construction. The urban structure affects emissions from energy, mobility, construction of infrastructure and pre-construction. The urban structure and construction also have a significant role in
adapting to climate change. From the point of view of climate resilience, securing biodi versity and ecosystems is crucial: efficient impactful measures must be directed to nature conservation and restoration.
Sustainable urban region
Turku will be active and use initiative in de veloping the community structure in the urban area. Through its own actions, Turku will advance climate objectives in the entire func tional urban area.
y At the level of Turku urban region, sus tainable development of the community structure is steered and advanced in collab oration with regional municipalities and the Government through the regional structural model (the Structural Model 2035 for the Turku Urban Region) as well as the MAL agreement (agreement concerning land use, housing and transport planning) and the plans, transport system work and transport system plan implementing it.
y The MAL agreement and related collaboration are a significant tool for Turku in consolidating development that supports carbon neutrality. Greenhouse gas emissions in the urban region are an indicator of the MAL agreement and they have been calculated for the entire region and for each of its municipalities since 2015.
Sustainable community structure in Turku
Within the city borders of Turku, sustainable development of the community structure is steered through land use planning, land use, traffic planning, construction and development projects related to these. The master planning process 2029 of Turku supports reaching carbon neutrality and preparing for climate change.
CITY OF TURKU 33
y The City of Turku will seek to plan the city in a way that services, jobs and leisure activities would be better accessible without a private car. Therefore, the objective is to create a solid and more versatile commu nity structure where housing, services and workplaces are intertwined. Opportunities for implementing lush car-free superblocks (cf. Pihlajaniemi) will also be explored.
y In accordance with the objectives of the master plan, over 85% of residential floor surface areas in city plans will be located in a zone of condensing sustainable urban structure.
y Water bodies and green areas form a solid and varied ecological network. Missing connections identified in the master plan work will be implemented and existing ur ban structure will be developed in a greener direction. Particular attention will be paid to fostering existing forests and trees in land use planning work and in the implementa tion planning that is in progress.
y When increasing the offering of detached houses, areas with detached houses that are in close proximity of public transport will be prioritised. The City of Turku will invest in developing existing areas with detached houses by creating incentives for repairing houses and cutting up plots.
y Limitations caused by natural conditions will be anticipated in land use planning. The resulting economic and environmental risks will also be taken into consideration. Any contradictions with objectives of sustainable development will be identified. Very careful planning from the point of view of adaptation is necessary if any construction takes place in flood risk areas.
y Assessing climate impacts and anticipating climate resilience will also become a standard part of city planning, covering both the low-carbon aspect and adaptation to climate change.
y A low-carbon and climate-resilient city will be strongly promoted in applicable city spearhead projects throughout the implementation of the Climate Plan 2029. The new solutions and development partnerships of the sustainable city district Skanssi will be implemented ambitiously, and the resulting solutions will also be applied in other districts/areas. Sustainable solutions will be searched by default and pilots will be developed also in other areas.
CITY OF TURKU 34
The urban structure and construction have a significant role in adapting to climate change.
From the point of view of climate resilience, securing biodiversity and ecosystems is crucial: efficient and impactful measures must be directed to nature conservation and restoration.
Energy-efficient city of walking, cycling and public transport
Land use will be developed urban economical ly and energy efficiently by making use of ex isting community structure and infrastructure. Housing, services, trading venues, workplace areas and infill construction focus areas will be placed in a way that they advance a city of walking, cycling and public transport. The sustainable urban mobility plan (SUMP) being prepared for Turku, the urban region transport system work and the MAL investment plan support the goals of the climate plan.
y Walkers and cyclists will be provided with uninterrupted main connections of high quality, safe routes and convenient city cen tre arrangements.
y The regional public transport system will be based on a trunk network with competitive speed and frequent operating times.
y Transport planning will be strongly and systematically utilised to support sustaina ble mobility. Projects enabling sustainable mobility will also be prioritised in the con struction and maintenance of traffic routes throughout the year.
y When planning the location of services, ac cessibility with sustainable means of trans port will be taken into consideration.
Low-carbon construction
Sustainable construction will be implemented not only in pilot areas but also comprehen sively in the entire city area. Wood construc tion, the use of other low-carbon construction materials and material-efficient hybrid con struction will be advanced in both the Turku City Group’s own construction and by means of land use planning (including anticipating future requirements). The aspect of circular economy will be taken into consideration in all construction work. Repair construction and reuse of old buildings and materials will be increased where possible. The City of Turku will seek to minimise the carbon footprint of pre-construction, infrastructure building and housebuilding throughout the life cycle in an active and target-oriented way.
CITY OF TURKU 35
Very careful planning from the point of view of adaptation is necessary if any construction takes place in flood risk areas.
The urban structure affects emissions from energy, mobility and construction of infrastructure.
The City of Turku will seek to plan the city in a way that services, jobs and leisure activities would be better accessible without a private car.
The City of Turku service areas and the Turku City Group’s subsidiaries responsible for facil ities, residential buildings and/or other build ings have the following aims:
y planning, building and/or procuring projects for new spaces in a way that high-level en vironmental classification can be obtained for the premises (e.g. RTS 4 stars);
y when new buildings are placed in the area of the Science Park spearhead project and/ or the Skanssi district and/or Turku city cen tre, construction projects and public space projects should be prepared in a way that exemplary and innovative energy solutions and other sustainable development solu tions can be implemented in them
y improving the energy efficiency and other environmental impacts of the old building stock, implementing renewable energy investments in collaboration where possible and looking after sustainable reuse of buildings;
y advancing the use of sustainable modes of transport by favouring bicycles and other means of light transport / by paying attention to the quality of bicycle parking facilities;
y reducing emissions from pre-construction, infrastructure building and construction sites (e.g. the green deal agreement for emission-free construction sites).
In the construction and maintenance of the City of Turku’s own facilities, other things to be observed and maintained include guidelines on facilities that express the city’s ambitions/ internal guidelines about low-carbon construction in facilities management, low-carbon construction processes and cards, and the approach of energy management.
y Energy efficiency in city premises will be improved and investments into renewable energy will be made where possible.
y In the procurement of new premises, energy efficiency will be included in the procurement criteria.
y New buildings will be designed to match energy category A. In repair projects, opportunities to improve energy efficiency will be investigated.
y A life cycle assessment will be carried out for all new building projects and major repair projects. The assessment will include the carbon footprint, carbon handprint and costs.
CITY OF TURKU 36
Housing, services, trading venues, workplace areas and infill construction focus areas will be placed in a way that they advance a city of walking, cycling and public transport. The sustainable urban mobility plan support the sustainable community structure.
3.5 Investments, procurement and climate responsibility
By acting responsibly, the City of Turku and the Turku City Group’s subsidiaries can significantly reduce direct and indirect greenhouse gas emissions caused by their operations, show climate leadership and set a good example. At the same time, they reform and develop their operation, implement Turku’s strategy and values and together create the story of a carbon-neutral Turku. As outlined in the Mayor’s programme 2021–2025, Turku will take climate budgeting into use. The climate targets will be taken into account especially in decision-making concerning land use, energy, construction and mobility.
By sustainable investment principles and practices, the carbon footprint of investments will be reduced. At the same time, we are advancing the attainment of our carbon neutrality target for year 2029.
y Investment projects of the Turku City Group will be examined comprehensively in nor mal planning and decision-making process es, looking at the entire life cycle. Not only costs but also climate impacts will be taken into consideration.
y The City of Turku will seek to take the cli mate budget into use when the preparing of budget for year 2023 starts. Where pos sible, the EU taxonomy will be taken into consideration when making investments, so that green funding can also be utilised.
y In investments and procurement, the City of Turku will seek to promote circular economy solutions and reduce consumption of natu ral resources.
y Sufficient resources will be allocated and sufficient expertise ensured for examining
CITY OF TURKU 37
As outlined in the Mayor’s programme, Turku will take climate budgeting into use when the preparing of budget for year 2023 starts. Where possible, the EU taxonomy will be taken into consideration when making investments, so that green funding can also be utilised.
The aspect of circular economy will be taken into consideration in all construction work. Also, a life cycle assessment will be carried out for all new building projects and major repair projects. The assessment will include the carbon footprint, carbon handprint and costs.
the climate impacts of investments and for implementing responsible investments.
y The visibility of climate-responsible invest ments in communications and in the nation al media will be enhanced.
Procurement principles and practices will have an impact on the carbon footprint of procurement.
y We will implement measures in line with the procurement strategy that support the attainment of the climate plan’s tar gets and the transition to carbon-neutral procurement.
y Climate impacts, environmental impacts and life cycle impacts will be stressed in procurement as much as possible. Sufficient resources will be allocated for this, and expertise will be reinforced in collaboration.
y Regional collaboration in procurement and competitive tendering will be reinforced in order to implement the climate plan and to increase its impact.
y Proactive communication and interaction with the market about how the climate plan will affect future procurement will be in creased, for instance by organising market dialogues.
y The positive climate impact of procurement will be ensured through sufficient support, monitoring, control and reviewing. Sufficient resources will be allocated for these.
The Turku City Group delivers good and ac tive climate work. All city units and the Turku City Group’s subsidiaries seek to implement resource-wise approaches such as saving energy, advancing sustainable mobility, re ducing material loss, fostering an operational culture that supports sustainable development and circular economy, and maintaining a rea sonable consumption level in terms of natural resources.
Actions for City of Turku services, service areas and units as well as the Turku City Group’s subsidiaries include:

Climate impacts, environmental impacts and life cycle impacts will be stressed in procurement as much as possible.
y reinforcing an operating culture that sup ports achieving climate and corporate re sponsibility targets;
y advancing resource wisdom and planning climate measures, environmental measures and corporate responsibility measures;
y actively participating in the implementation of innovative and impactful climate meas ures and creating the story of a CarbonNeutral Turku;
y allocating and enhancing staff training and eco-support activities to support this.
3.6 Strengthening biodiversity and carbon sinks
Biodiversity and the securing of ecosystems have a considerable impact on the mitigation of climate change and adaptation. According to the sixth assessment report of the Intergovernmental Panel on Climate Change, 30–50 per cent of land, fresh water and seas on the planet need to come under efficient protection or environmental rehabilitation to secure the functionality of ecosystems.
By decision of the City Board, Turku has signed the European Commission Green City Accord, committing to taking a significant step in preserving and improving biodiversity and taking part in European collaboration (City Board 23 November 2020). Approximately 12% of species that have been classified as endangered in Finland can be found in Turku. Turku has a significant responsibility over protection of nature, and nature is also an important factor of comfort, health and vitality in the area.
y To implement the city strategy, turning Turku into a nature city will become a collective
goal of Turku residents and a project that everyone can take part in.
y A decision on the action plan to protect biodiversity will be made during 2022 and the implementation of the plan will be reinforced within the Turku City Group and in collaboration with citizens, businesses, communities and partners.
y The objectives include extensive and productive implementation and collaboration to increase biodiversity and improve the living conditions of different species.
y Endangered natural habitats and species will be comprehensively identified, and their preservation will be advanced and secured. The implementation is also enhanced by the updated European Union Biodiversity Strategy and the reform of the nature conservation legislation.
CITY OF TURKU 39
Approximately 12% of species that have been classified as endangered in Finland can be found in Turku. Turku has a significant responsibility over protection of nature, and nature is also an important factor of comfort, health and vitality in the area.
y The Turku City Group’s own nature meas ures will be enforced in an exemplary way. By means of communication and involvement, citizens, businesses, commu nities and partners will be encouraged to participate.
In order for Turku to reach carbon neutrality, carbon sinks in the area need to be increased. Increasing the ability of vegetation and soil to absorb carbon is an efficient and inexpensive climate measure that also has many other sig nificant positive effects. A carbon sink absorbs and stores some chemical compound that contains carbon – usually carbon dioxide. In photosynthesis, plants and algae turn carbon dioxide in the air into their own biomass.
Turku will seek to increase the carbon storage in the local vegetation and soil as follows:
y The existing forests will be fostered prioritising climate impacts, biodiversity and recreational use. The forests will be managed in a sustainable way, in line with the forestry plan that is updated at suitable intervals.
y Forest ownerships will be increased by land acquisition and by afforestation of suitable areas. Particular target areas include peatlands, which can be restored for offsetting purposes.
y When planning afforestation projects, reports clarifying the city’s green structure, such as a survey on complementing ecological corridors, will be taken into consideration.
y The knowledge base on areas suitable for afforestation and for planting trees will be reinforced. The impacts on biodiversity, landscape values and recreational use values will be taken into consideration.
y The existing green areas will be preserved where possible. Urban nature and urban landscaping will be increased as the city becomes more condensed. Green areas will be developed and maintained sustainably.
CITY OF TURKU 40
In order for Turku to reach carbon neutrality, carbon sinks in the area need to be increased.
According to the sixth assessment report of the Intergovernmental Panel on Climate Change, 30–50 per cent of land, fresh water and seas on the planet need to come under efficient protection or environmental rehabilitation to secure the functionality of ecosystems
y Incentives will be created for landowners to increase the carbon storage, for instance by developing the local offsetting system.
y The principles of carbon farming will become part of the use of city-owned fields, rental agreement conditions and methods (such as structure lime/gypsum).
y The use and cultivation of common reed to absorb carbon will be initiated as an experiment.
y Biochar will be taken into use as soil improvement material. The development of biochar production in the Turku area will be promoted.
Turku observes and participates in the development of new nature-based and technological solutions and develops collaboration with stakeholders by:
y Raising awareness among landowners and real estate owners about topics such as sustainable forestry and by involving them in reaching the targets of carbon sequestration.
y Observing and taking into use solutions that enable capturing of carbon dioxide. Bringing together local businesses and operators that offer solutions for capturing carbon dioxide.
y Observing and, where possible, advancing the taking into use of wood and hybrid con struction methods.
y Investigating and developing opportunities for creating economic incentives to increase carbon sinks.
y Actively taking part in municipal projects reinforcing carbon sinks.
3.7 SECAP climate action cards
Reacting to climate change and implementing climate measures is a right of every Turku resident and everyone can take part in the story and creation of a carbon-neutral Turku. This is what makes our story a shared and a strong one. At the same time, measures of the Turku City Group need to be supported by actions of citizens, businesses and communities in order for the carbon-neutral city area to materialise.
Participation and co-development also help to gain all possible business, innovation and participation benefits from ambitious climate actions. All willing and capable operators must have an opportunity to participate in the creation of a carbon-neutral Turku and its story. To enable this and to describe the actions as concisely and at the same time
CITY OF TURKU 41
The SECAP card for businesses and communties is a short, user-friendly and guidancegiving way to create climate actions and to make them a part of implementing a carbon-neutral Turku together.
comprehensively as possible, we have devel oped the SECAP climate action card and tak en it into use in 2018. We have also created a shared platform for climate actions.
The SECAP card models have been made to serve both the city organization and the Turku City Group’s subsidiaries as well as other operators. The goal is to activate citizens, communities, businesses and universities – the entire civil society – to join the work of creating climate actions and implementing a carbon-neutral Turku. Chapter 1 contains more details on how the cards are annually linked to the implementation and steering of the climate plan.
The SECAP card for businesses and com munties is a short, user-friendly and guidance-giving way to create climate actions and to make them a part of implementing a carbon-neutral Turku together. At the moment (on
28 February 2022), there are 90 cards in total. A table with SECAP climate action cards and examples of cards can be found in Annex 2.
In other words, Turku implements continu ous open climate work: climate measures are planned, developed, implemented and monitored constantly in collaboration. The approach of doing things together and partic ipating through actions will also be applied to actions implementing circular economy and strengthening biodiversity. The actions of the City of Turku, the Turku City Group and Turkubased businesses and communities that contribute to the creation of a leading nature and climate city in line with the city strategy are put together, made visible and accelerated collectively. Climate actions of city residents are activated by means of communication and involvement, as described in section 1.5.
Reacting to climate change and implementing climate measures is a right of every resident in Turku. Everyone can take part in creating carbon neutral Turku.
⁵
4. Evidencing attainability of climate target
4.1 Climate targets of Turku
Turku is a pioneer of climate work and has set ambitious goals for mitigating climate change. Turku is aiming at a reduction of at least 75 per cent in greenhouse gas emissions from the level in 1990 by 2025 and a reduction of 90 per cent by 2029. In 2029 Turku will be climate neutral. Carbon neutrality has been defined in a way that the remaining emissions in the area are compensated either by carbon sinks or by other offsetting mechanisms. The goal for year 2035 is reinforced climate posi tivity, in the calculation of which an emission reduction of 95% has been used as an estimation later in this document. The attainability of the set targets has been examined through a scenario analysis.
4.2 Methods and assumptions of scenario
The greenhouse gas emissions of Turku in 2020 form the basis of the scenario analysis. When estimating the development of emissions, the effects of national level climate policies and measures have been taken into consideration. These have been assessed on the basis of, among others, the Mediumterm Climate Change Policy Plan (KAISU 2), the report “Hiilineutraali Suomi 2035 – ilmasto- ja energiapolitiikan toimet ja vaikutukset” (HIISI)⁵, data in sectoral low-carbon roadmaps⁶ and objectives set in the current
Government Programme. In addition to na tional policies and measures, the impact of the climate plan’s measures on greenhouse gas emissions has been taken into consider ation in the scenario. The most relevant as sumptions for the scenario calculations have been presented in Table 1. The development of emissions has been examined using green house gas emissions calculated with both the CO2 report method and the SECAP method.
Hiilineutraali Suomi 2035 – ilmasto- ja energiapolitiikan toimet ja vaikutukset (HIISI), https://www.hiisi2035.fi/ ⁶
Työ ja elinkeinoministeriö, 2020, Yhteenveto eri toimialojen vähähiilitiekartoista, https://julkaisut.valtioneuvosto.fi/bitstream/handle/10024/162494/TEM_2020_52.pdf?sequence=1&isAllowed=y
CITY OF TURKU 43
Turku is aiming at a reduction of at least 75 per cent in greenhouse gas emissions from the level in 1990 by 2025 and a reduction of 90 per cent by 2029. In 2029 Turku will be climate neutral. The goal for year 2035 is reinforced climate positivity.
Table 1. Underlying assumptions for scenario calculations.
Parameter
National climate policy and measures Climate measures of the City of Turku and stakeholders
Electricity consumption
Electricity consumption is expected to increase moderately. Electrification of transport and industry will increase consumption of electricity, but on the other hand, improved energy efficiency will contain it. The energy transition of municipal residents and the energy efficiency measures of the City of Turku, for instance, will contain the growth of consumption so that it will be limited to 0.5% per year.
Emission factor of electricity The production of electricity in Finland will be nearly emission-free by 2029 thanks to national level measures.
District heating consumption
The energy production of Turku Energia will be carbon neutral by 2029 (apart from exceptional situations related to security of supply and reliability of delivery as well as use of support fuels).
The district heating network will expand to some extent, and as the urban structure becomes more condensed, more and more properties will join. However, the energy transition of municipal residents, the energy efficiency measures of the City of Turku and measures to reduce network losses will contain the growth so that the consumption in 2029 will remain at the same level as in 2020.
Emission factor of district heating National level measures will enhance giving up carbon. The production in Turku Energia will be carbon neutral by 2029 (giving up carbon and having 95% carbon neutral production in 2025).
Oil consumption in individual heating
The consumption of heating oil will decrease by 90% from the level in 2020 by 2029 as a result of national level measures and measures of the City of Turku, such as the Energy transition project.
Use of fuel for industry and working machinery
Street and road transport
The use of carbon will end, and the use of oil will be halved from the level in 2015 by 2029, thanks to national and local measures. Emissions from working machinery will decrease with the help of measures in the green deal agreement for emission-free construction sites.
National level measures such as the biofuel distribution obligation and the electrification of transport will reduce emissions by 29% from the level in 2015 by 2029. National level measures will support measures of sustainable lowemission mobility in Turku.
Measures of enhanced mobility and sustainable mobility will reduce emissions by 21% from the level in 2015 by 2029.
Public transport
National measures such as electrification of transport, biofuel blending obligation and support for public transport will reduce emissions from public transport.
Other modes of trans port (rail traffic, water borne transport and air traffic)
Public transport will be carbon neutral and will have improved service in 2029, and the use of public transport will have increased.
The emissions will decrease at the same ratio as emissions from road transport.
Agriculture Emissions from agriculture will decrease by approximately 8% from the level in 2020 by 2029.
CITY OF TURKU 44
Waste management
Local carbon sinks
National
Emissions from waste management will decrease by 40% from the level in 2019 by 2029.
City-owned carbon sinks and carbon sinks of private landowners will strengthen continuously in 2023, 2029 and 2035. The estimation is based on the report of the Natural Resources Institute Finland on the situation in 2019.
Offsetting measures The development of various kinds of offsetting methods will be monitored, and by utilising these methods Turku will be carbon neutral in 2029. In the scenario depicting climate positivity in 2035, the offsets have been assumed to be at least equal to those in 2029.
4.3 Attainability of climate targets
Results of scenario calculations, CO2 report method
The normalised emissions calculated using the CO2 report method for the years 1990, 2000 and 2008–2021, and the scenarios for years 2025, 2029 and 2035 are presented in Figure 6. An estimation of the carbon sinks in the area and the use of offsetting measures in 2029 and 2035 have also been presented. On the basis of the development of emissions in line with the scenario analysis, greenhouse gas emissions in Turku in 2025 would be 341.9 kt CO2-eq, in other words 73% lower than in 1990. In 2029, emissions would be 87% lower than in 1990. This means that Turku will fall short of the set emission reduction target by approximately 40 kt CO2-eq. However, the objective of carbon neutrality in 2029 will be achieved, when taken into consideration local carbon sinks and other offsetting measures, making the carbon balance in the city in 2029 0 kt CO2-eq.
Emissions will continue to drop from 2029 to 2035. However, approximately 75 kt CO2-eq of emissions will remain left. To reach the target of climate positivity, further measures
need to be identified and implemented, and carbon sinks need to be increased. The de velopment of carbon dioxide capture needs to be examined, and the same goes for different kinds of offsetting possibilities. To reach the target of climate positivity, carbon sinks need to be maintained and other offsetting measures must be developed.
CITY OF TURKU 45
Parameter
climate policy and measures Climate measures of the City of Turku and stakeholders
The greatest emission reductions between 2020 and 2029 will be achieved by transitioning to carbon-neutral electricity, by transitioning to carbon-neutral district heating and through measures reducing emissions from road traffic.
The greatest emission reductions between 2020 and 2029 will be achieved by transi tioning to carbon-neutral electricity (151.2 kt CO2-eq), by transitioning to carbon-neutral district heating (111.1 kt CO2-eq) and through measures reducing emissions from road traffic (66.8 kt CO2-eq).
In 2025, emissions per capita will reach the emission level (1.6 t CO2-eq) that is in line with the 2°C target of the Paris Agreement. In 2029, emissions per capita will amount to 0.8 t CO2-eq, which is less than the emission level required by the 2°C target (0.9 t CO2-eq).
Figure 6. Normalised emissions in Turku in 1990, 2015 and 2020, calculated using the CO2 report method. The figure also includes the estimated development of emissions, carbon sinks and offsetting measures for years 2025, 2029 and 2035. The emission targets are presented on the left vertical axis, and the emissions per capita are presented on the right vertical axis.
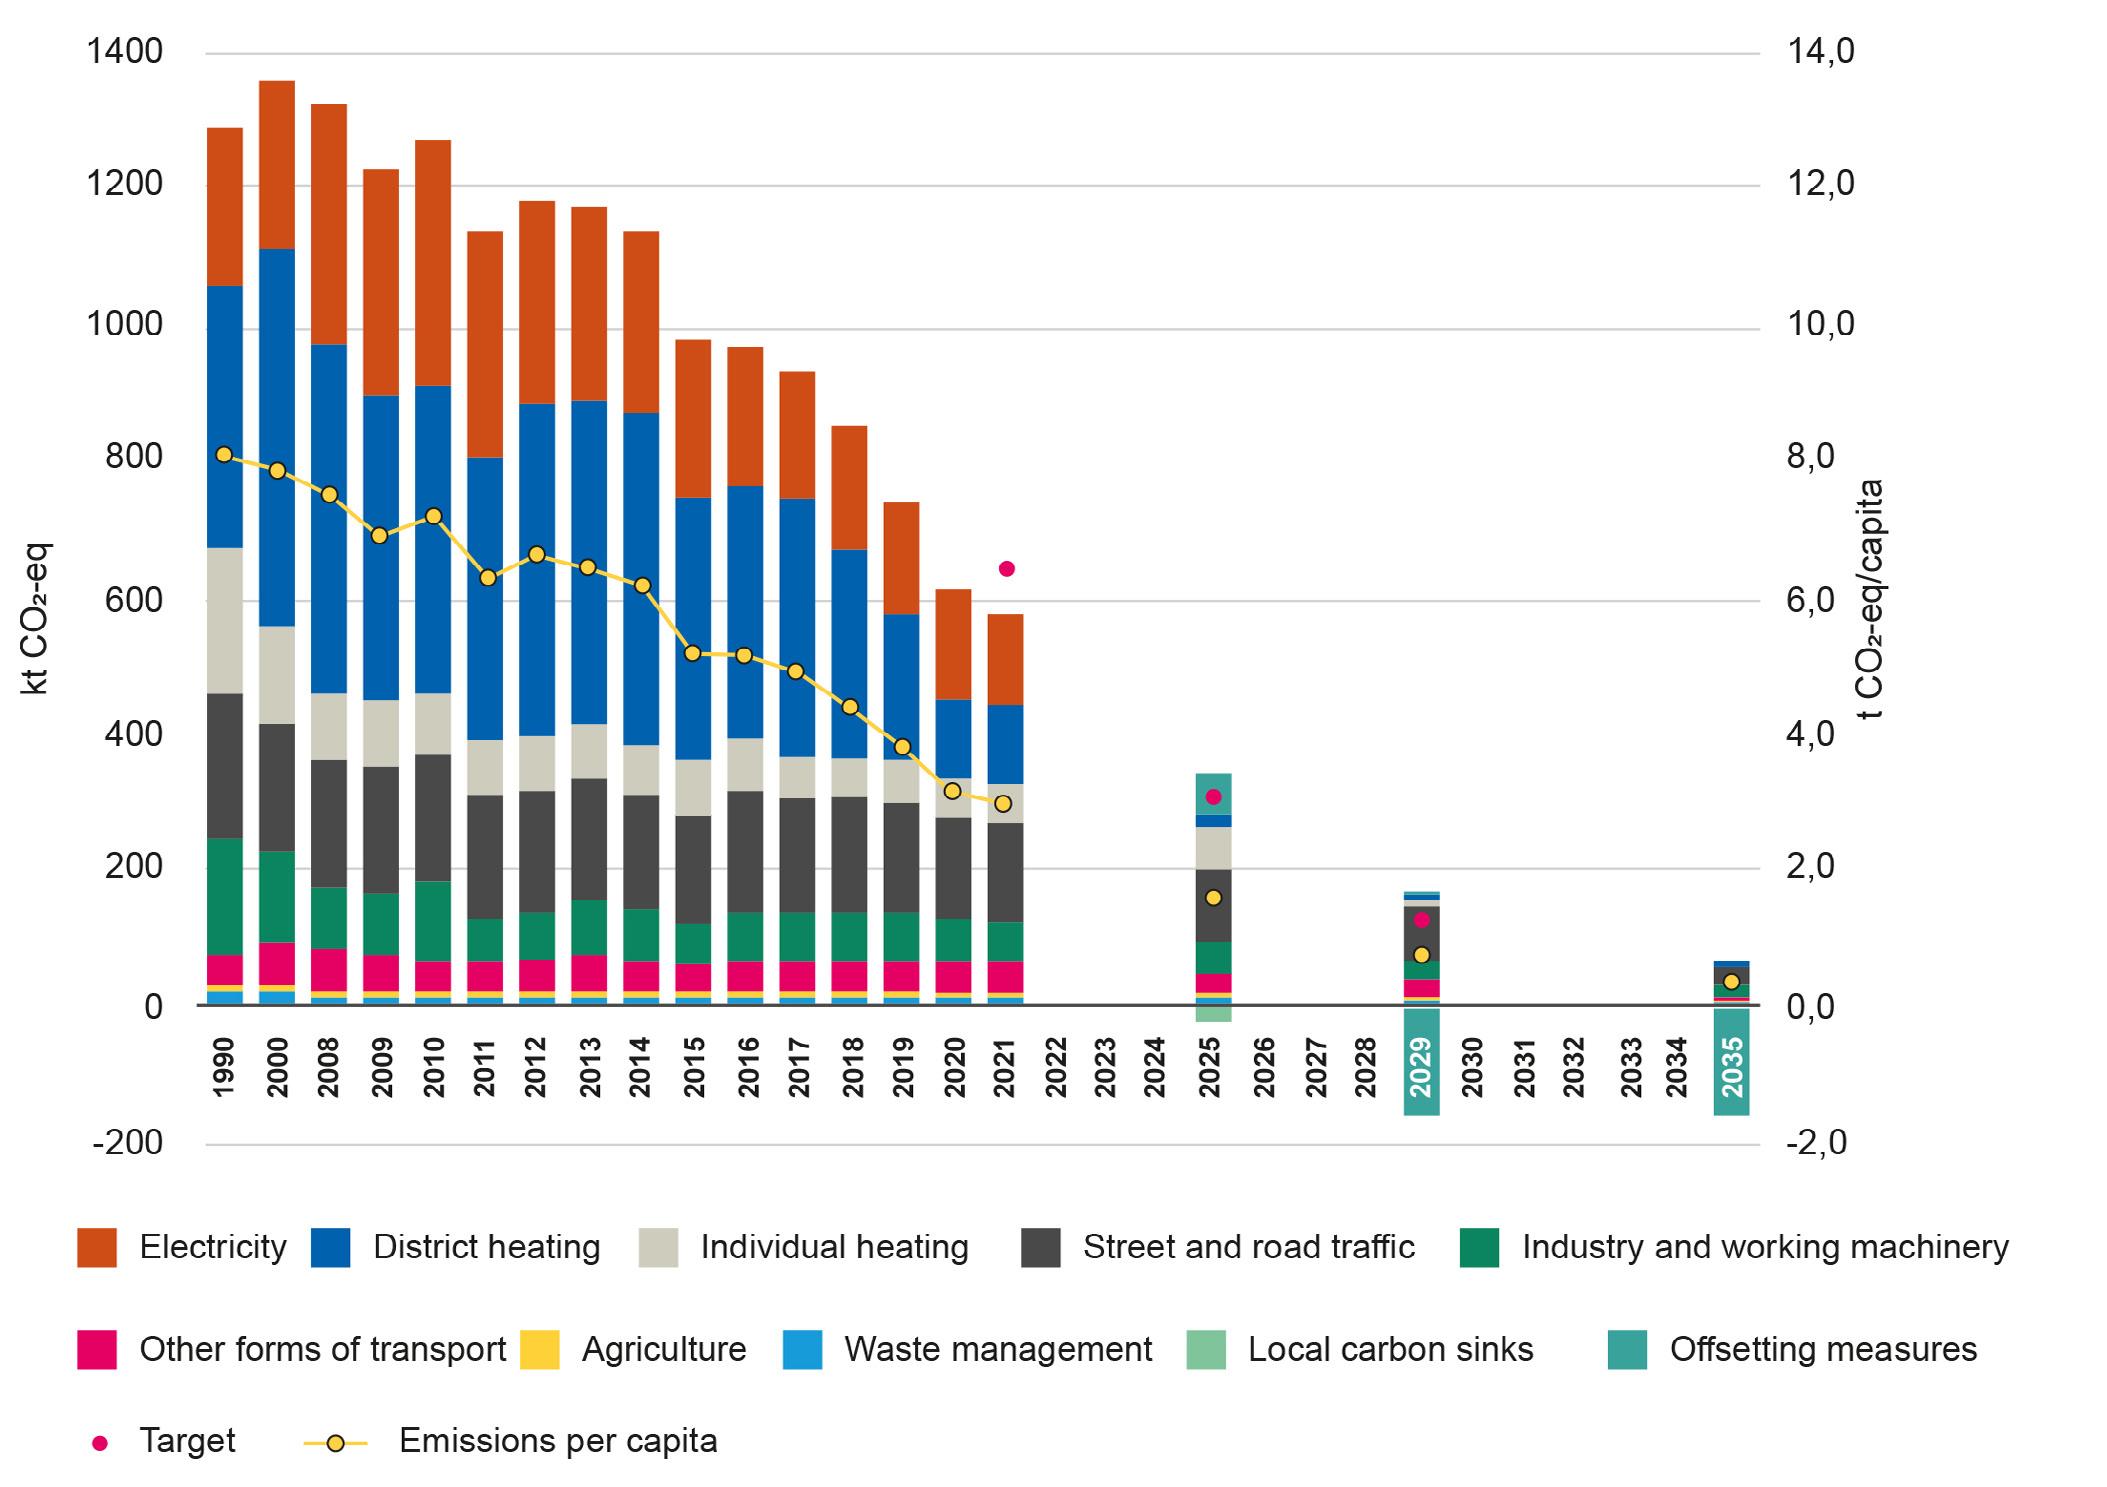
CITY OF TURKU 46
Results of scenario calculations, SECAP method
The normalised emissions in Turku in 1990 and 2015, calculated using the SECAP meth od, are presented in Figure 7. The figure also contains scenarios for years 2025, 2029 and 2035. An estimation of carbon sinks in the area and the use of offsetting measures in 2029 and 2035 have been presented as well. On the basis of the scenario analysis, the emission reduction target set for year 2025 will be achieved when greenhouse gas emissions drop by 79% from the level in 1990 by 2025. According to the scenario analysis, Turku will fall short of the emission reduction target set for 2029 by approximately 12.4 kt
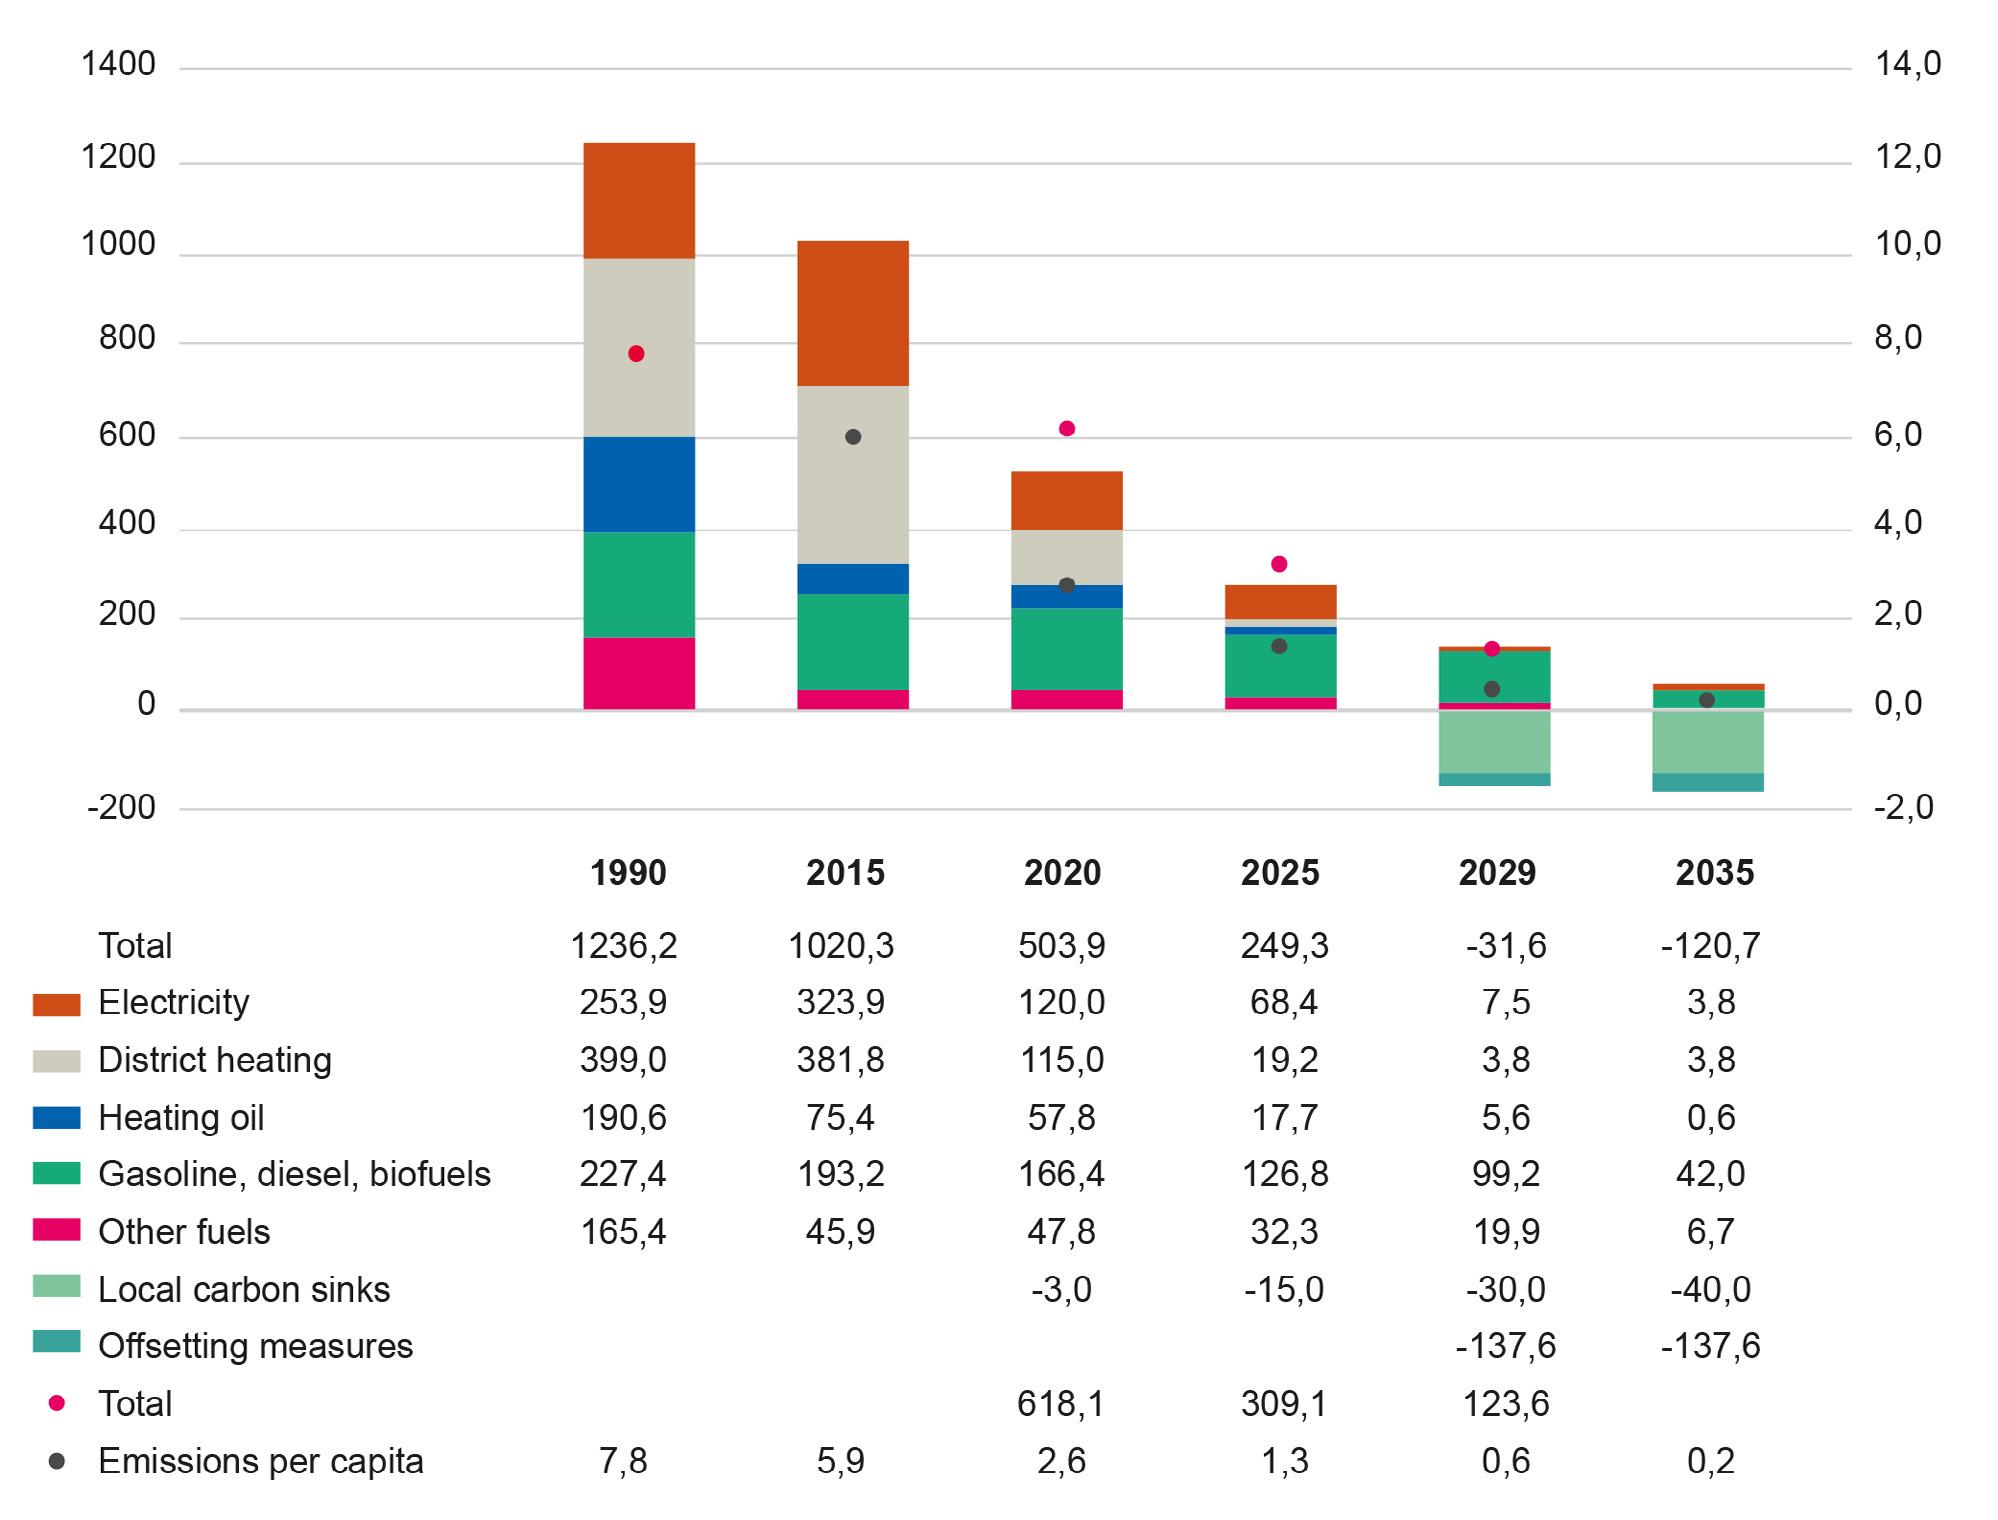
CO2-eq, which is around 1%. However, the objective of carbon neutrality by 2029 will be achieved when the local carbon sinks and other offsetting measures are taken into consideration, making the carbon balance of the city in 2029 negative (-31.6 kt CO2-eq). When examining greenhouse gas emissions calculated with the SECAP method, it must be taken into consideration that emissions from agriculture, waste management and other forms of transport (cf. Figure 6) have not been included in the calculation.
Emissions will continue to drop from 2029 to 2035, as the production of electricity will increasingly develop in a low-carbon direction
Figure 7. Normalised emissions in Turku in 1990, 2015 and 2020, calculated using the SECAP method. The figure also includes the estimated development of emissions, carbon sinks and offsetting measures for years 2025, 2029 and 2035. The emission targets are presented on the left vertical axis, and the emissions per capita are presented on the right vertical axis. The emission target for 2021 has been presented in connection with year 2020.
CITY OF TURKU 47
and emissions from road transport will con tinue to drop. However, approximately 60 kt CO2-eq of emissions will remain. To reach the climate positivity target, carbon sinks need to be maintained and strengthened, and other offsetting measures need to be developed.
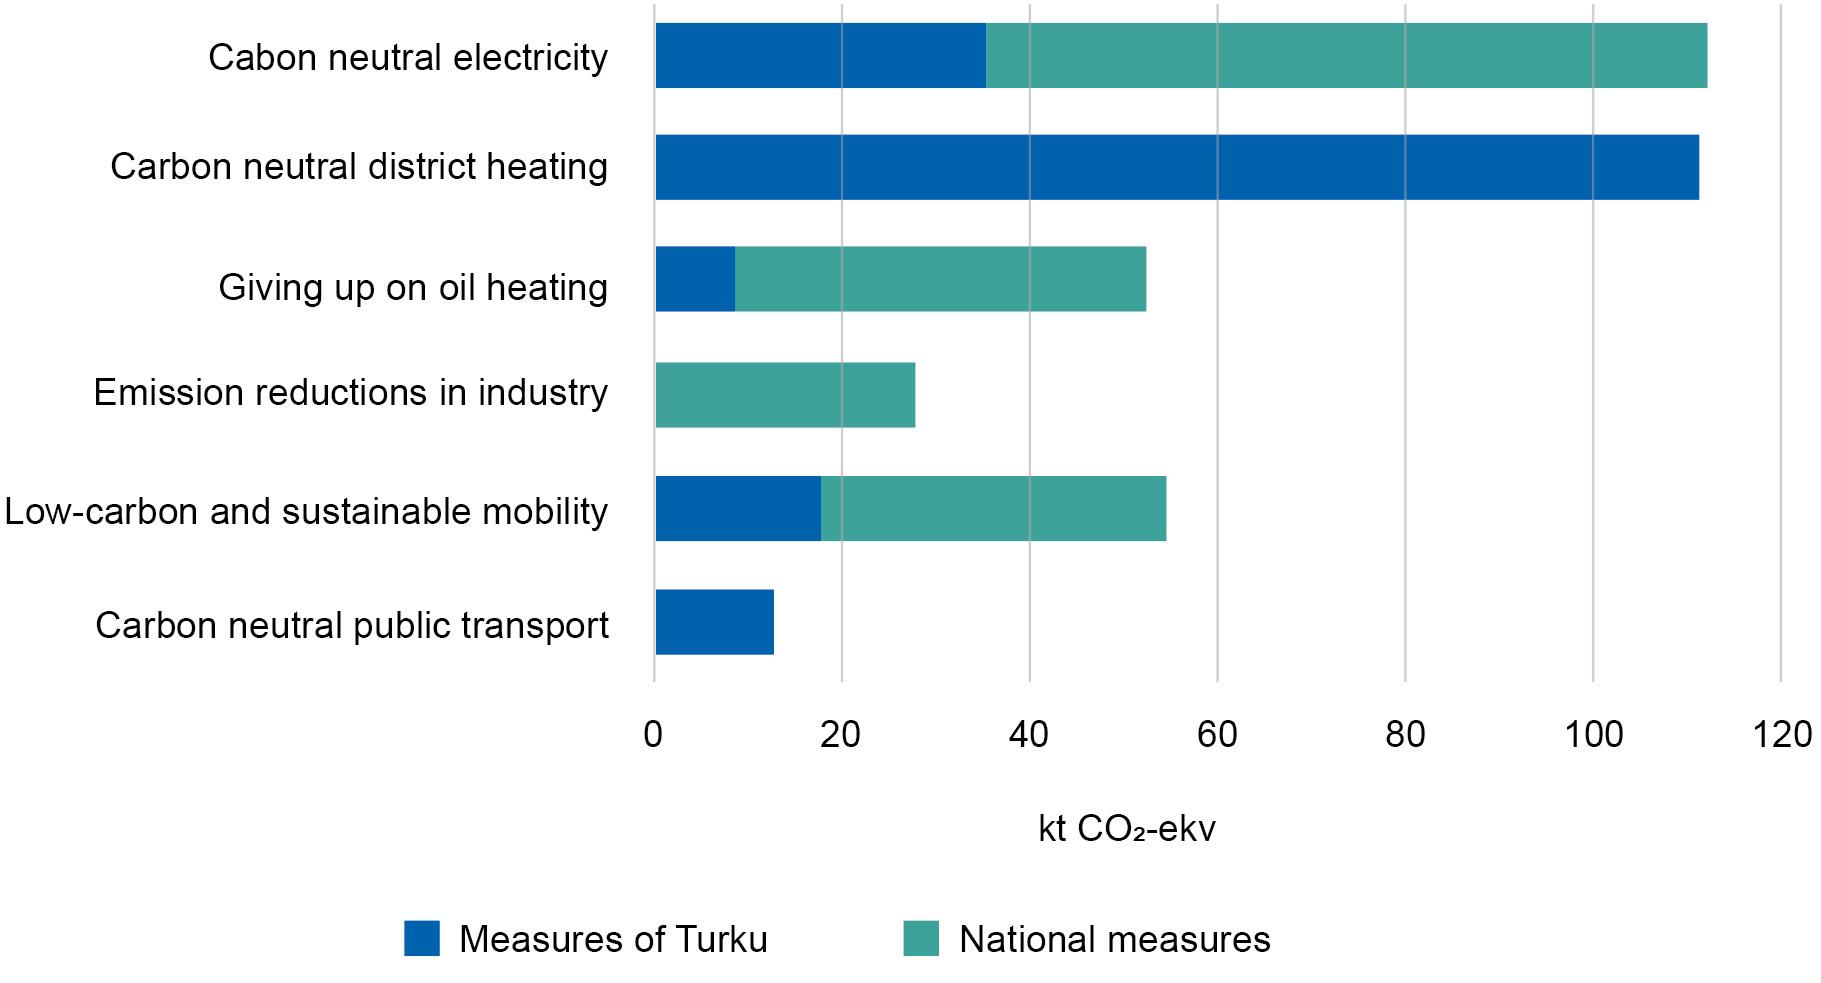
Emissions per capita will be halved from the level in 2020 (2.6 t CO2-eq) by 2025, and they will amount to 0.6 t CO2-eq in 2029 and to 0.2 t CO2-eq in 2035.
The greatest emission reductions between 2020 and 2029 will be achieved by transi tioning to carbon neutral electricity (112.5 kt CO2-eq), by using carbon neutral district heating (111.1 kt CO2-eq) and by reducing the consumption of fossil petrol and diesel (67.3 kt CO2-eq).
The effects of different measures and factors on the emission level in Turku in 2029 are presented in Figure 8 and Table 2. The
effects have been examined in the timeframe 2015–2029 by using the SECAP calculation method. The greatest emission reductions will be achieved by transitioning to carbon neutral electricity and district heating. The impact of national measures and the impact of Turku’s own measures are estimated to be equal.
Figure 8. The impact of Turku’s own measures and national measures on emissions in Turku in 2029 compared to the level in 2020, calculated using the SECAP method.
CITY OF TURKU 48
To reach the climate positivity target, carbon sinks need to be maintained and strengthened, and other offsetting measures need to be developed.
Table 2. The impact of Turku’s own measures and national measures on Turku’s emissions in 2029 compared to the level in 2020, calculated with the SECAP method. The national measures and Turku’s own measures are mutually reinforcing and it’s not possible to completely differentiate between the impacts of the two. The national measures sustain emission reductions in industry and Turku’s measures sustain the implementation of carbon neutral public transport.
kt CO2-eq
Measures of Turku National measures In total
Carbon-neutral electricity 34.9 77.5 112.5
Carbon-neutral district heating 111.1 111.1
Giving up oil heating 8.5 43.7 52.2
Emission reductions in industry 27.9 27.9 Low-carbon and sustainable mobility 17.9 36.8 54.7 Carbon neutral public transport 12.6 12.6 In total 185.0 185.9 370.9
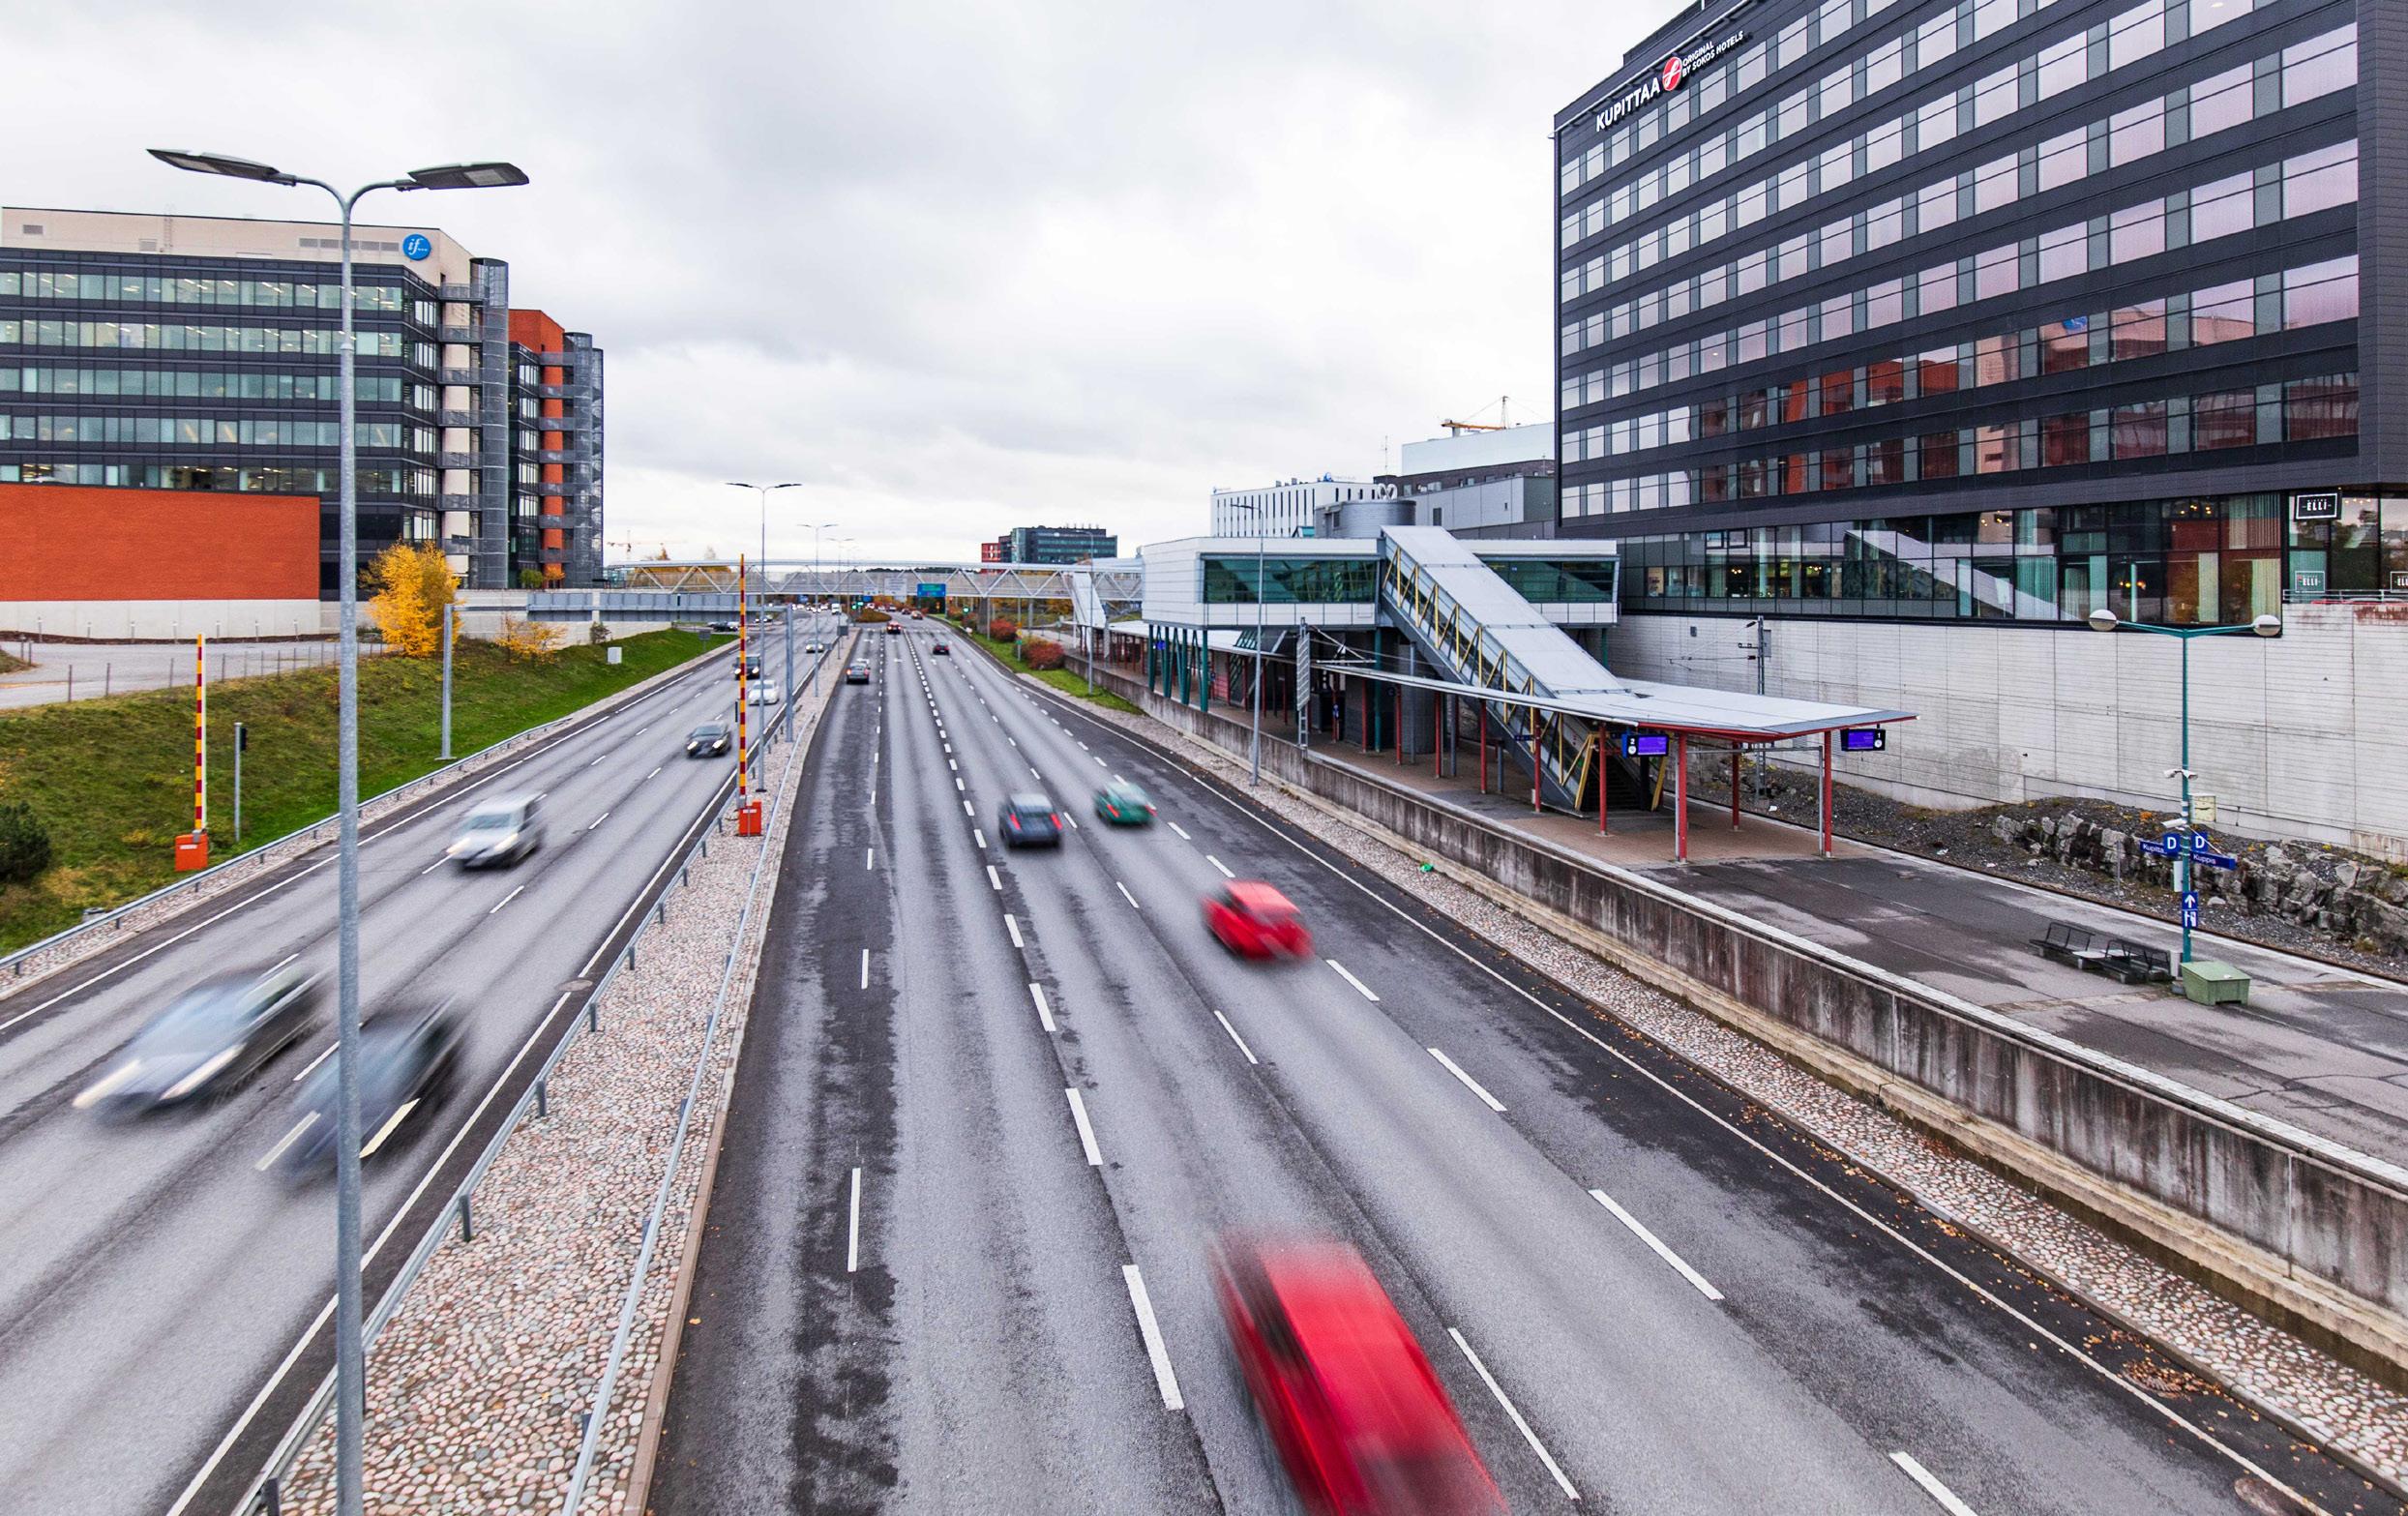
5. Analysis of risks and vulnerability
5.1 Changing of climate in Southwest Finland
The progression of climate change in Southwest Finland has been assessed in the report⁷ published by the Finnish Climate Change Panel in 2021. Typical features of the climate in Southwest Finland include long and relatively warm summers as well as short, mild winters. Due to the warming effect of the sea, autumn is often long and humid, while spring and early summer are dry and tepid due to the cold sea.
The impacts of climate change are visible in Finland, as the climate has already warmed. The period from 1991 to 2020 was approximately 0.6°C warmer than the period from 1981 to 2010. Depending on how greenhouse gas emissions evolve globally over the coming years, the average temperature around mid-century will be approximately 1.8 to 3.0°C higher than now. (NB: the greatest uncertainty is related to the development of greenhouse gas emissions). Similarly, the annual precipitation in the area is expected to rise by 6–10%. In other words, the average annual precipitation per year would be 530–610 mm in the outer archipelago and 630–820 mm in the inland.
One significant flood risk area is located in Southwest Finland. This is the coastal area of Turku, named as a flood risk area due to sea
⁷ Gregow, H. et al. 2021. Ilmastonmuutokseen sopeutumisen ohjauskeinot, kustannukset ja alueelliset ulottuvuu-det. Report of the Finnish Panel on Climate Change 2/2021.
CITY OF TURKU 50
The impacts of climate change are visible in Finland, as the climate has already warmed. The period from 1991 to 2020 was approximately 0.6°C warmer than the period from 1981 to 2010.
One significant flood risk area is located in the coastal area of Turku, due to sea flood. The flood risk area contains five objects that are difficult to evacuate as well as objects of food industry and pharmaceutical industry and objects with an environmental permit.
flood. The flood risk area contains five objects that are difficult to evacuate as well as objects of food industry and pharmaceutical industry and objects with an environmental permit. A very rare flood would also cause an interrup tion in the distribution of electricity and heat. Additionally, it would cause an interruption in telephone connections, data communications
as well as road transport connections, and would have a negative impact on the opera tions of the port of Turku. In the initial situa tion, 13 residents live in an area where a very rare flood occurs once in 250 years. Over 50 residents live in an area where a flood occurs once in 500–1000 years.
Variable Winter Spring Summer Autumn Year
Mean temperature ++ ++ + ++ ++
Precipitation + + / + +
Duration of thermal season + + + *
Highest temperature of the day ++ ++ + ++ ++
Lowest temperature of the day ++ ++ + ++ ++
Number of frost days Snow *
Number of precipitation days + () () +
Intensity of rainstorms + + + + +
Relative humidity + / / / +
Wind speed + + / / /
Ground frost * *
Table 3. Changes in weather and climate factors during different seasons in Southwest Finland by 2050 (same source of information). ++ Will increase considerably + Will increase / Not much change Will decrease considerably Will decrease () Change uncertain * Not possible to say or not significant
CITY OF TURKU 51
5.2 Method and concepts
As part of the climate plan, a comprehensive climate change risk and vulnerability assess ment was carried out in Turku for the first time in 2018. The risk assessment was completed using the model of the Covenant of Mayors. In the analysis, a general view was gained of climate risks posing a threat to Turku. Climate risks refer to potential direct and indirect harm to people, businesses and environment caused by climate, weather and their develop ment. In addition, the city's vulnerabilities i.e., areas in which the city is unable to respond or poorly prepared to respond to changes and extreme weather events caused by global
warming, were identified. Both socio-econom ic factors and physical and environmental factors were identified among vulnerabilities. Finally, those sectors were mapped out that are considered most exposed to changes caused by global warming.
The risk analysis has now (9/2021–3/2022) been updated on the basis of new national material, local reports and expert assess ments⁸. The key material utilised for the updating work has been presented in Table 4. Climate risks were assessed in terms of fac tors such as the following:
y Likelihood of occurrence (high, moderate, low)
y Level of risk and impact (high, moderate, low)
y Expected change in the intensity of the risk (increasing, no change, decreasing)
y Expected change in frequency (increasing, no change, decreasing)
y Timeframe (short-term, mid-term, long-term)
y Sectors affected by the risks
y Vulnerable groups of the population.
⁸ The consultations regarding risks, vulnerabilities, impacts and adaptation measures involved experts from the University of Turku, Turku University of Applied Sciences, the Centre for Economic Development, Transport and the Environment for Southwest Finland, the Regional Council of Southwest Finland, Valonia, the Natural Resources Institute Finland, the Finnish Environment Institute, the City of Turku and Sitowise Oy.
CITY OF TURKU 52
As part of the climate plan, a comprehensive climate change risk and vulnerability assessment was carried out in Turku for the first time in 2018. The risk analysis has now been updated on the basis of new national material, local reports and expert assessments.
Table 4. Local, regional and national reports on the basis of which the updated climate change risk and vulnerability assessment was carried out in Turku.
Year Title Scope
2021 Ilmastonmuutokseen sopeutumisen ohjauskeinot, kustannukset ja alueelliset ulottuvuudet National
2021 Varsinais-Suomen ilmastotiekartta 2030 Regional
2021 Ehdotus Turun rannikkoalueen tulvariskien hallintasuunnitelmaksi vuosille 2022-2027 Local
2021 Baltic Sea Cooperation for Climate Resilience – Flood and Drought Risk Management Local
2020 Kuinka kunnat kohtaavat ilmastonmuutoksen? Opas varautumistyön kehittämiseen National
2020 Turun Yleiskaava 2029 -ehdotuksen ilmastovaikutusten arviointi Local
2018 Ilmastokestävä Suomi - Toimintamalli sää- ja ilmastoriskien arviointien järjestämiseksi 2018 National
2018 Sää- ja ilmastoriskit Suomessa – Kansallinen arvio 2018 National
2018 Sään ja ilmastonmuutoksen aiheuttamat riskit Helsingissä 2018 Local
2018 Turun kaupungin kestävä ilmasto- ja energiatoimintasuunnitelma 2029:n riskiarvio tausta-aineistoineen Local
Key concepts
Climate risk
Climate risks refer to potential direct and indirect harm to human action, businesses and the environment, caused by climate, weather and their development. Factors affecting the emergence of a risk include the risk factor, exposure and vulnerability (Figure 9).
Risk factor
A phenomenon causing a risk. This could be, for instance, a storm, a heatwave or a rainstorm.
Exposure
The location of the object of risk. Exposure to the impacts of weather events and climate change can be assessed on the basis of encounter: whether an activity takes place, or an operator is located in a place where they can potentially experience harm or danger. From the point of view of exposure, the location of the object is key. An example might be a coastal location or living in a flood risk area.
Vulnerability
The qualities of the object of risk. Factors affecting vulnerability include, among others,
CITY OF TURKU 53
financial circumstances, the level of educa tion, the age structure of the population, and institutions and organisations whose ability to anticipate exposure and momentarily reduce vulnerability is crucial from the point of view of how wide-reaching the consequences are.
Adaptation
The ability of human systems and natural systems to function in the current climate, and their preparation for future changes in climate
and their ramifications. Through adaptation, we seek to prevent or mitigate the negative impacts of climate variation and change as well as to benefit from the positive impacts. Adaptation can mean reacting to situations or anticipating them.
Figure 9. According to the fifth assessment report of the UN Intergovernmental Panel on Climate Change IPCC, factors affecting the formation of risk caused by climate change include hazard, exposure and vulnerability.
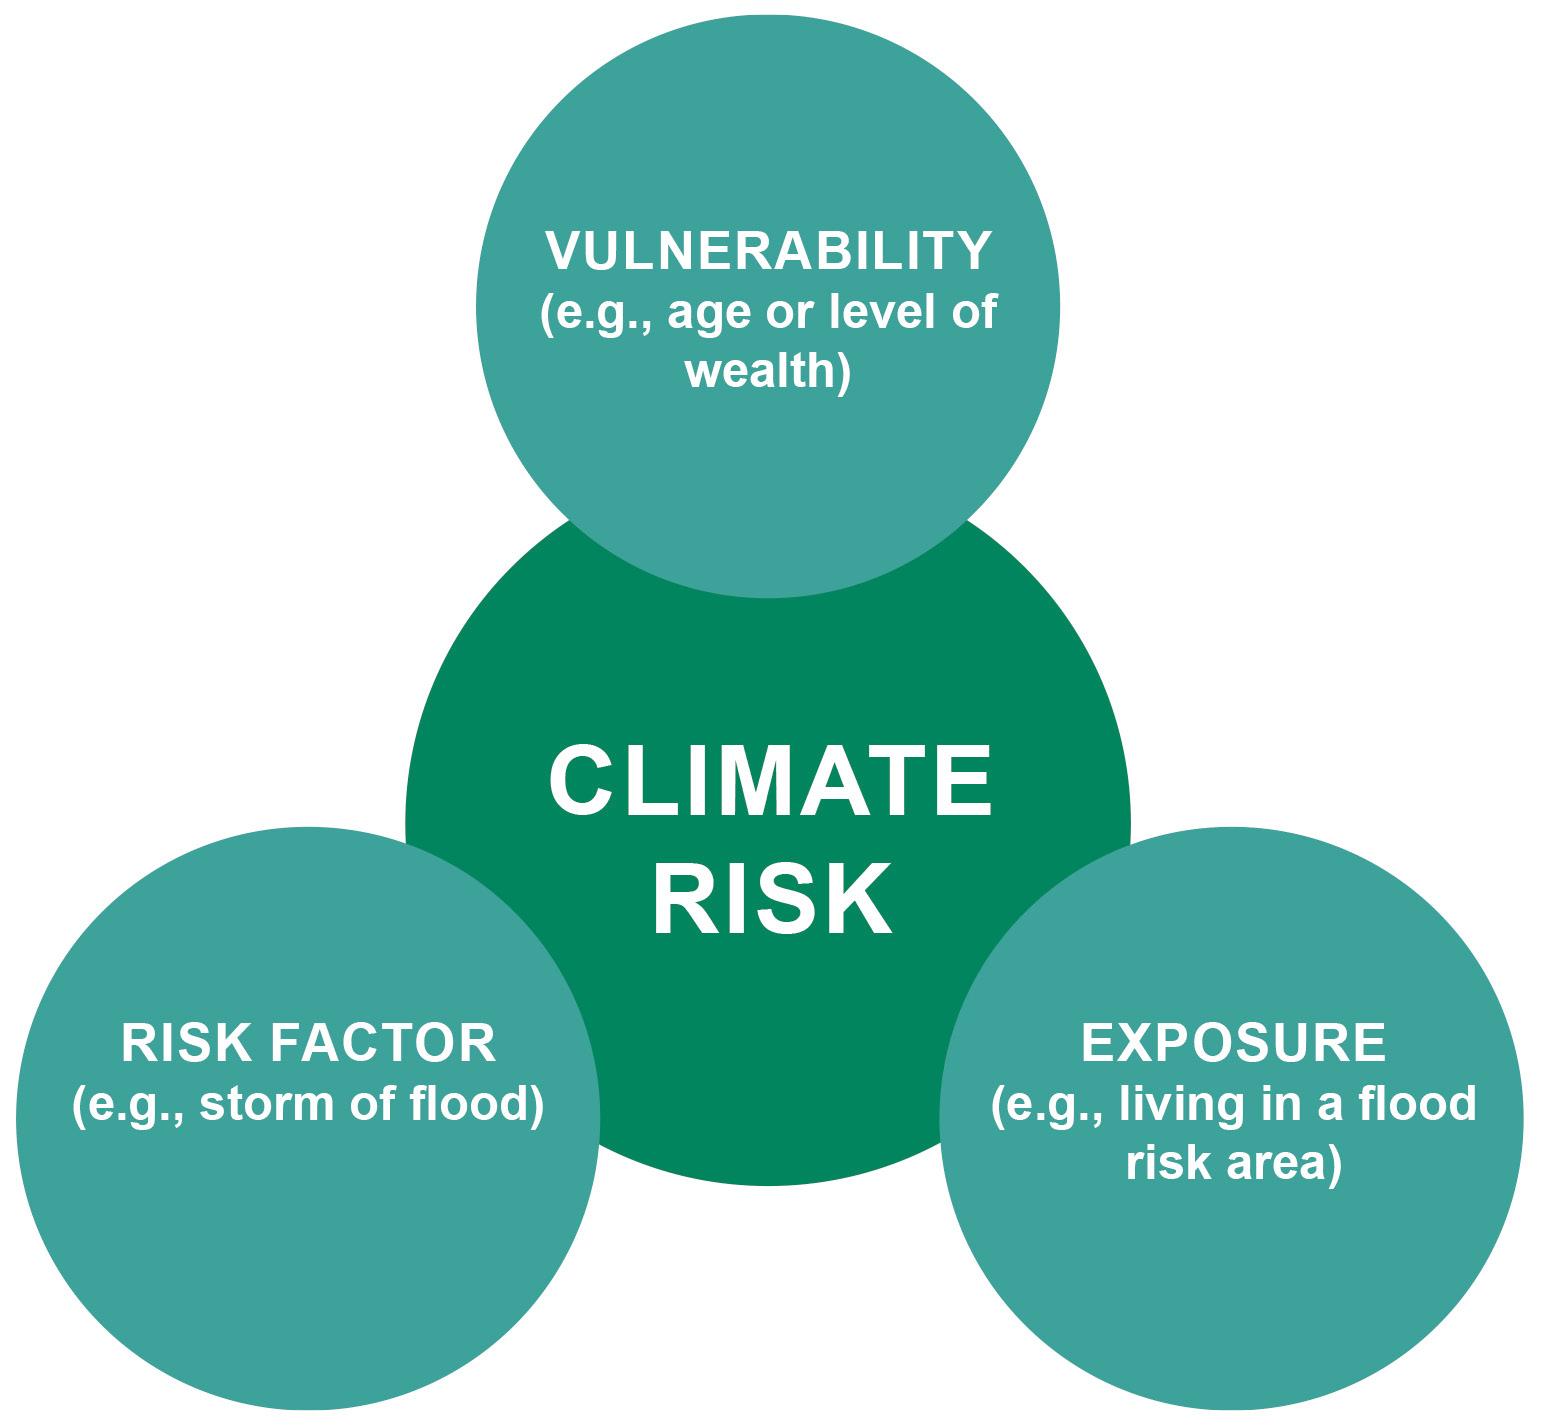
CITY OF TURKU 54
5.3 Results of the analysis
All the risks identified and assessed in the analysis have been presented in Table 5. More detailed descriptions of the climate risks that have been estimated as the most signif icant and their effects have been compiled in the risk cards in Annex 3. On the basis of the analysis, it is possible to identify three risk entities that are significant from the perspec tive of Turku and pose a threat Turku both now and in the near future: risks related to water and water management, risks caused by changes in ecosystems, and risks related to heat and drought (Figure 10). A number of other risks that were considered to pose a threat to Turku were also identified.
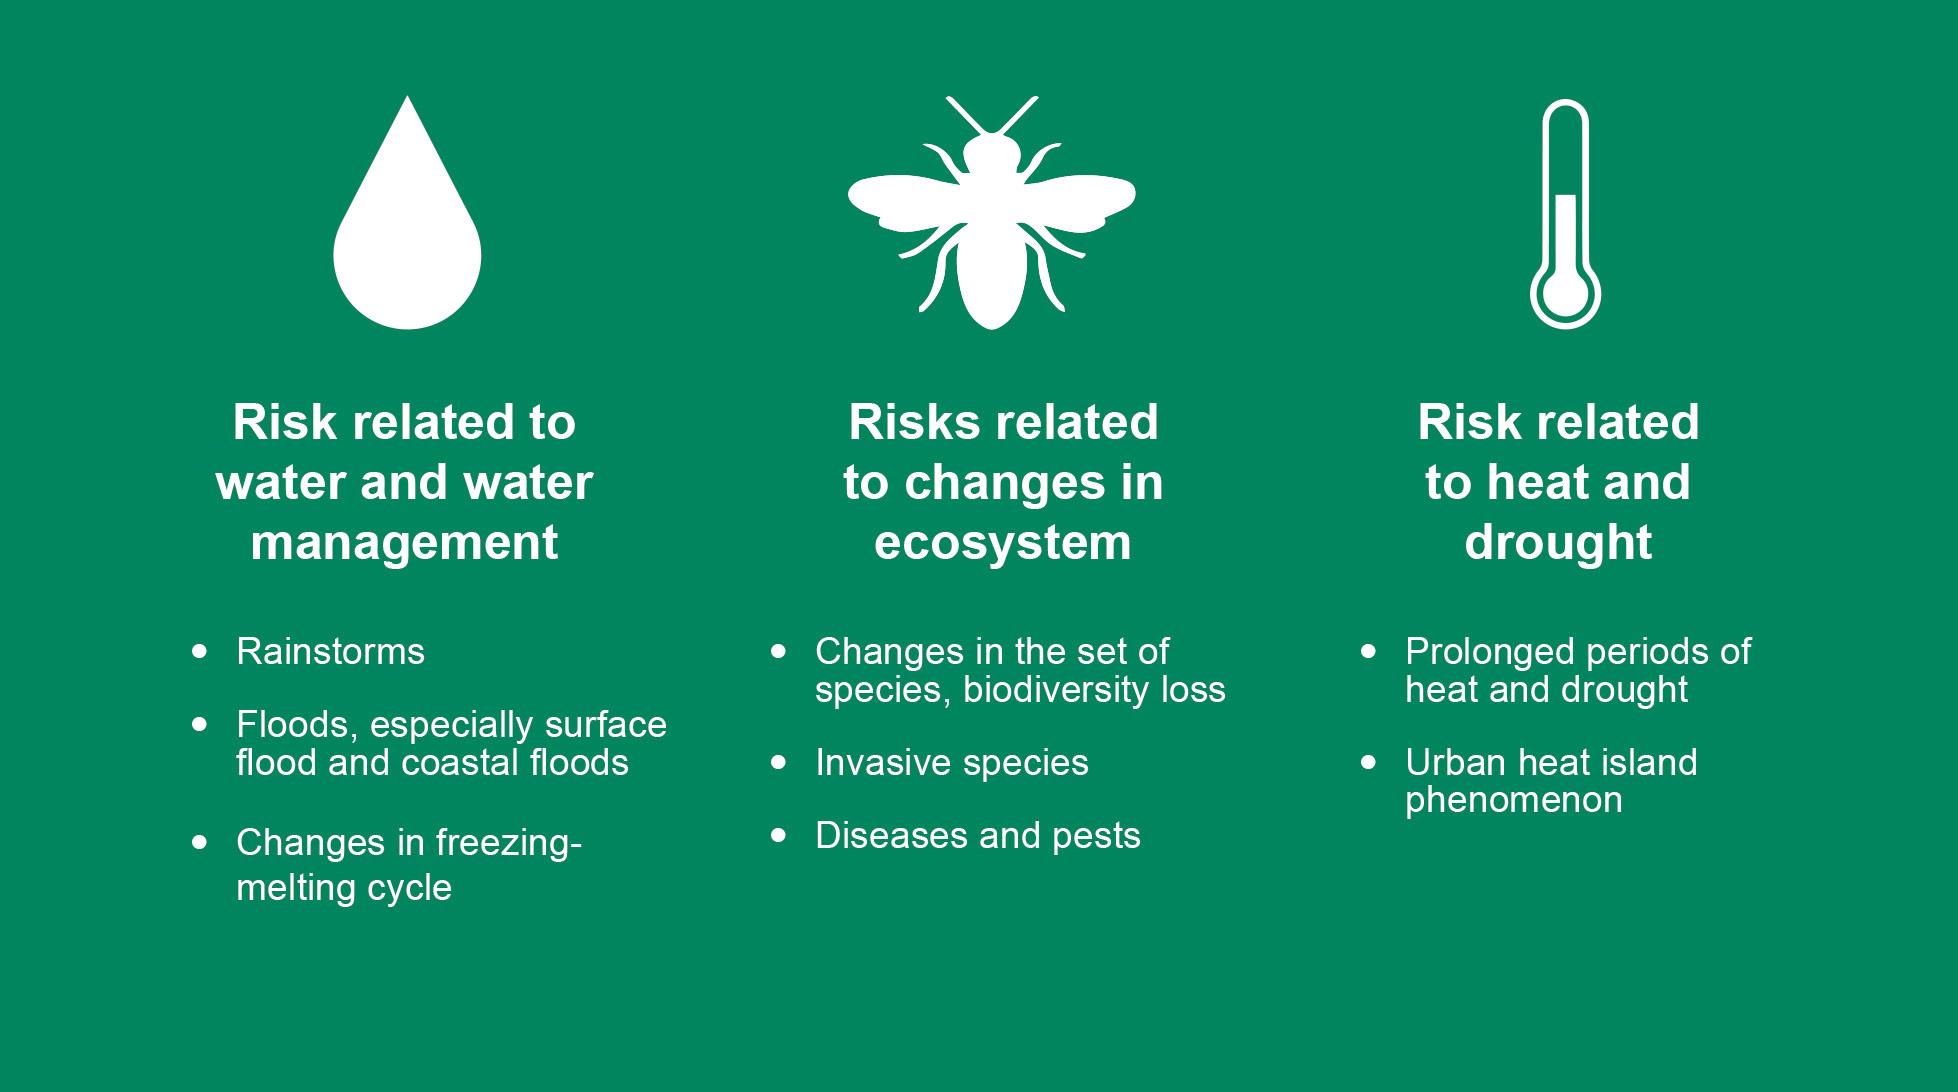
CITY OF TURKU 55
On the basis of the analysis, it is possible to identify three significant risks entities for Turku: risks related to water and water management, risks caused by changes in ecosystems, and risks related to heat and drought.
Figure 10. The three risk entities identified as the most significant climate risks for Turku.
CITY OF TURKU 56 Risk factor Likelihood of occurrence Expected impact level Expected change in intensity Expected change in frequency Timeframe Reliability of estimation Risk card Extreme heat !! !! ▲ ▲ ► * RK1 Extreme cold ! ! ? ? ► ► * Drought and scarcity of water !! !! ▲ ▲ ► ► * RK2 Wildfires !! !! ▲ ▲ ► * RK3 Freezing-melting cycle !!! !! ▲ ▲ ► *** RK4 Rainstorms !!! !! ▲ ▲ ► ► *** RK5 Rain !!! !! ▲ ▲ ► ► *** Snowfall !!! !!! ▲ ▼ ► *** Fog ! ! ▲ ▲ ► * Hail ! ! ▲ ▲ ► * Floods and the rising of sea level !!! !!! ▲ ▲ ► ** RK6 Runoff water floods !! !!! ▲ ▲ ► *** Sea water floods !!! !!! ▲ ▲ ► ► ► * River floods !! !! ▲ ▲ ► *** River erosion !!! !! ▲ ▲ ► *** Storms !!! !! ▲ ▲ ► * RK7 Hard wind !! !! ▲ ▲ ► * Thunderstorms !! !! ▲ ▲ ► * Changes in ecosystems !!! !!! ▲ ▲ ► *** RK8 Non-native species !!! !!! ▲ ▲ ► *** Biological risk factors !! !!! ▲ ▲ ► *** RK9 Waterborne diseases !! !!! ▲ ▲ ► *** Vector-borne diseases !! !!! ▲ ▲ ► *** Airborne diseases !! !!! ▲ ▲ ► *** Diseases spread by insects !! !!! ▲ ▲ ► *** Chemical changes ! ? ▲ ▲ ? * Landslides ! ! ▲ ▲ ► ► ► * Spillover effects !!! ? ▲ ▲ ► ** RK10 Table 5. Climate risks posing a threat to Turku as identified in the risk and vulnerability assessment, their estimated development and expert views on the reliability of estimation. ! low !! moderate !!! high ? not know ▲ increasing ▼ decreasing ? not known ► short-term (20-30 years) ►► medium-term (2050-) ►►► long-term (2100s) ? not known * low ** moderate *** high
In addition to local risks in Turku, such risks and threats caused by global change were identified that would affect Turku if they were to materialise. An example of such a threat is the increasing number of climate refugees, in other words people who are forced to migrate due to a change in local climate or an environmental disaster. It is relevant to note that if materialised, this threat might cause segregation in the city.
Regional collaboration and its successful functioning were considered very important in expert consultations from the point of view of climate change mitigation and adaptation.
Many environmental management functions have already been organised locally in the Turku region and in Southwest Finland, and continuous well-functioning collaboration is important also from their perspective.
Also in the analysis of risks and vulnerabilities, the experts stressed the significance of having an intact green network and securing biodi versity and ecosystems from the point of view of climate resilience. According to the sixth assessment report of IPCC, 30–50 per cent of land, fresh water and seas on the planet need to come under efficient protection or environ mental rehabilitation
secure the functionality
5.4 Further development of analysis work
The updated analysis is part of the work aimed at preparing for and adapting to climate change, and it consolidates the aspiration of Turku to be a responsible and leading climate city. This materialises through measures and plans, some of which have already been implemented. Adaptation measures are being planned and implemented by many city services, functions and partners. This is a continuing process.
Determining indicators for monitoring was identified as the next step, and national development work on this will be observed and made use of. Indicators make it possible to monitor the materialisation of risks and their effects as well as the development of vulnerabilities. They also enable us to develop climate work. A closer analysis of the identified vulnerabilities and reacting to them are important measures from the point of view of preparedness. Continuous planning and implementation of adaptation measures also form an important part of future work.
CITY OF TURKU 57
From the point of view of climate change mitigation and adaptation, successfully functioning regional collaboration was considered very important.
Also from the point of view of climate resilience, the significance of having an intact green network and securing biodiversity and ecosystems were stressed.
to
of ecosystems.
6. Assessment of the current state of adaptation and adaptation measures
6.1 Assessment of the current state of adaptation
The assessment of the current state of ad aptation was completed using an adaptation scoreboard in accordance with the SECAP re port model. The city’s situation was assessed using an A–D scaling system where:
A = Taking the lead (over 75% completed)
B = Forging ahead (50–75% completed)
C = Moving forward (25–50% completed)
D = Not started or getting started (less than 25% completed)
The self-assessment scoreboard was completed by City of Turku specialists with the
help of consultants from Sitowise Oy. The steps of adaptation work are presented in more detail in Annex 4.
The current state of the adaptation process was illustrated with a spider graph (Figure 11) used in the SECAP report model. The sectors that have already been developed further and discussed at length in the City of Turku ad aptation work have been marked with green colour. The sectors where further work is re quired are left outside the green area.
On the basis of the assessment, it can be said that the climate change risks and vulnerabilities in Turku have been fairly well assessed and the required measures have been fairly

Self-assessment 2022 Self-assessment 2018
STEP 1: Preparing the ground
STEP 6: Monitoring and evaluating
STEP 5: Implementing
STEP 2: Assessing risks and vulnerabilities
STEPS 3 and 4: Identifying adaptation options
Figure 11. Assessment of the current state of climate change adaptation in Turku.
CITY OF TURKU 58
well identified. In other areas, work has been initiated and/or fair progress has been made. Significant adaptation measures have already been planned and carried out to improve the operational reliability of critical infrastructure, for instance. However, consolidating the overall view of adaptation measures and coordination, and securing sufficient expertise and resources in city services remain extensive challenges. Key adaptation measures such as those related to water management and ecological risks should be reinforced. The next section (6.2.) presents the progress lines and measures of adaptation created on the basis of the adaptation scoreboard.
6.2 Adaptation measures
Turku will prepare for the identified climate risks and their effects, striving towards becom ing a more climate-proof city.
The adaptation entities can be divided into four areas⁹:
y Understanding risks
y Reinforcing risk management
y Investments to enhance resilience
y Developing disaster preparedness
Understanding risks by increasing data on climate
The impacts of climate change are manifold, and they partly involve significant uncertainty. These impacts can be sudden and unpredictable. Turku will utilise up-to-date data on the state of the world and environment, which are actively monitored.
y The monitoring of the state of the environment will be reinforced and sufficient resources will be allocated for this. ⁹ Cf. Priorities in line with the UN Sendai Framework for Disaster Risk Reduction 2015–2030 https://www.preventionweb.net/files/43291_sendaiframeworkfordrren.pdf.
CITY OF TURKU 59
Turku will utilise upto-date data on the state of the world and environment, which are actively monitored.
The climate change risks and vulnerabilities in Turku have been fairly well assessed and the required measures have been fairly well identified.
However, it is a challenge in the city services to consolidate the overall view of adaptation measures and coordination, and to secure sufficient expertise and resources.
y We will work closely with higher education institutions and educational institutions in the area and their know-how will be harnessed as a strength.
y Solutions will be sought in collaboration beyond municipal borders and sectors
y We will distribute information and actively deliver communication about climate risks and adaptation.
The development of risks, their components and their impacts will be monitored, and suitable indicators will be determined for monitoring.
Reinforcing risk management
The methodical management of climate risks on a national and regional level is important for ensuring efficient adaptation. Turku has a clear vision and plan, sufficient know-how, the ability to steer and coordinate adaptation measures within and between different services and functions, and the preparedness to involve relevant stakeholders in the planning and implementation of adaptation measures.
y Turku will prepare for the identified climate risks and their impacts, striving towards be coming a more climate-resilient city.
This materialises through measures and plans, some of which have already been im plemented. The risk cards in Annex 4 include the services, functions and key plans and policies where the most significant risks need to be taken into consideration.
Measures have been indicated for preventing and adapting to risks that have been identified as the most significant from the perspective of Turku (water and water management, chang es in the ecosystem and risks related to heat and drought).
Measures advancing water management
Climate resilience will be taken into account in the planning, implementation and maintenance of construction, the energy network, the traffic system and other infrastructure. Risks related to water management, such as rainstorms, floods (stormwater floods and sea water floods) and changes in the freezing-melting cycle will be controlled with measures such as the following:
y Stormwater management planning and implementation will be organised and resourced in a clear way, and the same goes for assigning responsibilities.
y Awareness and expertise related to sustainable stormwater management will be increased continuously.
y Stormwater will be utilised in building an attractive urban milieu.
y Reaching a good state in water bodies and groundwater will be supported by means of stormwater management.
CITY OF TURKU 60
Turku will prepare for the identified climate risks and their impacts, striving towards becoming a more climate-resilient city.
y The city will prepare for and prevent urban flooding.
y The green factor in built environment will be improved.
y Forest drainage will be reduced.
y Other nature-based solutions will be actively developed and taken into use.
y Sufficient resources will be allocated for preventing slipperiness and road dust.
Measures advancing the safeguarding of ecosystems
Securing biodiversity and ecosystems by means of protection and environmental reha bilitation is an essential part of climate resil ience. The objective of a nature city outlined in the city strategy and the action plan for pro tecting biodiversity strongly enhance this goal.
A varied set of species will be preserved in Turku and the decline of biodiversity will be stopped. Endangered species and natural habitats will be identified, and their preser vation will be secured. The living conditions of species will be improved, and the City of Turku will seek to advance biodiversity. Threats to biodiversity will be tackled.
The fragmentation of green areas will be stopped by adding to green networks and by increasing ecological corridors and urban green spaces. The most important ecological corridors will be preserved and taken into consideration in land use planning.
CITY OF TURKU 61
The
A diverse urban growing stock with several species reduces the risk of diseases and pest, reduces risks caused by climate change and improves the city scenery, creates a pleasant environment and increases economic activity.
Endangered species and natural habitats will be identified, and their preservation will be secured.
Fields and meadows that are natural habitats of the local species will be favoured over lawns in the urban environment. The fragmentation of green areas will be stopped by adding to green networks and by increasing ecological corridors and urban green spaces.
preservation of forest ecosystems will be se cured through measures outlined in the forest management plan.
The objective of the variety of tree species in Turku is that the urban growing stock is eco logically and climatically sustainable and di verse both genetically and in terms of species. A diverse urban growing stock with several species reduces the risk of diseases and pest, reduces risks caused by climate change and improves the city scenery, creates a pleasant environment and increases economic activity.
The prerequisites for pollinators will be sus tained by advancing beekeeping in the city and by preserving their preferred habitats. Fields and meadows that are natural hab itats of the local species will be favoured over lawns in the urban environment. Trees and bushes offering nourishment will be increased in parks and in yards where possible. Sufficient resources will be reserved for controlling non-native species.
Measures to prevent impacts of heat and drought
The City of Turku is aware that periods of heat are likely to become more common and more intense and has prepared for this. The impacts of heatwaves in the city are known and the areas and population groups that are particularly susceptible to heat and drought have been recognised. Well-planned preparedness helps prevent discomfort and damage to people and property caused by heat and drought.
y Turku recognises the need for increased air conditioning and cooling in buildings to be constructed and renovated. Turku will develop climate-resilient and energy-efficient solutions with its partners.
y Turku has recognised the importance of urban green spaces (such as green struc tures, green roofs, urban forest stands and street trees), and they will be used not only to maintain biodiversity but also to tackle the urban heat island phenomenon.
y The preparedness in water services will be developed together with partners to minimise and prevent harm caused by pro longed periods of drought.
y Turku will deliver communication on harm caused by heat and drought and the meas ures to prepare for them.
y The preparedness and ability in agriculture and forestry to cope with challenges caused by heat and drought will be developed in collaboration with partners.
CITY OF TURKU 62
The City of Turku is aware that periods of heat are likely to become more common and more intense and has prepared for this.
The impacts of heatwaves in the city are known and the areas and population groups that are particularly susceptible to heat and drought have been recognised.
Investments to improve resilience
The service reliability of critical infrastructure will be improved proactively and cost-efficient ly in collaboration with other operators in the area. Significant investments related to pre paredness will also be implemented through the Turku City Group’s subsidiaries. Examples of these include:
y improving the service reliability of the elec tricity network in case of storms, floods and periods of heat
y increasing self-sufficiency in energy
y improving the service reliability of systems in water services
y improving the service reliability of the wastewater network and wastewater treatment plant.
Through public procurement, the city will also seek to advance adaptation measures such as the development of local and sustainable food production.
In addition to public investments, private investments can also help advance adaptation and prevent the impacts of climate risks. With such measures, it is possible to develop the resilience of city residents, communities and the whole city.
y Turku will provide information and encouragement towards measures and investments targeted at adapting to climate change.
y Critical operators are encouraged to make their own risk assessments and preparedness plans and to make the needed investments in case of prolonged interruptions in electricity distribution in the main grid, for instance.
Developing disaster preparedness
Vulnerability will be reduced by raising aware ness and increasing a sense of community. Due to various social, financial and health-re lated reasons, some groups of the population, such as elderly people, are particularly vulner able to incidents caused by extreme weather events that make everyday life more difficult.
Anticipating disruptions such as power cuts caused by storms and preparing for them are important ways to cope. On the other hand, self-initiative, community spirit and neighbour ly assistance are particularly important during disruptions when the capacity of authorities becomes overloaded. This means that fos tering a sense of community is excellent preparedness for exceptional situations and also contributes to the attainment of other ob jectives outlined in the Climate Plan 2029.
y Impacts of climate risks will be identified in Turku and adaptation measures will be developed district by district in collaboration with community associations and residents. Efficient work towards adaptation not only increases resilience to cope with the impacts of climate change but also affects the quality of life of the population living in the urban environment and secures their livelihood and wellbeing. The ability to recover from disruptions and damage caused by extreme weather events is an important part of adaptation.
y Turku will learn from past experiences and will use them as a basis for developing adaptation and preparedness to recover from impacts of climate change.
Adapting to climate change is a collaborative effort
As in all other climate work, collaboration partners and networks also have a crucial
CITY OF TURKU 63
role in adapting to climate change. Significant partners in adaptation work include the Centre for Economic Development, Transport and the Environment; the Regional Council of Southwest Finland; other municipalities in the area and Valonia; operators of the wellbeing service county (operators responsible for regional health services, services for the el derly and services for people with disabilities); regional rescue services; research institutes; higher education institutions and educational institutions; and businesses.
y To adapt to the impacts of climate change, the City of Turku will advance the meas ures, policies and targets agreed beyond the municipal boundaries and in active col laboration with partners.
y Turku will reserve sufficient resources for regional collaboration and will invite other municipalities to join the adaptation work.
The role of communality in adaptation:
y Extreme weather events may cause extensive disruption regionally and there may not be enough capacity to fix it immediately. In exceptional and unpredictable situations, it is critical that people know well the environment they live in, the residents are prepared to take independent initiative and those in need of support are helped.
y This means that reinforcing communality is excellent preparedness for exceptional situations. Not only the significance of citizens but also the significance of associations for communality has been recognised in Turku.
Adaptation projects:
y Active participation in development projects ensures having the latest information available to utilise, reinforces pioneership
and adds to the attractiveness of Turku internationally.
To steer the above measures, the general view and coordination of adaptation meas ures will be reinforced as part of the steering of climate policy as well as the leading and operations of city services and the Turku City Group’s subsidiaries. Preparing for climate change and the adaptation measures widely affect city operations and have a significant impact on the wellbeing of citizens, particularly in situations where climate risks materialise. In addition to preparing for the negative impacts, we will look for systemic benefits resulting from the change.
CITY OF TURKU 64
Reinforcing the sense of community is excellent preparedness for exceptional situations. Not only the significance of citizens but also the significance of associations for the sense of community has been recognised in Turku.
7. Conclusion
A carbon-neutral Turku is a collective effort. Your contribution has an impact on how we succeed and what we can achieve!
Climate change poses a challenge and Turku responds. A climate-resilient 1.5-degree life and city are within our reach. Low-carbon circular economy is also in the process of ma terialising. The diverse and magnificent nature around us needs to be protected.
A reforming city is newly created every day. And yet the city of today was made yesterday, it’s a product of the past. Moreover, a city is never complete – the great innovations of today will soon only be memories of the past.
The best solutions are created together, and the story is told together. The story of this city will be passed on and our past actions will af fect the environment and starting point of the next generation.
A carbon-neutral Turku is a collective effort. The work will continue for a long time, but there is no time to waste.
Together we will beat the risks and effects of climate change – and other threats to our society.
Your contribution has an impact on how we succeed and what we can achieve.
Let’s get to work!
Turku is well on its way towards carbon neutrality in 2029 and a life that is in keeping with the Paris Agreement. The greatest reduction in emissions so far has been achieved by increasing renewable energy, but also improving energy efficiency has had an impact. Furthermore, emissions from mobility have been significantly reduced. In addition to Turku’s own measures, Government policies have contributed to the attainment of the targets.
CITY OF TURKU 65
2015 2016 2017 2018 2019 2020 2021 2022 2023 2024 2025 2026 2027 2028 2029 2030 2031 2032 2033 2034 2035 5,2 5,1 4,9 4,5 3,8 3,1 3,0 1,6 0,8
1,6
CO2 report method 0,0 1,0 2,0 3,0 4,0 5,0 6,0 7,0 8,0 9,0 1990 2000 2008 2009 2010 2011 2012 2013 2014 2015 2016 2017 2018 2019 2020 2021 2022 2023 2024 2025 2026 2027 2028 2029 2030 2031 2032 2033 2034 2035 t CO 2 eq/capita
0,3
1,6 1,6 1,6 1,6 1,6 1,6 1,6 1,6 1,6 1,6 1,6 1,6 1,6 1,6 1,6 1,6 1,6 1,6 1,6 1,6 0,9 0,9 0,9 0,9 0,9 0,9 0,9 0,9 0,9 0,9 0,9 0,9 0,9 0,9 0,9 0,9 0,9 0,9 0,9 0,9 0,9
Normalised greenhouse gas emission of Turku per capita, calculated using the CO2 report method emission level in line with the 2°C target emission level in line with the 1.5°C target
Annexes of the Climate Plan 2029
CITY OF TURKU 66
1. Description
the calculation method 2. SECAP
cards
3. Climate risk cards 4. Assessment
5. Concepts
of
climate action
(list)
of the current state of adaptation
of the climate plan
ANNEX 1. Description of the calculation method
L1.1 Calculation methods
Several different methods can be used to calculate greenhouse gas emissions of cities. Emissions in Turku have been monitored for several years using the CO2 report calculation method which is extensively used in Finland. The CO2 report emissions calculation method has also been selected as the instrument for strategic monitoring and for assessing local MAL work. The results of the CO2 report calculation method have been presented in section 2.2. The CO2 report calculation method and the wider results have been described in more detail in the annual CO2 report.
In addition to the CO2 report, Turku monitors the development of its greenhouse gas emissions using the SECAP method in line with the Covenant of Mayors. Emissions calculated using the SECAP method have been presented for years 1990, 2015 and 2020 (see section 2.2). The data has been reported to the EU. Going forward, the monitoring years 2025 and 2029 will also be reported.
The CO2 report calculation method is mainly compatible with the SECAP method. The most significant differences can be found in the presentation of data (division into sectors) and the emission factor for electricity consumption. For the SECAP calculation included in the climate plan, the emissions calculated using the CO2 report have been adjusted to be correspond to the SECAP method.
L1.2 Description of the SECAP method
The calculation covers the most important greenhouse gases caused by human actions: carbon dioxide (CO2), methane (CH4) and nitrous oxide(N2O). Greenhouse gas emissions have been converted to carbon dioxide equivalents (CO2-eq) by multiplying CH4-and N2O emissions by a coefficient that equates to their global warming potential (GWP). The GWP factor for CH4 used in the calculation is 21 and the GWP factor for N2O used in the calculation is 310. In accordance with the SECAP guidelines, these must remain the same throughout the monitoring period.
The calculation of emissions includes all energy-related emissions from city-owned buildings and city functions (including street lighting), service buildings and functions, residential buildings, transport, and industry not covered in the EU Emissions Trading Scheme. Emissions from transport have been divided into city-owned vehicles, public transport and private and commercial transport. Sectors included in the SECAP calculation are presented in Table L1.1. Unlike the CO2 report calculation, the SECAP calculation does not include emissions from rail and waterborne transport, aviation, agriculture or waste management.
CITY OF TURKU 67
of the Climate Plan
Annexes
Sector Definition Source of information (energy)
BUILDINGS, FUNCTIONS AND INDUSTRY
City buildings and functions Buildings owned and managed by the City of Turku (does not include residential buildings), street lighting and fuels used by the city’s working machinery.
Service buildings and functions Other than city-owned buildings for business, offices, transport, gathering, health and social care industry, teaching and storage and other buildings.
Residential buildings Residential buildings, including those owned and managed by the City of Turku.
Industry (non-ETS) Industry not covered in the EU Emissions Trading Scheme (in other words, all industry in the Turku area). Energy consumption of industry buildings and industrial use of fuel.
TRANSPORT
City of Turku
CO2 report
CO2 report
CO2 report
City vehicles The City of Turku’s own vehicles City of Turku
Public transport Buses of public transport (Föli transport within the city) City of Turku
Private and com mercial transport Road transport taking place within the City of Turku, apart from the city’s own vehicles and buses of public transport
The Liisa model of the VTT Technical Research Centre of Finland
Energy used in buildings has been divided into electricity, district heating and fuels used in heating. District cooling is also used in some buildings in Turku. However, district cooling has not been presented separately in the calculation, as in Turku it is produced either in connection with combined production of heat and electricity, or emission-free by using waste heat or by electricity. In other words, the energy consumption of the production of district cooling and potential emissions are already included in emissions from district heating or electricity consumption. Energy consumption of industry not covered in the EU Emissions Trading Scheme has been divided into heating energy consumed by industrial buildings, electricity, fuels used by industry, and fuels used by working machinery. Transport fuels cover gasoline, diesel and bio components included in fuels.
CITY OF TURKU 68
Annexes of the Climate Plan
L1.3 Emission factors of the SECAP system
The SECAP emissions calculation is based on a so-called consumption-based calculation meth od, the starting point of which is energy consumption in the Turku area. Emission factors for energy consumption (emission per consumed energy unit) are defined as follows:
y Fuels: emissions caused by fuel consumption per consumed fuel unit.
y District heating: emissions caused by the production of district heating supplied in the Turku area by Turku Energia in relation to the district heating supplied. The emissions from com bined heat and power (CHP) production have been allocated to heat and power using a “ben efit sharing” method. In this method, the amount of fuel used is apportioned to electricity and heat in proportion to the alternative methods of energy production.
y Electricity: an emission factor for electricity consumption in keeping with the SECAP guide lines where the local production has been taken into consideration.
In accordance with the SECAP calculation guidelines, the emission factor for electricity used in Turku is calculated taking into consideration the electricity production of Turku Energia and other operators owned by the City of Turku, and certified green electricity used in city buildings. The emission factor for electricity changes annually and it is calculated using the following formula:
EFE = local emission factor for electricity
TCE = total consumption of electricity in Turku
∑LPE = electricity production of Turku Energia and other city-owned operators
∑GE = certified green electricity used in city's own functions
NEEFE = national emission factor for electricity for the year of calculation
∑CO2LPE = emissions caused by electricity production of Turku Energia and other city-owned actors
∑CO2GE = emissions resulting from production of green energy (calculated as zero emissions)
CITY OF TURKU 69
the Climate Plan
Annexes of
Emission factors used in the SECAP calculation have been presented in Table L1.2. The table also includes emission factors used in SECAP calculation in 1990 and 2015.
L1.2. Emission factors for years 1990, 2015 and 2020 used in the SECAP calculation (t CO2-eq/ MWh).
When comparing the SECAP calculation method to the CO2 report method, the emission factors used in the calculations differ from each other. A national emission factor for electricity is used in the CO2 report calculation.
L1.4 Correction with heating degree days
The annual need for heating has a considerable impact on the development of emissions. When the fluctuation in heating needs is removed, the impacts of implemented measures can be clearly monitored and verified. Primarily, the emissions calculation used in Turku Climate Plan is heating degree day corrected. However, emissions are also monitored without heating degree day correction. Also the annual CO2 report calculation is completed both using a method that takes into account the fluctuation in the need for heating and a method without heating degree day correction. In the calculation, the need for heating energy in buildings is corrected so that it equates to the climatological normal period (1981–2010).
L1.5 Energy balances
Energy balances in line with the SECAP calculation method (MWh) in 2020 are presented in Tables L1.4 and L1.5 which adhere to the requirements of reporting to the EU. Energy balances have been presented both as heating degree day corrected, so that they equate to the climatological normal period (1981–2010), and without heating degree day correction. A summary of energy consumption in 2020 can be found in Table L1.3. The energy balances for years 1990 and 2015 are also presented in the table.
Table L1.3. Energy balances in 1990, 2015 and 2020.
CITY OF TURKU 70
Annexes of the Climate Plan
Year Electricity District heating Fossil fuels Renewable energy - Local LPG Heating oil Diesel Petrol Carbon Other fossil fuels Biogas Biofuel Other biomasses 2020 0.078 0.064 0.234 0.267 0.267 0.277 0.342 0.271 0.001 0.002 0.010 2015 0.210 0.212 0.234 0.266 0.252 0.289 0.342 0.275 0.002 0.009 1990 0.234 0.312 0.234 0.269 0.252 0.289 0.342 0.285 0.009 Energy consumption (MWh) 1990 2015 2020 Heating degree day corrected 4575952 4785307 4610480 Without heating degree day correction 4368649 4420519 4191814
L1.4. The heating degree day corrected energy balance of Turku in 2020, calculated using the SECAP method
L1.5. The energy balance of Turku in 2020 without heating degree day correction, calculated using the SECAP method.


CITY OF TURKU 71
Annexes of the Climate Plan
ANNEX 2. SECAP climate action cards
The SECAP card models have been made to serve both the city organisa tion and the Turku City Group’s subsidiaries as well as other operators. The objective is to de scribe the climate change mitigation measures of the City of Turku and the Turku City Group in a clear and concise manner and to activate citizens, communities, businesses and universities –the entire civil society – to join along in creating climate actions and implementing a carbon-neu tral Turku.
Chapter 1 of the climate plan describes in more detail how the cards will be annually linked to the implementation and steering of the plan. Chapter 3 describes the thematic entity formed by the mitigation measures. Below is a table of SECAP cards. The cards are updated, and new ones are constantly being created as part of implementing the climate plan. The key informa tion about the cards will be found online on the Carbon neutral Turku website and some will be subject to further communications: (https://www.turku.fi/hiilineutraali-turku/yrityksille/ yritysten-ja-yhteisojen-ilmastotekoja).
The SECAP card is a concise, user-friendly and guiding-giving means for creating climate ac tions and making them a part of the collective implementation of a carbon-neutral Turku.
List of SECAP climate action cards (28 February 2022):
City of Turku, Tekes – the Finnish Funding Agency for Technology and Innovation, VTT Technical Research Centre of Finland Ltd, Sitra, Energiateollisuus ry, Skanssi shopping centre, YH kodit, Hartela
CITY OF TURKU 72
the
Annexes of
Climate Plan
Number Title of measure
Other
partners 1 Carbon-neutral heat Turku Energia Turku Energia with its affiliated
and partners 2 Smart two-way district heating network Turku Energia
3 Increasing the bio share of Naantali multifuel power plant Turku
4 Increasing solutions for energy storage (district heating & cooling) Turku Energia 5 Reducing network losses of the district heating network Turku Energia 6 Citizens’ energy Turku Energia
7 Carbon-neutral electricity Turku Energia
with its
and partners
Main executing body
executing bodies and
companies
Energia Turun Seudun Energiantuotanto Oy, Fortum
City of Turku, Sitra, Turku Energia, the Turku City Group’s subsidiaries responsible for premises and housing, University of Turku
Turku Energia
affiliated companies
CITY OF TURKU 73
Number Title
8 Building
9 Energy
10 Demand
11 Replacing fossil fuels
transport with
Traffic
12 Carbon-neutral
13 Electric
14 Public
15 Public
16 Improving
for
17 Piloting
18 Implementing charging
19 Promoting
20 Quality
21 City
22 Utilising
23 Carbon
Annexes of the Climate Plan
of measure Main executing body Other executing bodies and partners
solar systems on the Turku City Group’s properties Turku Energia City of Turku, the Turku City Group’s subsidiaries
efficiency Turku Energia Turku Energia, partners and experts
response in city properties City of Turku Turku Energia, City of Turku and Turku City Group’s subsidiaries
in public
biofuels Föli
contractors and suppliers
public transport system of large capacity City of Turku Other participating municipalities, the Government, Föli, builders and suppliers
bus transport Föli Participants' associations, Turun kaupunkiliikenne Oy, traffic contractors and technology developers
transport trunk routes Föli City of Turku and other participants' associations, traffic contractors and suppliers
transport passenger information and disruption management Föli City of Turku and participants' associations, traffic contractors and suppliers
the charging point network
electric cars Turun kaupunki Turku Energia, charging point operators, property owners and users
and development of a two way charging point (V2G) Turku Energia City of Turku and charging operators
points within city properties Turku Energia City of Turku, other operators in the Turku region
transport use of biogas City of Turku Turku University of Applied Sciences, the Growth Corridor project partners and other collaboration partners
cycling corridors and main network City of Turku TKS Kunnat
bike system City of Turku Föli, ECCENTRIC project (until 8/2020 max.), executors and supplier
large-volume masses in the city CIRCVOL 6-aika project CIRCVOL 6-aika project, TScP, Kiertomaa,12 executors in total
sinks in forests City of Turku other forest owners, residents
of measure
Main executing body
Other executing bodies and partners 24 City carbon sinks City of Turku Maintainers, landowners, constructors 25 Fully electric and carbon-neutral transport equipment for transporting wheelchairs and goods
Autokori ja -verhoilu J. Lehtinen Oy 26
Futureko Oy
Solar panels of TSYK Upper Secondary School
The City of Turku Education Division - TSYK Upper Secondary School
TSYK:n Kannatusyhdistys, Turku Energia, Turku University of Applied Sciences, Solar LAB 27
TVT Asunnot Oy: Lämpökuuri campaign
TVT Asunnot Oy Nitro, the target group (residents) also have an important role 28
TVT Asunnot Oy: Vesikuuri campaign
TVT Asunnot Oy Advertising agencies SST and Nitro and the target group, in other words residents 29
The Student Village Foundation of Turku, housing location Aitiopaikka: solar electricity
Turku Energia, FinnWind, YIT
The Student Village Foundation of Turku 30
The Student Village Foundation of Turku, housing location Tyyssija: recovering heat from wastewater
The Student Village Foundation of Turku
Turku Energia, potentially Turku University of Applied Sciences, constructors will be selected later. 31
The Lean Heat system of VASO Varsinais-Suomen Asumisoikeus Oy
Property managers, interaction with residents, Lean Heat service producer 32
VASO: Passive-energy house Soininen Hartela Oy as contractor
Arkkitehtitoimisto Kimmo Lylykangas as architect, City of Naantali, TEKES, ARA and RAKLI. 33
VASO: transitioning to renewable energy in renovation projects
HVAC designers and contractors implementing forms of energy (to be selected through competitive tendering) 34
Carbon neutrality of the City of Turku food services Turku City Group, strategic procurement
The Finnish Environment Institute, Arkea Oy 35
Steam production plant in Artukainen
Turku Energia
Bayer Oy, Nestlé Finland Oy, Oy Lunden Ab Jalostaja, PCAS Finland Oy and Eckes-Granini Finland Oy 36
Flue gas condenser of Naantali multifuel power plant
Turun Seudun Energiantuotanto Oy -
CITY OF TURKU 74
Annexes of the Climate Plan Number Title
The solar thermal solution of the Market Square and the underground parking facility Toriparkki Oy City of Turku, Turku Energia and nollaE
sustainable choices in planning congresses The Congress Services of the City of Turku
Reducing emissions from ship traffic Meriaura Group -
Lämpöä project Turku University of Applied Sciences Ltd -
44
University of Turku to become carbon-neutral by 2025 University of Turku Suomen yliopistokiinteistöt Oy, Turku Technology Properties
for recycling furniture The Employment Services Centre and the Project Development Unit
emissions from mobility The Forum Marinum Foundation -
energy Vuokrakartio Oy -
CITY OF TURKU 75
37
38
39 More
40
Annexes of the Climate Plan Number Title of measure Main executing body Other executing bodies and partners 41
The 42
biggest solar power station of Turku Energia contributes to the building work of Meyer Turku cruise ships
Turku Energia Finnwind Oy, Meyer Turku Oy
Collaboration partners of the City of Turku Congress Services: meeting and banquet facilities, hotels and producers of additional programmes in the Turku area
Sixth-wave
smart and resourcescarce business operation Bastu / The University of Turku's Bastu business accelerator service
43 Valonia
45
46
47
48 Reducing
49 Saving
50 Heat
Quadruple Helix- network consisting of over two hundred operators that represent business, the public sector, research and expert organisations and civil society 51
energy guidance Valonia -
The
Reports on mobility on the way to work and school – a means to find effective measures for reducing emissions. Valonia -
System
The Education Division The Welfare Services Division
Increasing the participation of elderly people in planning public transport Valonia Turku University of Applied Sciences, Föli
pump facility in Kakola Turun Seudun Energiantuotanto Oy Turku Energia, Turun Seudun Vedenpuhdistamo
Solar power station in Kupittaa Turku Energia Turku Technology Properties
Number Title of measure
Main executing body
Other executing bodies and partners 52
Pellet plant in Luolavuori Turku Energia53 Hobby taxi experiment, piloting a model that is being created to merge the rides to hobbies in families with children
Valonia Kyyti Group Oy 54
Bringing together regional climate work and advancing targets through roadmap work, for instance
Valonia
The Regional Council of Southwest Finland, the Centre for Economic Development, Transport and the Environment, the Finnish Environment Institute 55
Disseminating operating models of environmental education to schools and day-care centres. These can be, for instance, about the life cycle of food in early childhood education or about exploring bodies of water close to schools.
Valonia
Sateenkaari Koto ry, the City of Turku Education Division, Koulujemme lähivedet network, the Centre for Economic Development, Transport and the Environment for Southwest Finland 56 Climate networks
City of Turku and Turku City Group
ICLEI, UBC, CDP, Sitra, CLC, universities and development organisations 57 Work for the environment
Turun Ekotori Reuse Centre / Kestävän Kehityksen Yhdistys ry
Lounais-Suomen Jätehuolto Oy, Pääkaupunkiseudun Kierrätyskeskus Oy, Niemi Palvelut Oy, 58 Waste food pantry
Turun Ekotori Reuse Centre/ Kestävän Kehityksen Yhdistys ry
Leipomo Salonen / surplus bread and buns, Laitilan Wirvoitusjuomatehdas / provider of fridge for waste food
Turku
Eckes-Granini Finland Oy Ab (property owner)
Turun seudun puhdistamo oy, Lounais-Suomen Jätehuolto Oy
Lounais-Suomen Jätehuolto Oy, Lounavoima Oy
CITY OF TURKU 76
Annexes of the Climate Plan
59 Low-carbon taxi transport
Taxidata
60 Carbon-neutral alcoholic beverage factory Pernod
Finland
Lounais-Suomen
Oy Contract drivers who are subcontractors of/supplied by Taxidata, for the part of electric, gas and hybrid vehicles
Ricard
Oy
Energia (supplier of district heating and steam)
61 Let's Make Air Great Again! Boat and summer cottage heaters for renewable energy SF-Lämmitin Oy Neste MY 62 A reformed biogas plant for Topinpuisto Gasum
Oy
63 Utilising biowaste that has ended up in mixed waste as fuel Gasum
Oy
Main executing body Other executing bodies and partners 64 Meyer / Carbon neutrality measures Meyer and their partners 65 University of Turku / Flavoria, The food of tomorrow / towards sustainable food.
The University of Turku Functional Foods Forum
Medisiina D along with its owners and users, partners 66 Utilising non-recyclable waste as local energy Lounavoima Oy
Lounais-Suomen Jätehuolto Oy, Salon Kaukolämpö Oy 67 Circular economy centre Topinpuisto Lounais-Suomen Jätehuolto Oy
Turku University of Applied Sciences Ltd, Ekopartnerit Turku Oy, Gasum Oy, Kaivoasema Oy, Kuusakoski Oy, Turun Maisemointi Oy 68 Enhancing transport and treatment of sewage sludge in the sparsely populated area
Lounais-Suomen Jätehuolto Oy69 Enhanced recovery of landfill gas Lounais-Suomen Jätehuolto Oy70 Enhancing separate collection of organic waste Lounais-Suomen Jätehuolto Oy
Lounais-Suomen jätehuoltolautakunta 71 LSJH / Turku University of Applied Sciences Processing of recycled textiles
Turku University of Applied Sciences, VTT Technical Research Centre of Finland, collaboration partners and investors 72 Solar electricity system for the wastewater treatment plant in Huittinen
Lounais-Suomen Jätehuolto Oy
Turun Seudun Vesi Oy Salo Solar Oy 73 Generating energy from water flow Turun Seudun Vesi Oy74 Utilising heat energy of drinking water Turun Seudun Vesi Oy75 Turku Stars Carbon Neutral City Experience for Kids and Youth Zeamly Oy Business network founded by Zeamly Oy in collaboration with the City of Turku 76 Cutting of reed beds and advancing the circular economy of reed material RH-Harvesting Oy 77 Emission free Cathedral Park Terrace Turku Food & Wine Fest Oy Peipponen Express Oy Maxus 78 Electric mobile library Lieke Turku City Library JETI Industries Ltd ja Turun Anikistit ry
CITY OF TURKU 77
Annexes of the Climate Plan Number Title of measure
Number Title of measure
Main executing body
Other executing bodies and partners 79
Reducing the carbon footprint of the school and day-care centre menu
Arkea Oy
City of Turku, Turku University of Applied Sciences 80
Carbon-neutral property investments by 2030
Veritas Pension Insurance81 Calculating the carbon footprint of a microbusiness MuotoMyrsky Oy Carbonwise project Turku University of Applied Sciences 82
Carbon-neutral Bar Ö
Flegma Oy
HNRY-koulutus (training about carbon-neutral resource-wise businesses), Jussi Kallio (Green Event) 83 Planet Company service for communications on climate -and corporate responsibility actions
The Planet Company Oy 84 Infraroad Oy has taken renewable fuels into use in all equipment Infraroad Oy 85
Enhancing nutrient cycle as part of the reformation of the biogas plant Gasum
Turun Seudun Puhdistamo, LounaisSuomen Jätehuolto Oy and partners in industry and use of nutrients 86
Accelerating sustainable development in Science Park with local businesses Turku Science Park Oy City of Tampere, City of Espoo 87 Advancing cycling in Turku Turun Pyörämessut Oy
City of Turku and several private sector and third sector operators 88
Delivering parcels in Turku city centre emission-free Peipponen Express Oy ja GLS Finland Oy 89
Combined production of district heating and district cooling with a heat pump in Turku Student Village
The HybridHeat system in Turku Student Village that supports energy positivity
Oilon Oy
RESPONSE project, Turku Energia, VTT, Högfors GST 90
HögforsGST Oy
RESPONSE project, Oilon Oy
CITY OF TURKU 78
Annexes of the Climate Plan
ANNEX 3. Climate risk cards
The risk cards contain descriptions of the climate risks that have been assessed as the most significant in Turku along with their impacts. The intensity of these impacts is affected by several factors, such as the future development of greenhouse gas emissions and the city’s capacity to develop its adaptation ability.
The identified city level vulnerability and exposure factors have been listed for each risk. City services and functions where the risk particularly needs to be taken into consideration in the planning of operations and adaptation measures have also been included.
The cards also contain the main City of Turku development programmes, plans and policies where the risk must be taken into consideration.
The sectors assessed as the most vulnerable have been indicated with the attached symbols. The division into sectors is in keeping with the reporting requirements of the Covenant of Mayors.
The risk cards are continuously maintained and updated.
Vulnerable sector
Buildings Transport Energy Water Waste Land use planning
Agriculture and forestry Environment and biodiversity
Health Rescue services
Tourism Education Data and communication connections
Symbol
CITY OF TURKU 79
the Climate Plan
Annexes of
Extreme heat
Due to climate change, heatwaves will become more common and more intense. Warmer summers bring along the increased need to cool down buildings.
Effects: y harm to health and discomfort caused by heat y effects on access to household water and effects on water services especially in non-built-up areas y drop in work efficiency y increased need to cool down buildings y increased need for home care in elderly care (apartments can be cooled down to varying extent) y effects on nature y effects on the state of the Baltic Sea
Vulnerability and exposure factors: y ageing of the population (the elderly are more susceptible to adverse effects of heat) y number of indoor spaces without air conditioning y urban heat island phenomenon (urban areas are hotter than the surrounding areas)
City of Turku services and functions where particular attention must be paid to the risk: y kaupunkiympäristö (kaupunkisuunnittelu, kaupunkirakentaminen, rakennus- ja terveysvalvonta),
City of Turku action plans and policies where the risk must be taken into consideration: y taking the green structure into consideration in city planning, forest plan, urban tree policies, building order (including green factor), preparedness plans, workplace survey.
CITY OF TURKU 80
of the Climate Plan
Annexes
RK 1
Drought and scarcity of water
Climate change may bring along increased and prolonged dry periods. Having longer dry periods may reduce the amount of groundwater in the summer. Especially during summers, drought may lead to water shortage, causing problems particularly to small water reserves and rural areas. Water shortages can have a negative impact on water supply, waterborne transport, energy production as well as industry.
Effects: y increased need for irrigation y yield losses in agriculture y increased risk of wildfires and forest fires, harm caused by smoke from fires, damage to property y challenges with sufficiency and quality of household water and irrigation water y effects on nature y adverse impacts of road dust
Vulnerability and exposure factors: y drought resistance of plant species (e.g. rock meadows typical of Turku)
City of Turku services and functions where particular attention must be paid to the risk: y urban environment (urban planning, urban construction, maintenance, environmental protection), the Turku City Group’s subsidiaries (water supply companies)
City of Turku action plans and policies where the risk must be taken into consideration: y development plan for water services, stormwater programme, biodiversity programme, forest plan, urban tree policies, building order (including green factor).
CITY OF TURKU 81
of the Climate Plan
Annexes
RK 2
Forest fires and wild fires
The risk of forest fires is expected to grow in the future due to climate change. In vast forest fires, significant amounts of carbon stored in vegetation are released into the atmosphere, accelerating climate change. Forest fires deteriorate air quality locally and emit black carbon, also known as soot, into the atmosphere. Black carbon has a warming effect on climate.
Effects: y forest damages caused by fires y effects on nature y damages to buildings, property and man y potentially significant costs caused by firefighting y harm caused by smoke, temporarily lowered air quality (causing discomfort especially to those with respiratory illnesses)
Vulnerability and exposure factors: y ignoring fire bans issued in connection with forest fire warnings y sufficiency of the capacity of rescue services
City of Turku services and functions where particular attention must be paid to the risk: y urban environment (urban planning, maintenance, environmental protection), leisure (sports, tourism), education
City of Turku action plans and policies where the risk must be taken into consideration: y forest plan, safety plan, preparedness plans
CITY OF TURKU 82
of the Climate Plan
Annexes
RK 3
Freezing-melting cycle

During the winter season, as the temperature varies above and below zero, the cyclic freezing-melting phenomenon causes increased slipperiness and affects maintenance of community infrastructure. It is estimated that such circumstances will first increase with global warming but will later decrease as winters become shorter.
Effects: y an increase and later a decrease in the need for slipperiness prevention y impacts of slipperiness prevention on nature y increased road dust y risks of slip accidents y decay of structures and road network and increased need for maintenance (wells, road network, stormwater network)
Vulnerability and exposure factors: y extent of the road and property network requiring maintenance y dependency on well water
City of Turku services and functions where particular attention must be paid to the risk: y urban environment (urban construction/maintenance, mobility services), leisure (sports), Central Administration (facility services)
City of Turku action plans and policies where the risk must be taken into consideration: y maintenance of road areas and green areas as part of regional maintenance contracts, stormwater programme, building order and construction policies
CITY OF TURKU 83
of the Climate Plan
Annexes
RK 4
Rainstorms

The intensity of rainstorms will increase during all seasons. Annual precipitation in Southwest Finland is expected to increase by 6 to 10 per cent by 2100. The number of precipitation days will increase particularly during the winter period.
Effects: y Flood risks and damages (such as water damages in buildings, damages to community infrastructure) y river erosion and collapses of river dikes y nutrient pollution and eutrophication of the Archipelago Sea and water bodies y peaks in pollutants y increased need for dredging
Vulnerability and exposure factors: y condensing urban structure y wide water impermeable surfaces in built-up areas y clay soil that slows down absorption of water y capacity of stormwater system
City of Turku services and functions where particular attention must be paid to the risk: y urban environment (urban planning, urban construction, building control and health control, maintenance, environmental protection), the Turku City Group’s subsidiaries (water supply companies, energy and infrastructure)
City of Turku action plans and policies where the risk must be taken into consideration: y stormwater programme, development plan for water services, flood risk management plan, taking the green structure into consideration in city planning, building order (including green factor), preparedness plans
CITY OF TURKU 84
of the Climate Plan
Annexes
RK 5
Floods and rising sea level
As a result of intensifying rainstorms, stormwater risks in particular will increase. Also the risk of sea floods, especially resulting from winter storms, is significant in the coastal area of Turku. The likelihood of high sea levels is not estimated to rise significantly in the Archipelago Sea by year 2050, but it will rise towards the end of the century.

Effects:
y damages caused by floods to buildings, infrastructure, property and man y effects on transport, energy, waste management and water management networks and telecommunications y effects on the ecosystem y effects on agriculture
Vulnerability and exposure factors: y Tthe geographical location of Turku on the coast y city planning and construction in areas identified as flood risk areas (in the master plan, these are areas of industry and central operations located in sea flood areas in the southwest (including Linnanniemi) and a residential area in Pihlajaniemi) y wide water impermeable surfaces in built-up areas y insufficient dimensioning of flood management measures
City of Turku services and functions where particular attention must be paid to the risk: y urban environment (urban planning, urban construction, building control and health control), Central Administration (facility services), Turku City Group’s subsidiaries (water supply companies, energy and infrastructure (including the port))
City of Turku action plans and policies where the risk must be taken into consideration: y master plans and city plans, stormwater programme, the Baltic Sea Challenge action plan, flood risk management plan (local), building order (including green factor), preparedness plans
CITY OF TURKU 85
of the Climate Plan
Annexes
RK 6
Storms

In the light of current information, significant changes in the number and intensity of storms are not likely, but the impacts of storms will increase as ground frost decreases. Average storm intensities will remain approximately the same, while wind speed will increase during winter and spring. Risks are caused by sea water floods resulting from winter storms and by stormwater floods resulting from thunder storms.
Effects: y damages caused by storms to buildings, community infrastructure, property and man y disruptions in distribution of electricity, resulting in effects on heating, water distribution, telecommunications and other functions of society y harm to transport and transport infrastructure y effects on nature (deforestation)
Vulnerability and exposure factors: y level of underground cabling of the electricity network, self-sufficiency y insufficient preparedness on an individual level, limited ability to make an impact y lack of emergency power generators
City of Turku services and functions where particular attention must be paid to the risk: y urban environment (urban construction/maintenance, mobility services), the Turku City Group’s subsidiaries (energy and infrastructure (including the port), water supply companies, housing and property companies)
City of Turku action plans and policies where the risk must be taken into consideration: y safety plan, flood risk management plan (local), stormwater programme, development plan for water services, forest plan, urban tree policies, preparedness plans
CITY OF TURKU 86
of the Climate Plan
Annexes
RK 7
Changes in ecosystems
Many kinds of effects on ecosystems and changes in the composition of species can be expected due to changes in temperatures and precipitation as well as due to extreme weather events becoming more common.
Effects: y changes in the composition of species, decreased biodiversity y spreading of harmful non-native species y increased harm caused by plant diseases and pest insects (e.g. Dutch elm disease) y effects from the point of view of agriculture and forestry

Vulnerability and exposure factors: y fragmentation of green areas y insufficiency of ecological corridors y condensing urban structure y the vulnerability and unique biotopes of the coastal and archipelago nature
City of Turku services and functions where particular attention must be paid to the risk: y urban environment (urban planning, urban construction, maintenance, environmental protection, health control)
City of Turku action plans and policies where the risk must be taken into consideration: y taking the green structure into consideration in city planning, urban tree policies, biodiversity programme, forest plan, building order (including green factor)
CITY OF TURKU 87
of the Climate Plan
Annexes
RK 8
Biological risk factors
Many disease risks are connected to the weather and human actions. For instance, diseases spread by ticks will become more common due to global warming and as the period of growth becomes extended.

Effects: y increased risk of waterborne diseases as rainstorms become more common (household water) and during periods of heat (bathing water) y spreading of new plant diseases and pest insects y tick-borne illnesses becoming more common
Vulnerability and exposure factors: y number of people in high-risk groups y sufficiency of health care capacity
City of Turku services and functions where particular attention must be paid to the risk: y urban environment (urban construction/maintenance, environmental protection, environmental health)
City of Turku action plans and policies where the risk must be taken into consideration: y biodiversity programme, forest plan, urban tree policies, preparedness plans, monitoring plan of environmental health
CITY OF TURKU 88
of the Climate Plan
Annexes
RK 9
Spillover effects
Spillover effects refer to interaction chains of weather and climate variability and climate change that begin outside Finnish borders but ultimately extend to Finland. These effects may be diverse.
Effects: y challenges in availability of raw material or imported energy y weakened security of supply y uncontrollable immigration (climate refugees) and segregation y effects on health y effects on tourism y factors affecting quality of air (air transport)
Vulnerability and exposure factors: y sufficiency of financial resources in society y level of stability in society
City of Turku services and functions where particular attention must be paid to the risk: y urban environment, education, leisure, employment, Central Administration, the Turku City Group’s subsidiaries
City of Turku action plans and policies where the risk must be taken into consideration: y safety plan, preparedness plans, strategies
CITY OF TURKU 89
of the Climate Plan
Annexes
RK 10
ANNEX 4. Assessment of the current state of adaptation
The assessment of the current state of adaptation was completed using an adaptation score board in accordance with the SECAP report model. The city's state in climate change adaptation work was entered into a scoreboard. The city’s situation was assessed using the A–D scaling system where:
ANNEX 2 - Adaptation Scoreboard
A = Taking the lead (over 75% completed)
complete the following self-assessment checklist, using the A-B-C-D scaling system (presented below) in column F (compulsory). Identify your next steps/areas of possible improvements through comments entered in column average status for every step is then visualised through the (automatically computed) spider graph below a well as in the "Synthesis Report" tab.
B = Forging ahead (50–75% completed) C = Moving forward (25–50% completed)


D = Not started or getting started (less than25 % completed)
STEP 1 - Preparing the ground
The conclusions drawn from the assessment of the current state of adaptation have been pre sented in section 6.1 of the Climate Plan 2029.
Status Scale Status Indicative Completion Level D Not started or getting started 0-25 % C Moving forward 25-50 % B Forging ahead 50-75 % A Taking the lead 75-100 % Adaptation cycle steps
STEP 1 - Preparing the ground for adaptation
STRATEGY
STEP 2 - Assessing risks & vulnerabilities to climate change
STEPS 3 & 4 - Identifying, assessing and selecting adaptation options
ACTIONS
STEP 5 - Implementing
STEP 6 - Monitoring and evaluating
Summary table:
Actions
Adaptation commitments defined/integrated into the local climate policy
Human, technical and financial resources identified Adaptation team (officer) appointed within the municipal administration and clear respondibilities assigned
Horizontal (i.e. accross sectoral departments) coordination mechanisms in place Vertical (i.e. accross governance levels) coordination mechanisms in place
Consultative and participatory mechanisms set up, fostering the multi-stakeholder engagement in the adaptation process Continuous communication process in place (for the engagement of the different target audiences)
Mappping of the possible methods & data sources for carrying out a Risk & Vulnerability Assessment conducted Assessment(s) of climate risks & vulnerabilities undertaken
Possible sectors of action identified and prioritised Available knowledge periodically reviewed and new findings integrated
Full portfolio of adaptation options compiled, documented and assessed Possibilities of mainstreaming adaptation in existing policies and plans assessed, possible synergies and conflicts (e.g. with mitigation actions) identified Adaptation Actions developed and adopted (as part of the SECAP and/or other planning documents)
Implementation framework set, with clear milestones
Adaptation actions implemented and mainstreamed (where relevent) as defined in the adopted SECAP and/or other planning documents Coordinated action between mitigation and adaptation set
Monitoring framework in place for adaptation actions Appropriate M&E indicators identified
Progress regularly monitored and reported to the relevant decision-makers
Adaptation strategy and/or Action Plan updated, revised and readjusted according to the findings of the M&E procedure
STEP 5 - Implementing
A B C D ACTIONS
STEP risks STEPS Identifying options
The score obtained for each step is summarised in the table below (based on the information entered by the user in the above table > A: 4 points, B: 3 points, C: 2 points, D: 1 point). the top is automatically generated, making the results more visual.
Adaptation Steps
Your Average Score
STEP 1 - Preparing the ground 3
STEP 2 - Assessing risks & vulnerabilities 3
STEPS 3 & 4 - Identifying adaptation options 3
STEP 5 - Implementing 2
STEP 6 - Monitoring & evaluating 2
CITY OF TURKU 90
of the Climate Plan
Annexes
Self check
Comments B C C B B B C B A B B C B B C C B C C C B
of the Status
Please
STEP 6 - Monitoring & evaluating RISKS & VULNERABILITIES INDICATORS
ANNEX 5. Concepts of the Climate Plan
Exposure
The location of the object of risk. Exposure to the impacts of weather events and climate change can be assessed on the basis of encounter: whether an activity takes place, or an operator is located in a place where they can potentially experience harm or danger. From the point of view of exposure, the location of the object is key. An example might be a coastal location or living in a flood risk area.
CDP, Disclosure Insight Action (previously Carbon Disclosure Project)
CDP is a global non-profit organisation with the task of encouraging businesses, cities and governments to reduce their greenhouse gas emissions, secure the water supply and protect forests. CDP is the leading gatherer of climate change related data and reporting in the world. Turku has been ranked in the highest A class in 2021, 2020 and 2019.
Vulnerability
The qualities of the object of risk. Factors affecting vulnerability include, among others, financial circumstances, the level of education, the age structure of the population, and institutions and organisations whose ability to anticipate exposure and momentarily reduce vulnerability is crucial from the point of view of how wide-reaching the consequences are.
Carbon dioxide equivalent
The carbon dioxide equivalent is used to make the impact of different greenhouse gases in the atmosphere commensurable. For instance, methane is released in many processes, and it heats the climate approximately 25 times more than carbon dioxide. When methane emissions and greenhouse gas emissions are expressed in carbon dioxide equivalents, expressing the quantity of emissions can be simplified.
Carbon footprint
Carbon footprint refers to the climate burden of a specific limited entity. A carbon footprint can be calculated e.g., for a business, municipality, investment, product or service based on the quantity of greenhouse gas emissions caused by producing it, consuming and disposing of it.
Carbon handprint
Carbon handprint refers to the positive climate impacts of a specific solution during its life cycle. A positive carbon handprint results from a situation where using a certain solution reduces someone else’s (a client, for instance) carbon footprint.
Carbon neutral
A carbon-neutral municipality, product or service does not burden the environment. In practice, this means that the local emissions and carbon sinks (as well as potential offsetting measures) balance each other out. The carbon footprint is calculated for businesses and communities, and it is then reduced using the means available. Emissions that can’t be reduced are offset. In emission offsetting, it is ensured in a reliable way that emission reductions take place.
CITY OF TURKU 91
of the Climate Plan
Annexes
Carbon sink
A carbon sink collects and stores a chemical compound that contains carbon, often carbon di oxide. The most important carbon sinks are the seas and forests. In photosynthesis, algae and plants convert carbon dioxide from the air into their own biomass. In addition, carbon dioxide dissolves into seas both in carbon dioxide form and in other inorganic forms.
Carbon balance
Carbon balance is the difference between absorbed and released carbon within a certain period of time, such as a year. A positive balance means that more carbon has been absorbed than released. For instance, a forest acts as a carbon sink when it removes carbon from the atmos phere. On the other hand, a forest is a source of carbon if it releases more carbon (as a result of tree felling, for example) than it absorbs.
Climate budget
The climate budget links climate work to the city’s budget and financial statements. It helps com pile, manage and monitor climate investments and actions, and increases their visibility. The cli mate budget provides information for decision-making and increases transparency from the point of view of municipal residents.
Climate positive
In terms of a city or an area, this refers to a positive net impact on climate change mitigation. Climate positivity helps in preventing climate change or slows climate change down. In practice, this means that more carbon is absorbed than released into the atmosphere. In other words, the emissions are negative. A city that is climate positive can be considered to change the net impact in its area from one warming the climate to one cooling the climate.
Climate risk
Climate risks refer to potential direct and indirect harm to human action, businesses and the environment, caused by climate, weather and their development. Factors affecting the emergence of a risk include the risk factor, exposure and vulnerability.
Normalised emissions calculation
Normalisation of emissions, also known as weather correction (heating degree days correction), makes the calculated development of emissions comparable regardless of temperature differences in different years. The measured emissions are normalised so that the impacts of emission-reducing actions can be compared.
Emission factor
The emission factor refers to the quantity of resulting emission in relation to the quantity of the product or service produced.
Carbon offsetting
The starting point of offsetting activity is an implemented project that has reduced greenhouse
CITY OF TURKU 92
Annexes of the Climate Plan
gas emissions or increased carbon sinks by the quantity of emission reduction units on sale.
One emission reduction unit equates to either a reduction in greenhouse gas emissions or an increase in carbon sinks worth a tonne of carbon dioxide equivalents (1 t CO2-eq). For instance, a municipality, business, organisation or consumer can offset the greenhouse gas emissions caused by their action by buying an equivalent amount of emission reduction units or by increas ing carbon sinks.
Adaptation
The ability of human systems and natural systems to function in the current climate, and their preparation for future changes in climate and their ramifications. Through adaptation, we seek to prevent or mitigate the negative impacts of climate variation and change as well as to benefit from the positive impacts. Adaptation can mean reacting to situations or anticipating them.
Risk factor
A phenomenon causing a risk. This could be, for instance, a storm, a heatwave or a rainstorm.
CITY OF TURKU 93
Annexes of the Climate Plan

