ED Operations
372 Physician Productivity and Supervision


KE Schreyer, D Kuhn, V Norton on behalf of the AAEM Board of Directors

377 Improving Accessibility in the Emergency Department for Patients with Disabilities: A Qualitative Study
JH Carmichael, KM Kalagher, P Modi, MA Reznek
384 Large-scale Implementation of Fascia Iliaca Compartment Blocks in an Emergency Department TDowns, J Jacquet, J Disch, N Kolodychuk, L Talmage, JA Krizo, E Simon, A Meehan, R Stenberg
390 Bouncebacks to the Emergency Department Observation Unit: Who, What, When, and Why?
DJ Berger S King, C Caldwell, K Soto, A Chambers, S Boehmer, R Gopaul

396 Implementation of a Pharmacist-Led Urinary Culture Follow-up After Discharge from the Emergency Department
DH Pham, S Lee, SAbrishami, B Chakravarthy, S Saadat
401 National Trends in Arrival Vital Sign Abnormalities in Emergency Departments R Salhi, M Greenwood-Eriksen, K Kocher

Endemic Infections
405 Characteristics of Discharged Emergency Department Patients with Suspected COVID-19 Who Returned within 72 hours during the First Wave
JF Gong, R Mayorga, R Hentz, S Demissie, M Lesser, F Davis, A Berman, M Barish, SL Cohen, K van Loveren, N Kwon
416 Association of Early Serum Phosphate Levels and Mortality in Patients with Sepsis
LP Black, M Mohseni, E Shirazi, K Hartman, C Smotherman, C Hopson, E DeVos, R Fernandez, J Sheele, F Guirgis
Contents continued on page iii

Volume 24, Number 3, May 2023 Open Access at WestJEM.com ISSN 1936-900X West A Peer-Reviewed, International Professional Journal Western Journal of Emergency Medicine VOLUME 24, NUMBER 3, May 2022 PAGES 372-653
Journal of Emergency Medicine: Integrating Emergency Care
Population Health Indexed in
Western
with
MEDLINE
Penn State Health Emergency Medicine


About Us:
Penn State Health is a multi-hospital health system serving patients and communities across central Pennsylvania. We are the only medical facility in Pennsylvania to be accredited as a Level I pediatric trauma center and Level I adult trauma center. The system includes Penn State Health Milton S. Hershey Medical Center, Penn State Health Children’s Hospital, and Penn State Cancer Institute based in Hershey, Pa.; Penn State Health Hampden Medical Center in Enola, Pa.; Penn State Health Holy Spirit Medical Center in Camp Hill, Pa.; Penn State Health St. Joseph Medical Center in Reading, Pa.; Penn State Health Lancaster Pediatric Center in Lancaster, Pa.; Penn State Health Lancaster Medical Center (opening fall 2022); and more than 3,000 physicians and direct care providers at more than 126 outpatient practices in 94 locations. Additionally, the system jointly operates various health care providers, including Penn State Health Rehabilitation Hospital, Hershey Outpatient Surgery Center, Hershey Endoscopy Center, Horizon Home Healthcare and the Pennsylvania Psychiatric Institute.
We foster a collaborative environment rich with diversity, share a passion for patient care, and have a space for those who share our spark of innovative research interests. Our health system is expanding and we have opportunities in both academic hospital as well community hospital settings.


Benefit highlights include:
• Competitive salary with sign-on bonus

• Comprehensive benefits and retirement package
• Relocation assistance & CME allowance
• Attractive neighborhoods in scenic central Pa.


FOR MORE INFORMATION PLEASE CONTACT: Heather Peffley, PHR CPRP - Penn State Health Lead Physician Recruiter
hpeffley@pennstatehealth.psu.edu
Penn State Health is fundamentally committed to the diversity of our faculty and staff. We believe diversity is unapologetically expressing itself through every person’s perspectives and lived experiences. We are an equal opportunity and affirmative action employer. All qualified applicants will receive consideration for employment without regard to age, color, disability, gender identity or expression, marital status, national or ethnic origin, political affiliation, race, religion, sex (including pregnancy), sexual orientation, veteran status, and family medical or genetic information.
JOIN OUR TEAM EMERGENCY MEDICINE OPPORTUNITIES AVAILABLE
Andrew W. Phillips, MD, Associate Editor DHR Health-Edinburg, Texas
Edward Michelson, MD, Associate Editor Texas Tech University- El Paso, Texas
Dan Mayer, MD, Associate Editor Retired from Albany Medical College- Niskayuna, New York
Wendy Macias-Konstantopoulos, MD, MPH, Associate Editor Massachusetts General Hospital- Boston, Massachusetts
Gayle Galletta, MD, Associate Editor University of Massachusetts Medical SchoolWorcester, Massachusetts
Yanina Purim-Shem-Tov, MD, MS, Associate Editor Rush University Medical Center-Chicago, Illinois
Resident Editors
AAEM/RSA
John J. Campo, MD Harbor-University of California, Los Angeles Medical Center
Tehreem Rehman, MD
Advocate Christ Medical Center
ACOEP
Justina Truong, DO Kingman Regional Medical Center
Section Editors
Behavioral Emergencies
Leslie Zun, MD, MBA Chicago Medical School
Marc L. Martel, MD
Hennepin County Medical Center
Cardiac Care
Fred A. Severyn, MD University of Colorado School of Medicine
Sam S. Torbati, MD
Cedars-Sinai Medical Center
Clinical Practice
Cortlyn W. Brown, MD Carolinas Medical Center
Casey Clements, MD, PhD Mayo Clinic
Patrick Meloy, MD
Emory University
Nicholas Pettit, DO, PhD Indiana University
David Thompson, MD University of California, San Francisco
Kenneth S. Whitlow, DO
Kaweah Delta Medical Center
Critical Care
Christopher “Kit” Tainter, MD University of California, San Diego
Gabriel Wardi, MD University of California, San Diego
Joseph Shiber, MD
University of Florida-College of Medicine
Matt Prekker MD, MPH
Hennepin County Medical Center
David Page, MD University of Alabama
Erik Melnychuk, MD
Geisinger Health
Quincy Tran, MD, PhD University of Maryland
Disaster Medicine
Mark I. Langdorf, MD, MHPE, Editor-in-Chief University of California, Irvine School of MedicineIrvine, California
Shahram Lotfipour, MD, MPH, Managing Editor University of California, Irvine School of MedicineIrvine, California
Michael Gottlieb, MD, Associate Editor Rush Medical Center-Chicago, Illinois
Niels K. Rathlev, MD, Associate Editor Tufts University School of Medicine-Boston, Massachusetts
Rick A. McPheeters, DO, Associate Editor Kern Medical- Bakersfield, California
Gentry Wilkerson, MD, Associate Editor University of Maryland
John Broach, MD, MPH, MBA, FACEP University of Massachusetts Medical School
UMass Memorial Medical Center
Christopher Kang, MD Madigan Army Medical Center
Education
Danya Khoujah, MBBS University of Maryland School of Medicine
Jeffrey Druck, MD University of Colorado
John Burkhardt, MD, MA University of Michigan Medical School
Michael Epter, DO Maricopa Medical Center
ED Administration, Quality, Safety
David C. Lee, MD Northshore University Hospital
Gary Johnson, MD Upstate Medical University
Brian J. Yun, MD, MBA, MPH Harvard Medical School
Laura Walker, MD Mayo Clinic
León D. Sánchez, MD, MPH Beth Israel Deaconess Medical Center
William Fernandez, MD, MPH University of Texas Health-San Antonio
Robert Derlet, MD Founding Editor, California Journal of Emergency Medicine University of California, Davis
Emergency Medical Services Daniel Joseph, MD Yale University
Joshua B. Gaither, MD University of Arizona, Tuscon
Julian Mapp University of Texas, San Antonio
Shira A. Schlesinger, MD, MPH Harbor-UCLA Medical Center
Geriatrics
Cameron Gettel, MD Yale School of Medicine
Stephen Meldon, MD Cleveland Clinic
Luna Ragsdale, MD, MPH Duke University
Health Equity
Emily C. Manchanda, MD, MPH Boston University School of Medicine
Shadi Lahham, MD, MS, Deputy Editor Kaiser Permanente- Irvine, California
Susan R. Wilcox, MD, Associate Editor Massachusetts General Hospital- Boston, Massachusetts
Elizabeth Burner, MD, MPH, Associate Editor University of Southern California- Los Angeles, California
Patrick Joseph Maher, MD, MS, Associate Editor Ichan School of Medicine at Mount Sinai- New York, New York
Donna Mendez, MD, EdD, Associate Editor University of Texas-Houston/McGovern Medical School- Houston Texas
Danya Khoujah, MBBS, Associate Editor
University of Maryland School of Medicine- Baltimore, Maryland
Faith Quenzer Temecula Valley Hospital San Ysidro Health Center
Mandy J. Hill, DrPH, MPH UT Health McGovern Medical School
Payal Modi, MD MScPH
University of Massachusetts Medical
Infectious Disease
Elissa Schechter-Perkins, MD, MPH Boston University School of Medicine
Ioannis Koutroulis, MD, MBA, PhD
George Washington University School of Medicine and Health Sciences
Kevin Lunney, MD, MHS, PhD University of Maryland School of Medicine
Stephen Liang, MD, MPHS Washington University School of Medicine
Victor Cisneros, MD, MPH
Eisenhower Medical Center
Injury Prevention Mark Faul, PhD, MA
Centers for Disease Control and Prevention
Wirachin Hoonpongsimanont, MD, MSBATS
Eisenhower Medical Center
International Medicine
Heather A.. Brown, MD, MPH
Prisma Health Richland
Taylor Burkholder, MD, MPH
Keck School of Medicine of USC
Christopher Greene, MD, MPH University of Alabama
Chris Mills, MD, MPH
Santa Clara Valley Medical Center
Shada Rouhani, MD
Brigham and Women’s Hospital
Legal Medicine
Melanie S. Heniff, MD, JD
Indiana University School of Medicine
Greg P. Moore, MD, JD Madigan Army Medical Center
Statistics and Methodology
Shu B. Chan MD, MS Resurrection Medical Center
Stormy M. Morales Monks, PhD, MPH Texas Tech Health Science University
Soheil Saadat, MD, MPH, PhD University of California, Irvine
James A. Meltzer, MD, MS
Albert Einstein College of Medicine
Musculoskeletal
Juan F. Acosta DO, MS
Pacific Northwest University
Rick Lucarelli, MD
Medical City Dallas Hospital
William D. Whetstone, MD
University of California, San Francisco
Neurosciences
Antonio Siniscalchi, MD
Annunziata Hospital, Cosenza, Italy
Pediatric Emergency Medicine
Paul Walsh, MD, MSc University of California, Davis
Muhammad Waseem, MD
Lincoln Medical & Mental Health Center
Cristina M. Zeretzke-Bien, MD University of Florida
Public Health
Jacob Manteuffel, MD
Henry Ford Hospital
John Ashurst, DO
Lehigh Valley Health Network

Tony Zitek, MD
Kendall Regional Medical Center
Trevor Mills, MD, MPH
Northern California VA Health Care
Erik S. Anderson, MD
Alameda Health System-Highland Hospital
Technology in Emergency Medicine
Nikhil Goyal, MD
Henry Ford Hospital
Phillips Perera, MD
Stanford University Medical Center
Trauma
Pierre Borczuk, MD
Massachusetts General Hospital/Havard Medical School
Toxicology
Brandon Wills, DO, MS
Virginia Commonwealth University
Jeffrey R. Suchard, MD University of California, Irvine
Ultrasound
J. Matthew Fields, MD
Thomas Jefferson University
Shane Summers, MD Brooke Army Medical Center
Robert R. Ehrman
Wayne State University
Ryan C. Gibbons, MD Temple Health
Official Journal of the California Chapter of the American College of Emergency Physicians, the America College of Osteopathic Emergency Physicians, and the California Chapter of the American Academy of Emergency Medicine


Volume 24, NO. 3: May 2023 i Western Journal of Emergency Medicine Available in MEDLINE, PubMed, PubMed Central, CINAHL, SCOPUS, Google Scholar, eScholarship, Melvyl, DOAJ, EBSCO, EMBASE, Medscape, HINARI, and MDLinx Emergency Med. Members of OASPA. Editorial and Publishing Office: WestJEM/Depatment of Emergency Medicine, UC Irvine Health, 3800 W. Chapman Ave. Suite 3200, Orange, CA 92868, USA Office: 1-714-456-6389; Email: Editor@westjem.org Western Journal
Emergency Medicine
Integrating Emergency Care with Population Health Indexed in MEDLINE, PubMed, and Clarivate Web of Science, Science Citation Index Expanded
of
:
Western
Amin A. Kazzi, MD, MAAEM The American University of Beirut, Beirut, Lebanon
Anwar Al-Awadhi, MD
Mubarak Al-Kabeer Hospital, Jabriya, Kuwait
Arif A. Cevik, MD United Arab Emirates University College of Medicine and Health Sciences, Al Ain, United Arab Emirates
Abhinandan A.Desai, MD University of Bombay Grant Medical College, Bombay, India
Bandr Mzahim, MD King Fahad Medical City, Riyadh, Saudi Arabia
Brent King, MD, MMM University of Texas, Houston
Christopher E. San Miguel, MD Ohio State University Wexner Medical Center
Daniel J. Dire, MD University of Texas Health Sciences Center San Antonio
David F.M. Brown, MD Massachusetts General Hospital/ Harvard Medical School
Douglas Ander, MD Emory University
Editorial Board
Edward Michelson, MD Texas Tech University
Edward Panacek, MD, MPH University of South Alabama
Francesco Della Corte, MD
Azienda Ospedaliera Universitaria
“Maggiore della Carità,” Novara, Italy
Francis Counselman, MD Eastern Virginia Medical School
Gayle Galleta, MD
Sørlandet Sykehus HF, Akershus Universitetssykehus, Lorenskog, Norway
Hjalti Björnsson, MD Icelandic Society of Emergency Medicine
Jacob (Kobi) Peleg, PhD, MPH Tel-Aviv University, Tel-Aviv, Israel
Jaqueline Le, MD Desert Regional Medical Center
Jeffrey Love, MD The George Washington University School of Medicine and Health Sciences
Jonathan Olshaker, MD Boston University
Katsuhiro Kanemaru, MD University of Miyazaki Hospital,
Miyazaki, Japan Kenneth V. Iserson, MD, MBA University of Arizona, Tucson
Khrongwong Musikatavorn, MD King Chulalongkorn Memorial Hospital, Chulalongkorn University, Bangkok, Thailand
Leslie Zun, MD, MBA Chicago Medical School
Linda S. Murphy, MLIS University of California, Irvine School of Medicine Librarian
Nadeem Qureshi, MD St. Louis University, USA Emirates Society of Emergency Medicine, United Arab Emirates
Niels K. Rathlev, MD Tufts University School of Medicine
Pablo Aguilera Fuenzalida, MD Pontificia Universidad Catolica de Chile, Región Metropolitana, Chile
Peter A. Bell, DO, MBA Baptist Health Sciences University
Peter Sokolove, MD University of California, San Francisco
Rachel A. Lindor, MD, JD Mayo Clinic
Robert M. Rodriguez, MD
University of California, San Francisco
Robert Suter, DO, MHA UT Southwestern Medical Center
Robert W. Derlet, MD University of California, Davis
Rosidah Ibrahim, MD Hospital Serdang, Selangor, Malaysia
Samuel J. Stratton, MD, MPH Orange County, CA, EMS Agency
Scott Rudkin, MD, MBA University of California, Irvine
Scott Zeller, MD University of California, Riverside
Steven H. Lim, MD
Changi General Hospital, Simei, Singapore
Terry Mulligan, DO, MPH, FIFEM
ACEP Ambassador to the Netherlands Society of Emergency Physicians
Vijay Gautam, MBBS
University of London, London, England
Wirachin Hoonpongsimanont, MD, MSBATS
Siriraj Hospital, Mahidol University, Bangkok, Thailand
Editorial Staff Advisory Board
Elena Lopez-Gusman, JD California ACEP American College of Emergency Physicians

Jennifer Kanapicki Comer, MD FAAEM California Chapter Division of AAEM Stanford University School of Medicine
Katie Geraghty American College of Osteopathic Emergency Physicians
Kimberly Ang, MBA UC Irvine Health School of Medicine
Randall J. Young, MD, MMM, FACEP California ACEP American College of Emergency Physicians Kaiser Permanente
Mark I. Langdorf, MD, MHPE, FAAEM, FACEP UC Irvine Health School of Medicine
Robert Suter, DO, MHA American College of Osteopathic Emergency Physicians UT Southwestern Medical Center
Shahram Lotfipour, MD, MPH FAAEM, FACEP UC Irvine Health School of Medicine
Jorge Fernandez, MD, FACEP UC San Diego Health School of Medicine
Isabelle Nepomuceno, BS Executive Editorial Director
Visha Bajaria, BS WestJEM Editorial Director
Anuki Edirimuni, BS WestJEM Editorial Director
Zaynab Ketana, BS CPC-EM Editorial Director Associate Marketing Director
Stephanie Burmeister, MLIS WestJEM Staff Liaison
Cassandra Saucedo, MS Executive Publishing Director
Jordan Lam, BS WestJEM Publishing Director
Anthony Hoang, BS WestJEM Associate Publishing Director
Rubina Rafi, BS CPC-EM Publishing Director
Avni Agrawal, BS WestJEM Associate Publishing Director Associate Marketing Director
June Casey, BA Copy Editor
Western Journal of Emergency Medicine ii Volume 24, NO. 3: May 2023 Available in MEDLINE, PubMed, PubMed Central, Europe PubMed Central, PubMed Central Canada, CINAHL, SCOPUS, Google Scholar, eScholarship, Melvyl, DOAJ, EBSCO, EMBASE, Medscape, HINARI, and MDLinx Emergency Med. Members of OASPA. Editorial and Publishing Office: WestJEM/Depatment of Emergency Medicine, UC Irvine Health, 3800 W. Chapman Ave. Suite 3200, Orange, CA 92868, USA Office: 1-714-456-6389; Email: Editor@westjem.org Official Journal of the California Chapter of the American College of Emergency Physicians, the America College of Osteopathic Emergency Physicians, and the California Chapter of the American Academy of Emergency Medicine
Integrating Emergency Care with Population Health Indexed in MEDLINE, PubMed, and Clarivate Web of Science, Science Citation Index Expanded
Journal of Emergency Medicine:
Western Journal of Emergency Medicine:
Integrating Emergency Care with Population Health
Indexed in MEDLINE, PubMed, and Clarivate Web of Science, Science Citation Index Expanded
JOURNAL FOCUS
Emergency medicine is a specialty which closely reflects societal challenges and consequences of public policy decisions. The emergency department specifically deals with social injustice, health and economic disparities, violence, substance abuse, and disaster preparedness and response. This journal focuses on how emergency care affects the health of the community and population, and conversely, how these societal challenges affect the composition of the patient population who seek care in the emergency department. The development of better systems to provide emergency care, including technology solutions, is critical to enhancing population health.
Table of Contents
Endemic Infections
424 A Cross-Sectional Survey to Assess Awareness of Syndromic Surveillance by Clinicians Practicing Emergency Medicine: An Opportunity for Education and Collaboration
GA Haas, B Hudson-Walsh, A Malik, K Wark
431 Use of a Hotel for Homeless Individuals Requiring Quarantine While Undergoing SARS-CoV-2 Testing
LC Lin, BB McIntyre, K McIntyre, R Subramony, E Castillo, A Kreshak
436 Vaccine Acceptance During a Novel Student-Led Emergency Department COVID-19 Vaccination Program
C Eastin, B Moore, A Moulton, L Lefler, F Haydar, M Sweere, G Jones, C Sparks, A Porter, MK Allison, T Eastin
Behavioral Health
447 Association between the Affordable Care Act and Emergency Department Visits for Psychiatric Disease
A Asgharian, JB Neese, ML Thomas, AS Boyd, YM Huet
454 Agitation Management in the Emergency Department with Physical Restraints: Where Do These Patients End Up?
EL Simon, CM Smalley, M Muir, CM Mangira, R Pence, B Wahi-Singh, F Delgado, BS Fertel
461 Winter Walk
C Hazekamp, R Barnicle
463 A Case of Human Trafficking in Appalachia and What Emergency Physicians Can Learn From It
KL Jarrell, C Pulvino, A Kimmel, B Stark, H Khokhar, L Janneck, S Santen
Education
469 Political Priorities, Voting, and Political Action Committee Engagement of Emergency Medicine Trainees: A National Survey
RE Solnick, Z Jarou, C Zogg, D Boatright
479 Feedback in Medical Education: An Evidence-based Guide to Best Practices from the Council of Residency Directors in Emergency Medicine
S Natesan, J Jordan, A Sheng, G Carmelli, B Barbas, A King, K Gore, M Estes, M Gottlieb
495 Feasibility of a Multifaceted Social Emergency Medicine Curriculum for Emergency Medicine Residents
EF Shufflebarger, M Willett, SY Sontheimer, S Hicks, CA Khoury, LA Walter
Critical Care
502 Disparities in Low Tidal Volume Ventilation in the Emergency Department
M Self, B Kennis, A Lafree, CR Tainter, J Lopez, A Malhotra, T Chan, G Wardi
Policies for peer review, author instructions, conflicts of interest and human and animal subjects protections can be found online at www.westjem.com.
Emergency
Volume 24, NO. 3: May 2023 iii Western Journal of
Medicine
Western Journal of Emergency Medicine:
Integrating Emergency Care with Population Health
Indexed in MEDLINE, PubMed, and Clarivate Web of Science, Science Citation Index Expanded
Table of Contents continued
Critical Care
511 SpO2/FiO2 Ratio, ROX Index, and Modified ROX Index for Predicting High-flow Nasal Cannula Success in Emergency Patients with COVID-19: A Multicenter Validation Study
O Ruangsomboon, S Jirathanavichai, N Phanprasert, C Puchongmart, P Boonmee, N Thirawattanasoot, T Dorongthom, A Monsomboon, N Praphruetkit
Geriatrics
522 The Effect of a Coordinated Home Health and Safety Intervention on Short-term, All-Cause Emergency Department Utilization Among Frail Elderly Individuals: A Prospective Observational Study
S Bogucki, G Siddiqui, R Carter, J McGovern, J Dziura, G Gan, F Li, G Stover, DC Cone, C Brokowski, D Joseph
532 Emergency Department Length of Stay is Associated with Delirium in Older Adults
N Elder, K Tyler, B Mumma, M Maeda, D Tancredi
Health Equity
538 Characterizing Social Insecurity in a Rural North Carolina Emergency Department
E Gignac, G Dogbey, A Pevtsov, A Bass, T Nagy, A Farshori, G Brannan
547 Gaps in the Identification of Child Race and Ethnicity in a Pediatric Emergency Department
C Gutman, KC Lion, L Waidner, L Bryan, A Sizemore, C Holland, C Montero, R Fernandez
Trauma
552 Nonfatal Injuries Sustained in Mass Shootings in the US, 2012-2019: Injury Diagnosis Matrix, Incident Context, and Public Health Considerations
M Czaja, C Kraus, S Phyo, P Oliveri, D Medreos, S Mohammed, R Berkeley, T Gildea, C Hardman, B Palmer, M Whitmill, U Aluyen, J Pinnow, A Young, C Eastin, N Kester, K Works, A Pfeffer, A Keller, A Tobias, B Li, B Yorkgitis, S Saadat, MI Langdorf
566 Blood Vessel Occlusion by Layperson Audiovisual Assist Tourniquet (LAVA TQ) Compared to Combat Application Tourniquet (CAT): A Randomized Controlled Trial
C Goolsby, N Dacuyan-Faucher, K Schuler, A Lee, Amit Shah, Jeremy Cannon, Curt Kothera
Pediatrics
572 Socioeconomic Risk Factors for Pediatric Out-of-Hospital Cardiac Arrest: A Statewide Analysis
CL Kienbacher, G Wei, JM Rhodes, H Herkner, KA Williams
579 Pediatric Application of Cuffed Endotracheal Tube
J Kim, J Ahn, Y Chae
ED Workforce
588 Effects of Nurse Practitioners and Physician Assistants on Emergency Medicine Physician Resident Education
AW Phillips, JP Sites, FC Quenzer, DM Lercher
597 Effectiveness of Hospital-Directed Wellness Interventions in COVID-19: A Cross-sectional Survey
AA Cotarelo, ME McLean, N Rahman, A Mitina, B Alves, ML Kulkarni
Cardiology
605 EtCO2-plus RACA Score to Predict Outcomes after Out-of-hospital Cardiac Arrest
C Wu, T Lu, P Su, C Tsai, J Tay, M Wu, Y Yen, EH Chou, C Wang, C Huang, W Chen
Volume 24, NO. 3: May 2023 iv Western Journal of Emergency Medicine
Western Journal of Emergency Medicine:
Integrating Emergency Care with Population Health
Indexed in MEDLINE, PubMed, and Clarivate Web of Science, Science Citation Index Expanded
Table of Contents continued
Injury Prevention
615 Safe Discharge Needs Following Emergency Care for Intimate Partner Violence, Sexual Assault, and Sex Trafficking
MJ Clery, E Olsen, H Marcovitch, HGoodall, J Gentry, MA Wheatley, N Jackson, DP Evans
Technology
622 Optimal Image Gain Intensity of Point-of-Care Ultrasound When Screening for Ocular Abnormalities in The ED
M Chang, N Finney, J Baker, J Rowland, S Gupta, R Sarsour, S Saadat, JC Fox
Women’s Health
629 Emergency Department Preparedness to Care for Sexual Assault Survivors: A Nationwide Study
K Chalmers, M Hollender, L Spurr, R Parameswaran, N Dussault, J Farnan, S Oyola, K Carter
Health Outcomes
637 Evaluation of an Emergency Department Based Palliative Care Extender Program on Hospital and Patient Outcomes
KN Shankar, J Dugas, S Jaiprasert, L Nentwich, L Caruso, A Dobie, D Whalen, P Macip-Rodriguez, S Rao, SE Mitchell
644 Efficacy of Low-dose Ketamine for Control of Acute Pain in Emergency Setting: A Systematic Review and Meta-Analysis of Randomized Controlled Trials
M Ying, Y Zuo
Volume 24, NO. 3: May 2023 v Western Journal of Emergency Medicine
Western Journal of Emergency Medicine:
Integrating Emergency Care with Population Health
Indexed in MEDLINE, PubMed, and Clarivate
This open access publication would not be possible without the generous and continual financial support of our society sponsors, department and chapter subscribers.
Professional Society Sponsors
American College of Osteopathic Emergency Physicians
California American College of Emergency Physicians
Academic Department of Emergency Medicine Subscriber
Albany Medical College
Albany, NY
Allegheny Health Network
Pittsburgh, PA
American University of Beirut
Beirut, Lebanon
AMITA Health Resurrection Medical Center
Chicago, IL
Arrowhead Regional Medical Center
Colton, CA
Baylor College of Medicine
Houston, TX
Baystate Medical Center Springfield, MA
Bellevue Hospital Center New York, NY
Beth Israel Deaconess Medical Center
Boston, MA
Boston Medical Center
Boston, MA
Brigham and Women’s Hospital
Boston, MA
Brown University Providence, RI
Carl R. Darnall Army Medical Center Fort Hood, TX
Cleveland Clinic Cleveland, OH
Columbia University Vagelos New York, NY
State Chapter Subscriber
Arizona Chapter Division of the American Academy of Emergency Medicine
California Chapter Division of the American Academy of Emergency Medicine
Florida Chapter Division of the American Academy of Emergency Medicine
International Society Partners
Emergency Medicine Association of Turkey
Lebanese Academy of Emergency Medicine
Conemaugh Memorial Medical Center Johnstown, PA
Crozer-Chester Medical Center Upland, PA
Desert Regional Medical Center Palm Springs, CA
Detroit Medical Center/ Wayne State University Detroit, MI
Eastern Virginia Medical School Norfolk, VA
Einstein Healthcare Network Philadelphia, PA
Eisenhower Medical Center Rancho Mirage, CA
Emory University Atlanta, GA
Franciscan Health Carmel, IN
Geisinger Medical Center Danville, PA
Grand State Medical Center Allendale, MI
Healthpartners Institute/ Regions Hospital Minneapolis, MN
Hennepin County Medical Center Minneapolis, MN
Henry Ford Medical Center Detroit, MI
Henry Ford Wyandotte Hospital Wyandotte, MI
California Chapter Division of American Academy of Emergency Medicine
Mediterranean Academy of Emergency Medicine
INTEGRIS Health
Oklahoma City, OK
Kaiser Permenante Medical Center
San Diego, CA
Kaweah Delta Health Care District
Visalia, CA
Kennedy University Hospitals
Turnersville, NJ
Kent Hospital
Warwick, RI
Kern Medical
Bakersfield, CA
Lakeland HealthCare
St. Joseph, MI
Lehigh Valley Hospital and Health Network
Allentown, PA
Loma Linda University Medical Center
Loma Linda, CA
Louisiana State University Health Sciences Center
New Orleans, LA
Louisiana State University Shreveport
Shereveport, LA
Madigan Army Medical Center
Tacoma, WA
Maimonides Medical Center
Brooklyn, NY
Maine Medical Center
Portland, ME
Massachusetts General Hospital/Brigham and Women’s Hospital/ Harvard Medical
Boston, MA
Great Lakes Chapter Division of the American Academy of Emergency Medicine
Tennessee Chapter Division of the American Academy of Emergency Medicine
Norwegian Society for Emergency Medicine
Sociedad Argentina de Emergencias
Mayo Clinic
Jacksonville, FL
Mayo Clinic College of Medicine
Rochester, MN
Mercy Health - Hackley Campus
Muskegon, MI
Merit Health Wesley
Hattiesburg, MS
Midwestern University
Glendale, AZ
Mount Sinai School of Medicine New York, NY
New York University Langone Health
New York, NY
North Shore University Hospital
Manhasset, NY
Northwestern Medical Group
Chicago, IL
NYC Health and Hospitals/ Jacobi New York, NY
Ohio State University Medical Center
Columbus, OH
Ohio Valley Medical Center
Wheeling, WV
Oregon Health and Science University
Portland, OR
Penn State Milton S. Hershey Medical Center
Hershey, PA
Uniformed Services Chapter Division of the American Academy of Emergency Medicine
Virginia Chapter Division of the American Academy of Emergency Medicine
Sociedad Chileno Medicina Urgencia
Thai Association for Emergency Medicine
To become a WestJEM departmental sponsor, waive article processing fee, receive electronic copies for all faculty and residents, and free CME and faculty/fellow position advertisement space, please go to http://westjem.com/subscribe or contact:
Stephanie Burmeister
WestJEM Staff Liaison
Phone: 1-800-884-2236
Email: sales@westjem.org
Western Journal of Emergency Medicine vi Volume 24, NO. 3: May 2023
Web of Science, Science Citation Index Expanded
Indexed
Western Journal of Emergency Medicine:
Integrating Emergency Care with Population Health
This open access publication would not be possible without the generous and continual financial support of our society sponsors, department and chapter subscribers.
Professional Society Sponsors
American College of Osteopathic Emergency Physicians
California American College of Emergency Physicians
Academic Department of Emergency Medicine Subscriber
Prisma Health/ University of South Carolina SOM Greenville
Greenville, SC
Regions Hospital Emergency Medicine Residency Program
St. Paul, MN
Rhode Island Hospital
Providence, RI
Robert Wood Johnson University Hospital
New Brunswick, NJ
Rush University Medical Center
Chicago, IL
St. Luke’s University Health Network
Bethlehem, PA
Spectrum Health Lakeland
St. Joseph, MI
Stanford Stanford, CA
SUNY Upstate Medical University
Syracuse, NY
Temple University
Philadelphia, PA
Texas Tech University Health Sciences Center
El Paso, TX
The MetroHealth System/ Case Western Reserve University
Cleveland, OH
UMass Chan Medical School
Worcester, MA
University at Buffalo Program Buffalo, NY
State Chapter Subscriber
Arizona Chapter Division of the American Academy of Emergency Medicine
California Chapter Division of the American Academy of Emergency Medicine
Florida Chapter Division of the American Academy of Emergency Medicine
International Society Partners
Emergency Medicine Association of Turkey
Lebanese Academy of Emergency Medicine
University of Alabama Medical Center
Northport, AL
University of Alabama, Birmingham
Birmingham, AL
University of Arizona College of Medicine-Tucson
Tucson, AZ
University of California, Davis Medical Center
Sacramento, CA
University of California, Irvine
Orange, CA
University of California, Los Angeles Los Angeles, CA
University of California, San Diego
La Jolla, CA
University of California, San Francisco San Francisco, CA
UCSF Fresno Center
Fresno, CA
University of Chicago
Chicago, IL
University of Cincinnati Medical Center/ College of Medicine
Cincinnati, OH
University of Colorado Denver Denver, CO
University of Florida
Gainesville, FL
University of Florida, Jacksonville Jacksonville, FL
California Chapter Division of American Academy of Emergency Medicine
University of Illinois at Chicago
Chicago, IL
University of Iowa
Iowa City, IA
University of Louisville
Louisville, KY
University of Maryland
Baltimore, MD
University of Massachusetts
Amherst, MA
University of Michigan
Ann Arbor, MI
University of Missouri, Columbia
Columbia, MO
University of North Dakota School of Medicine and Health Sciences
Grand Forks, ND
University of Nebraska Medical Center
Omaha, NE
University of Nevada, Las Vegas
Las Vegas, NV
University of Southern Alabama
Mobile, AL
University of Southern California
Los Angeles, CA
University of Tennessee, Memphis
Memphis, TN
University of Texas, Houston Houston, TX
University of Washington
Seattle, WA
Great Lakes Chapter Division of the American Academy of Emergency Medicine
Tennessee Chapter Division of the American Academy of Emergency Medicine
Norwegian Society for Emergency Medicine
Sociedad Argentina de Emergencias
University of WashingtonHarborview Medical Center
Seattle, WA
University of Wisconsin Hospitals and Clinics
Madison, WI
UT Southwestern
Dallas, TX
Valleywise Health Medical Center
Phoenix, AZ
Virginia Commonwealth University Medical Center
Richmond, VA
Wake Forest University
Winston-Salem, NC
Wake Technical Community College
Raleigh, NC
Wayne State
Detroit, MI
Wright State University
Dayton, OH
Yale School of Medicine
New Haven, CT
Uniformed Services Chapter Division of the American Academy of Emergency Medicine
Virginia Chapter Division of the American Academy of Emergency Medicine
Sociedad Chileno Medicina Urgencia
Thai Association for Emergency Medicine
Mediterranean Academy of Emergency Medicine
To become a WestJEM departmental sponsor, waive article processing fee, receive electronic copies for all faculty and residents, and free CME and faculty/fellow position advertisement space, please go to http://westjem.com/subscribe or contact:
Stephanie Burmeister
West
JEM Staff Liaison
Phone: 1-800-884-2236
Email: sales@westjem.org
Western Journal of Emergency Medicine vii Volume 24, NO. 3: May 2023
in MEDLINE, PubMed, and Clarivate Web of Science, Science Citation Index Expanded
Education Fellowship at Eisenhower Medical Center, Rancho Mirage, CA


ABOUT THE PROGRAM
SAEM-approved Education Fellowship
Opportunities to learn in both Graduate and Undergraduate Medical Education
Offer “Training to Teach in Medicine” certificate program from Harvard Medical School

One- or two-year fellowship
Competitive salary with full-benefits from Eisenhower Health
ABOUT EISENHOWER MEDICAL CENTER
Rated among the region’s Best Hospitals by U.S. News & World Report
More than 85,000 visits per year
Advanced Primary Stroke Center, STEMI Center, Accredited Geriatric Emergency Department and Level Four Trauma Center
State-of-art medical center
50 private patient rooms
Best EMR: Epic
Three-year Emergency Medicine residency program
LIVING IN THE DESERT
Affordable cost of living
Variety of activities: hiking, shopping, dining, golfing, etc.

Within two hours from many big cities (L.A. and San Diego)
CONTACT
Wirachin Hoonpongsimanont, MD, MS
Cell: 862-216-0466 Email: wirachin@gmail.com website: gme.eisenhowerhealth.org 39000 Bob Hope Drive, Rancho Mirage, CA 92270
EisenhowerHealth.org LIVE. WORK. PLAY. PROSPER.


Please join us for the 2023 Scientific Assembly August 12-16, 2023 Washington Hilton Hotel Washington, DC Save the Date

Call for Section Editors • Behavioral Emergencies • Emergency Cardiac Care • International Medicine • Pediatric Emergencies • Public Health • Trauma Care • Ultrasound Send CV and letter of interest to Editor@WestJEM.org NEW: HEALTH EQUITY SECTION Call for Reviewers and Manuscripts Send CV and letter of interest to Editor@WestJEM.org


Call for Reviewers! Please send your CV and letter of interest to editor@westjem.org
Physician Productivity and Supervision
Kraftin E. Schreyer, MD, MBA*
Diane Kuhn, MD, PhD†
Vicki Norton, MD‡
On behalf of the American Academy of Emergency Medicine Board of Directors
Section Editor: Mark I. Langdorf, MD, MHPE
Lewis Katz School of Medicine at Temple University, Department of Emergency Medicine, Philadelphia, Pennsylvania
Indiana University School of Medicine, Department of Emergency Medicine, Indianapolis, Indiana
Florida Atlantic University, Department of Emergency Medicine, Boca Raton, Florida
Submission history: Submitted May 2, 2023; Revision received May 5, 2023; Accepted May 5, 2023 Electronically published May 9, 2023. Full text available through open access at http://escholarship.org/uc/uciem_westjem DOI 10.5811/westjem.60876
[West J Emerg Med. 2023;24(3)372–376.]
Emergency physician (EP) productivity has traditionally been measured in terms of patients per hour and has historically been estimated to be anywhere from 1.8 to 5.0, with most estimates ranging from 2.4 to 3.3.1 However, these early approximations from 20-40 years ago were derived from generalizations and individual conjecture. Furthermore, they largely failed to account for patient acuity, which has only risen since the inception of emergency medicine (EM) and even more so since the COVID-19 pandemic. Productivity has also come to be measured in other ways, which adds complexity to the original metric. The EM landscape today is very different than when those original values were proposed and, therefore, a fresh look at productivity is merited.
Productivity is closely tied to quality of care and patient safety. It is generally accepted that there is a trade-off between the number of patients evaluated per shift and the time and attention devoted to each of those patients. As more higher acuity patients are cared for during a shift, fewer overall patients can be evaluated; as more lower acuity patients are cared for during a shift, more overall patients can be evaluated. There is likely a threshold beyond which quality of care and safety are potentially sacrificed for efficiency and throughput. Determining that threshold, though, is very challenging, because EP and non-physician practitioner (NPP) productivity is influenced by a multitude of variables, many of which are constantly fluctuating. Because of the variability among these factors in all emergency departments (ED) and limited recent data, it is difficult, if not impossible, to identify a specific safe productivity threshold for EPs or NPPs.
In the following sections, we aim to outline the factors that affect productivity and supervision, and how those factors are likely to increase or decrease the number of patients that can be evaluated safely during a shift in the ED. We define productivity in terms of patients per hour evaluated during a shift in the ED. Primary productivity refers to the number of
patients seen only by an attending EP. Overall productivity includes all patients evaluated during that shift, whether independently by an attending EP or by an attending EP in conjunction with a resident physician or NPP.
To supplement the existing literature with current data, we recently conducted a survey of practicing EPs who work in diverse clinical settings for a variety of employers. The relevant results are incorporated into the following discussion.
PATIENT ACUITY
Productivity is routinely evaluated in the context of patient acuity. Higher acuity patients often require more complex thinking and decision-making, in addition to needing more resources for care. Higher acuity patients also often merit more documentation, which requires additional physician time.1,2 The additional time spent on each complex patient likely negatively impacts the overall efficiency of an attending EP. In a previous survey, academic EDs were found to have a higher rate of admission as compared to their community counterparts, suggesting that the patients are more complex. However, other markers of patient acuity, including the admission rate of patients arriving via emergency medical services and Current Procedural Terminology codes, were similar between academic and community settings, implying that the acuity mix is similar across different types of practice locations.2 Therefore, at either community or academic sites, we believe that greater numbers of higher acuity patients are associated with reduced primary and overall productivity.
While higher acuity patients generally require more treatment time, lower acuity patients can also merit additional clinician time beyond what their triage level may dictate. This may come in the form of answering questions the patient may have or reassuring patients about the absence of emergent diagnoses. Any additional time spent caring for lower acuity patients may also negatively impact productivity. However, while an increase in this patient
Western Journal of Emergency Medicine 372 Volume 24, NO.3: May 2023 Professional Society Contribution
* † ‡
subset would reduce primary productivity, it likely would have no impact on overall productivity.
Our survey found that the median number of patients per hour seen by practicing EPs, without supplementation from NPPs or resident physicians, was 2.1 patients per hour. This is lower than prior productivity estimates and is likely reflective of a patient acuity mix that now includes more higher acuity patients. However, of the respondents surveyed only twothirds felt that they were able to see that many patients per hour in a safe manner.
DOCUMENTATION
Documentation accounts for a significant portion of the time spent caring for individual patients in the ED, as it does in other clinical settings. Generally, reduced time documenting equates to more time available to see new patients, which would then lead to increased productivity.
The implementation of an electronic health record (EHR) has been shown to have mixed impacts on productivity, depending on the time the EHR has been in use. Early on, EHRs were shown to decrease productivity. Over time, however, productivity returned to baseline for the primary care practices that were studied.3 The same trajectory is likely true in EDs.
Scribes have been shown to both directly and indirectly increase physician productivity.4-6 By reducing the time required for the physician to directly document on each patient, physicians are able to see additional patients during each shift. A newer adjunct to documentation, voice recognition and dictation software, has been shown to reduce documentation time for nurses.7 Presumably, the same would hold true for physicians. Any documentation enhancement that shortens the time physicians must spend directly documenting will likely lead to an increase in both primary and overall productivity.
EMERGENCY DEPARTMENT OPERATIONS
Department flow is maintained through three critical servers: beds; clinicians; and nursing. Boarding negatively impacts EP productivity. By definition, boarding patients occupy existing ED treatment spaces and reduce the capacity of that server. Occupied beds reduce the number of available beds for new patients. When new patients arrive but cannot be bedded in treatment areas, they instead occupy the waiting room. As this scenario has unfortunately become more common, physicians are seeing and evaluating patients in waiting rooms. This practice is not ideal, but it is necessary in many settings to allow patients to receive care. Physicians cannot see as many patients if they cannot be bedded; thus, both primary productivity and overall productivity are inherently reduced. Several survey respondents confirmed that flow in their EDs has been compromised by boarding, and as a result patient safety has been jeopardized.
In many EDs, EPs have responsibilities that go beyond their usual ED duties. These include responding
to deteriorating patients or codes, staffing ED observation units, covering inpatient medical units, and accompanying ambulance transfers. The more duties a physician has beyond the ED, the less time there is to see and treat ED patients; thus, both primary productivity and overall productivity will decrease.
STAFFING
Ancillary staff are critical to maintaining ED flow. Decreased nurse staffing is one factor that may decrease productivity. With fewer nurses, another of the three key servers for ED flow is compromised, which means that fewer patients can move through the department successfully. Furthermore, the remaining nurses may carry higher patientnurse ratios, which requires them to divide their time and resources among more patients. Because of the server limitation, compounded by increased workload on the rest of the staff, EPs will not be able to see as many patients when there are nurse staffing shortages. In a nursing shortage, both primary and overall productivity would be reduced. Many survey respondents identified a shortage of nurse staffing as a barrier to providing safe patient care.
The same is true, to a lesser extent, for other ancillary staff such as patient care technicians and paramedics. While not one of the traditional ED critical servers for patient flow, non-nurse ancillary staff are adjuncts to expediting patient care and essential in many large-volume EDs. As is the case with nursing staff, the fewer additional ancillary staff who are available, the less time each patient can receive from those staff members. The less time a patient receives care from ancillary staff, the less is done to progress their care. Often that leads to a longer ED stay. Again, with shortages of nonnurse ancillary staff, both primary and overall productivity would be reduced.
EXPERIENCE
The years of practice experience of all clinicians in a supervisory relationship is expected to impact clinical productivity. Generally, more practice experience should be associated with higher levels of clinical productivity. However, this is unlikely to be a linear relationship. Among attending EPs, we expect that clinical productivity increases over the first years in unsupervised practice as physicians form practice patterns and risk tolerance. There is likely a greater increase in primary productivity compared to overall productivity, as there is an additional learning curve for supervision.
Peak primary and overall productivity is likely to be reached when EPs are comfortable in the system in which they are working and have a set of safe heuristics that allows them to operate efficiently. However, this increase in clinical productivity is unlikely to continue over a career. Attending EPs in the late stages of their career may be less productive, both individually and overall, than they were in mid-career. This is
Volume 24, NO.3: May 2023 373 Western Journal of Emergency Medicine
Schreyer et al. Physician Productivity and Supervision
likely the combination of discomfort with changing clinical practice conditions (eg, documentation changes), lower risk tolerance (as might occur after involvement in a lawsuit), and expected cognitive and physical changes with age.
For learners being supervised, more practice experience will likely correlate with increased autonomy and less supervision time needed to ensure clinical safety. Thus, a resident in their final year of training would require less supervision than an intern in the same program.
For NPPs being supervised, more practice experience in EM likely correlates with less supervision time and/or a lower level of supervision needed. The addition of NPPs has been shown to have mixed impacts on productivity. One study found that NPPs increase physician productivity, both in lowand high-acuity settings.8,9 Another found that NPPs increased productivity compared to resident trainees.6 However, a third study reported that when physicians were paired with NPPs, physician productivity decreased.8 Years of experience in EM likely impacted those results but were not fully accounted for. Independent of years of experience, however, EPs are more productive than NPPs. The Emergency Department Benchmarking Alliance typically assigns NPPs a lower productivity factor than EPs.8
A previous comprehensive survey found that attending physicians at community sites saw similar numbers of patients per hour, on average, with and without NPP coverage. However, when accounting for resident coverage at academic sites, attending EPs saw fewer patients per hour than their community counterparts.2 This implies that even though academic sites have residents that function as an extension of the attending EP, the supervisory requirement for trainees offsets the efficiency they may add. Resident supervision likely has more of a negative impact on efficiency because the supervisory requirements are more stringent vs the supervision of NPPs.2,6 In addition to EM residents, residents in other specialties are often intermediaries for consultations or admissions, which may further reduce efficiency. However, the higher level of supervision likely equates to a higher level of patient safety and lower rate of adverse events. The balance between efficiency and safety needs to be accounted for when comparing NPP and resident experience and supervision.
Our survey confirmed that more experienced NPPs increase overall physician productivity and that those NPPs with EM experience require less oversight than NPPs who have spent less time in EDs. While an increase in overall productivity would be expected with an increasing level of experience for both physician learners and NPPs, it is also likely that, with decreasing levels of experience, overall and primary productivity would be negatively impacted.
SUPERVISION
Supervising the care provided by lesser trained clinicians (both learners and NPPs) is an integral part of both academic
and community EM practice. In some practice settings, attending EPs do not see primary patients but rather devote their time to supervision of one or more clinicians.
The American Academy of Emergency Medicine (AAEM) believes that ED patients should have timely and unencumbered access to the most appropriate care led by a board-certified or board-eligible EP. The AAEM has made its position on supervision of NPPs by EPs clear in previous statements.10
Further, training of future EPs requires supervision and training of residents. The Accreditation Council for Graduate Medical Education (ACGME) has established that “[s]upervision in the setting of graduate medical education provides safe and effective care to patients; ensures each resident’s development of the skills, knowledge, and attitudes required to enter the unsupervised practice of medicine; and establishes a foundation for continued professional growth. . .Each patient must have an identifiable and appropriately credentialed and privileged attending physician. . . who is responsible and accountable for the patient’s care.” The ACGME further established that “[i]t is important that each program maintain sufficient levels of faculty staffing coverage in the Emergency Department in order to ensure adequate clinical instruction and supervision, as well as efficient, high quality clinical operations. The ACGME Review Committee uses a faculty staffing ratio of 4.0 patients per faculty hour or less as a guideline in this determination.”11,12
Overall, inadequate data is available regarding the impact of supervision and different models of supervision of residents and NPPs on EP productivity. Nonetheless, some basic principles may be expected to hold. First, the time and effort required to provide safe supervision decreases the number of patients that the attending EP can safely manage on their own (“primary patients”). Second, while the supervision of learners and the supervision of NPPs may contain overlapping features, the nature of these relationships is distinct. The clinical supervision of learners, both at the medical student and resident level, is a mentoring relationship in which the focus is on development of the learner into an independent EP. The relationship emphasizes both teaching and the provision of safe clinical care. In contrast, the clinical supervision of NPPs is centered around ensuring the provision of safe clinical care. Thus, the time and effort required for these distinct supervisory relationships is not comparable. More research in this area is an essential next step to inform policy.
The level of supervision needed in the supervisory relationship impacts attending EP productivity. Under direct supervision, which is the model expected for learners, attending EPs personally evaluate all patients. Under indirect supervision, attending EPs provide real-time guidance in patient evaluation and management but do not personally evaluate patients. In an indirect supervision model, attending EPs should have the ability to pivot to a direct supervisory role and evaluate patients if the need arises. Supervision
Western Journal of Emergency Medicine 374 Volume 24, NO.3: May 2023 Physician Productivity and Supervision Schreyer et al.
should never be performed remotely. Remote supervision does not allow for the possibility of any direct supervision. Furthermore, we believe that an independently licensed and board-certified physician should be on site at all times in EDs and that remote supervision contradicts that tenet.
The decision regarding the level of supervision (eg, direct, indirect) required for any given situation should be made by the supervising EP and not by other stakeholders, including the individual being supervised or non-clinicians. While asynchronous chart review may serve as a quality assurance (QA) or human resources function, it does not represent a form of supervision, nor does it imply a physician-patient relationship between the physician reviewing the chart and the patient receiving care from another clinician. Furthermore, the asynchronous nature of the chart review suggests that it should not impact clinical productivity. More research is needed to determine appropriate compensation for the administrative and QA work associated with asynchronous chart review. If an EP is sent the chart of a patient whose clinical care they did not supervise and the EP does not have a compensated administrative review role, they should indicate this and, when appropriate, forward the chart to their administrative leadership.
Our survey of practicing EPs evaluated current practices and opinions on safety with respect to NPP supervision. The majority of our survey respondents who supervised NPPs oversaw two at a time, although a one-to-one ratio was preferred for direct supervision. The most common model of supervision was indirect supervision. Only two-thirds of survey respondents felt that their current supervision model was safe. Of the third who did not, about half recommended a direct supervision model to ensure safe care. A third of that group recommended additional training for EM-specific NPPs. Regardless of the level of supervision, an increase in the number of clinicians that require supervision will reduce the primary productivity of a supervising attending EP. However, as those being supervised are able to see additional patients, overall productivity will likely increase. It should be expected, however, that the more supervision required, the more significant the reductions that will be seen in primary productivity, as well as in some reduction in overall productivity. Again, the balance between productivity and patient safety must be considered when evaluating supervision models.
CONCLUSION
Physician productivity is impacted by several variables in a multitude of ways. While general trends can be identified, it is difficult to establish a direct numeric relationship between a change in the variables and the resultant impact on productivity. Our survey, with a median of 2.1 patients per hour, suggests that productivity is lower than prior estimates and is likely a combination of changing patient acuity, barriers to ED flow, and staffing limitations. Our findings further suggest that direct supervision is much safer than
indirect supervision, and that the appropriate ratio for direct supervision is one EP to one NPP. While productivity can be enhanced by resident physicians and NPPs, maintaining a balance between productivity and safety must be a priority. Further exploration of the safety of supervision models and how those relate to productivity is merited. Changes to current supervision practices to optimize patient safety, while maintaining productivity, are necessary.
ACKNOWLEDGMENTS
On behalf of the American Academy of Emergency Medicine Board of Directors, the authors would like to acknowledge Joshua Davis MD, Joshua T. Bucher MD, Leon Sanchez MD, and Michael Gottlieb MD for their contributions.
Address for Correspondence: Kraftin E. Schreyer, MD, MBA, Lewis Katz School of Medicine at Temple University, Department of Emergency Medicine, 1006 Jones Hall, 1316 W. Ontario St. Philadelphia, PA 19140. Email: Kraftin.Schreyer@tuhs.temple.edu.
Conflicts of Interest: By the WestJEM article submission agreement, all authors are required to disclose all affiliations, funding sources and financial or management relationships that could be perceived as potential sources of bias. No author has professional or financial relationships with any companies that are relevant to this study. There are no conflicts of interest or sources of funding to declare.
Copyright: © 2023 Schreyer et al. This is an open access article distributed in accordance with the terms of the Creative Commons Attribution (CC BY 4.0) License. See: http://creativecommons.org/ licenses/by/4.0/
REFERENCES
1. American College of Emergency Physicians. Emergency Medicine Provider Productivity. 2009. Available at: https://www.acep.org Accessed April 12, 2023.
2. Reznek MA, Michael SS, Harbertson CA, et al. Clinical operations of academic versus non-academic emergency departments: a descriptive comparison of two large emergency department operations surveys. BMC Emerg Med. 2019;19(1):72.
3. Fleming NS, Becker ER, Culler SD, et al. The impact of electronic health records on workflow and financial measures in primary care practices. Health Serv Res. 2014;49:405-20.
4. Arya R, Salovich DM, Ohman-Strickland P, et al. Impact of scribes on performance indicators in the emergency department. Acad Emerg Med. 2010;17(5):490-4.
5. Hess JJ, Wallenstein J, Ackerman JD, et al. Scribe impacts on provider experience, operations, and teaching in an academic emergency medicine practice. West J Emerg Med 2015;16(5):602-10.
6. Stenson BA, Anderson JS, Davis SR. Staffing and provider productivity in the emergency department. Emerg Med Clin North Am. 2020;38(3):589-605.
Volume 24, NO.3: May 2023 375 Western Journal of Emergency Medicine
Schreyer et al. Physician Productivity and Supervision
7. Joseph J, Moore Z, Patton D, et al. The impact of implementing speech recognition technology on the accuracy and efficiency (time to complete) clinical documentation by nurses: a systematic review. J Clin Nurs. 2020;29)13-14):2125-37.
8. American College of Emergency Physicians. More Advanced Practice Providers Working in Emergency Departments - ACEP Now. 2017. Available at: https://www.acepnow.com/article/advancedpractice-providers-working-emergency-departments/. Accessed April 12, 2023.
9. Jeanmonod R, DelCollo J, Jeanmonod D, et al. Comparison of resident and mid-level provider productivity and patient satisfaction in an emergency department fast track. Emerg Med J. 2013;30(1):e12.
10. American Academy of Emergency Medicine. Updated Position
Statement on Non-Physician Practitioners. 2019. Available at: https:// www.aaem.org/resources/statements/position/updated-advancedpractice-providers Accessed April 12, 2023.
11. Accreditation Council for Graduate Medical Education International. Advanced Specialty Program Requirements for Graduate Medical Education in Emergency Medicine. 2022. Available at: https://www.acgme-i.org/globalassets/acgmeinternational/specialties/emergencymedicine/emergencymedicine. pdf Accessed April 12, 2023.
12. Accreditation Council for Graduate Medical Education. Common Program Requirements (Residency). 2022. Available at: www. acgme.org/globalassets/pfassets/programrequirements/ cprresidency_2022v3.pdf Accessed April 12, 2023.
Western Journal of Emergency Medicine 376 Volume 24, NO.3: May 2023
Schreyer et al.
Physician Productivity and Supervision
Improving Accessibility in the Emergency Department for Patients with Disabilities: A Qualitative Study
J. Harrison Carmichael, BA*
Kelly M. Kalagher, BS*
Martin A Reznek, MD, MBA† Payal Modi, MD, MscPH†
Section Editor: Gary Johnson, MD
University of Massachusetts, Chan Medical School, Worcester, Massachusetts University of Massachusetts, Chan Medical School, Department of Emergency Medicine, Worcester, Massachusetts
Submission history: Submitted August 15, 2022; Revision received January 31, 2023; Accepted February 17, 2023
Electronically published May 3, 2023
Full text available through open access at http://escholarship.org/uc/uciem_westjem
DOI: 10.5811/westjem.58406
Introduction: The emergency department (ED) is a critical service area for patients living with disabilities in the United States. Despite this, there is limited research on best practices from the patient experience regarding accommodation and accessibility for those with disabilities. In this study we investigate the ED experience from the perspective of patients living with physical and cognitive disability, as well as visual impairment and blindness, to better understand the barriers to accessibility in the ED for these populations.
Methods: Twelve individuals with either physical or cognitive disabilities, visual impairments or blindness were interviewed regarding their ED experiences, particularly related to accessibility. Interviews were transcribed and coded for qualitative analysis with generation of significant themes relating to accessibility in the ED.
Results: Major themes from coded analysis were as follows: 1) inadequate communication between staff and patients with visual impairments and physical disabilities; 2) the need for electronic delivery for after-visit summaries for individuals with cognitive and visual disabilities; 3) the importance of mindful listening and patience by healthcare staff; 4) the role of increased hospital support including greeters and volunteers; and 5) comprehensive training with both prehospital and hospital staff around assistive devices and services.
Conclusion: This study serves as an important first step toward improving the ED environment to ensure accessibility and inclusivity for patients presenting with various types of disabilities. Implementing specific training, policies, and infrastructure changes may improve the experiences and healthcare of this population. [West J Emerg Med. 2023;24(3)377–383.]
INTRODUCTION
An estimated 61 million adults in the United States live with disability.1 Data from the 2006-2008 Medical Expenditure Panel Survey, a US health survey representative of community-dwelling civilians, demonstrated that people living with a disability accounted for roughly 40% of annual ED visits despite representing less than a quarter of the adult population.2 Factors such as complex medical profiles, poor access to medical care, and urgency of medical needs
play important roles in contributing to the need for higher utilization among patients living with disabilities (PWD).2 Deaf/American Sign Language users and individuals living with autism are at a higher risk of using the emergency department (ED) than the general population,3,4 and adults of working age living with disabilities have higher rates of ED usage than individuals without disabilities.1
While some studies have explored the experiences of PWD in other healthcare settings such as primary care,5
Volume 24, NO.3: May 2023 377 Western Journal of Emergency Medicine
† Original Research
*
Medicaid-managed care,6 general access to healthcare,7 hospital admissions and hospital care, and even as standardized patients,8-13 no studies to our knowledge have investigated experiences specific to the ED for these patients. Additionally, the majority of qualitative studies in alternate healthcare environments were performed in other Western countries with different healthcare systems compared to the US. The lack of research investigating the ED experiences of those living with disabilities represents a large gap in understanding between ED staff and these patient populations, which comprise a significant number of ED visits each year nationwide. In this study our goal was to understand the perspectives of patients living with various forms of disability as they access care in the ED, specifically identifying barriers and potential solutions to create an inclusive, accessible, patient-centered care environment.
METHODS Study Criteria and Recruitment
From July 2021–July 2022, patients with disabilities were recruited through patient advocacy groups, advertisements on social media, contacts with local clinicians, or through word of mouth. Inclusion criteria included adults who had visited local EDs in the prior 18 months and were living with a disability including the following: significant visual impairment or vision loss; significant hearing impairment or deafness; mobility impairments; and autism or other intellectual and developmental disability. Participants were required to have access to the technology necessary for remote interviewing, such as a phone or laptop with video call capabilities. Exclusion criteria included those without the capacity to give informed consent or without the technology needed to conduct the interview. All potential participants were screened using a REDCap electronic data capture survey hosted at the University of Massachusetts to verify eligibility before scheduling an interview. This study was approved by the university’s institutional review board.
Interviews and Analysis
Semi-structured interviews were conducted by study staff via video call using Zoom (Zoom Video Communications, San Jose, CA) or a telehealth platform (Caregility. Eatontown, NJ). Interviews lasted approximately 45-60 minutes each. Participants were mailed a $50 Visa gift card for their participation.
Each interview was audio recorded with consent from the participant and transcribed by the lead author. Each transcription was then deidentified and entered into qualitative data analysis software (Dedoose, Manhattan Beach, CA),14 for storage of the data, labeling of codes, and analysis of each transcript. In the initial coding phase, we reviewed transcripts using a grounded theory framework,15 which permitted the generation of codes informed by reviewing the available data to establish the initial codebook. After this initial phase,
Population Health Research Capsule
What do we already know about this issue?
Little is known about how people with disabilities (PWD experience care in the ED. Research in other clinical contexts suggests a need for more inclusive environments.
What was the research question?
What are the experiences of PWD who have received care in the ED, and what barriers to inclusive care exist in this space?”
What was the major finding of the study?
Subjects described 1) inadequate communication between staff and patients; 2) the need for electronic delivery for after-visit summaries 3) the importance of mindful listening and patience by healthcare staff; 4) the need for increased hospital support including greeters and volunteers; and 5) comprehensive training with staff about assistive devices and services.
How does this improve population health?
We describe actionable changes that can be made to improve ED accessibility, with suggestions derived from the recommendations of PWD.
each interview transcript was then coded independently by two researchers. Throughout this process the codebook was continually updated with emerging codes derived from the data as similarities and differences between the transcript data were identified. Coding of the transcripts continued until analysis yielded no newly emerging codes, at which point it was determined that theoretical saturation had been reached. We then grouped the final codes into themes, which were refined through team discussions until the final five themes were determined.
RESULTS Participants
Twelve participants were interviewed for this study. Participants had a mean age of 62 years, with 10 participants (83%) identifying as female. Four participants (33%) identified as Black and eight participants (66%) identified as White (Table 1). All participants were English-speaking. Six participants reported living with physical disability (50%), six reported visual impairment or blindness (50%), and two reported living with cognitive disability (16%). Several participants reported living with more than one disability and were encouraged to speak about the entirety of their experience.
Western Journal of Emergency Medicine 378 Volume 24, NO.3: May 2023 Improving ED Accessibility
Patients with Disabilities Carmichael et al.
for
Themes
Five emergent themes were derived from the data. These included the following: 1) inadequate communication between staff and patients with visual impairments and physical disabilities; 2) the need for electronic delivery for after-visit summaries (AVS) for individuals with cognitive and visual disabilities;
3) the importance of mindful listening and patience by healthcare staff; 4) the role of increased hospital support services including greeters and volunteers; and 5) comprehensive training with both prehospital and hospital staff around assistive devices and services. Each of these themes is described in detail below, with specific quotes chosen that were deemed to be representative of the study results.
Inadequate communication between staff and patients with visual impairments and physical disabilities
Participants identified multiple communication gaps where staff lacked consideration when communicating with someone with a disability/impairment. Participants emphasized the importance of being properly addressed by name to help them navigate the healthcare system.
V06 – “... It was very challenging. And it’s kind of embarrassing because I’m like, ‘What? Who are you talking to?’ And they’re like, ‘Miss!’ You know like other than the person who initially brought me to the back, or put me in a stretcher or something, [she] doesn’t know that I’m blind. It gets back to what’s helpful.”
Improving ED Accessibility for Patients with Disabilities
Additionally, introductions and identification are important for situational awareness for these patients to ensure their safety and basic needs are being addressed.
V01 – “At one point some food was left for me, but I didn’t know that it had been left there… you can’t see a person’s uniform or see their little badge that identifies them as an employee or what their name is so… if it could just be part of the training and part of the culture to say ‘Hi, my name is Mary. I’m from food service. I’m leaving your tray over here to the right’ or something, that would be really helpful.”
V06 – “… ‘Are you here to harm me or help me or what?’ You know, everybody from the doctor down to the essential floor sweeper, I’d like to know who they are and what they are intending to do.”
Participants also expressed discomfort when staff did not explain a procedure or task, especially if there was intrusive physical contact without preparation. Others went on to discuss the importance of clear instructions and descriptions prior to and during imaging procedures.
V01 – “Like if someone is going to give me a shot for instance. I can’t see it coming. So, I like for the doctor to say, ‘I’m going to give you an injection; this is what it’s for. It’s going to be in your left arm. I’m going to put some alcohol on you now.’ Otherwise, it just sort of happens out of the blue without warning because I’m not seeing the doctor doing the prep work in advance… before you do anything, just tell me what it is that you’re going to do, and that’s helpful… I think that just goes to the communications piece, knowing that a patient isn’t able to see any lights or read any signs; it really has to be verbal direction from staff members.”
Furthermore, participants emphasized the importance of respecting the patient’s autonomy and asking whether a patient wants assistance before offering it or touching them.
V04 – “Very rarely do people know to say, ‘I’ve noticed that you seem to be vision impaired,’ or ‘I’ve noticed that you’re using a cane; would you like a human guide?’ You know, they either take my arm or start guiding me by pushing my shoulder along or something like that.”
Participants repeatedly expressed the need for increased staff and volunteer training around sighted-guide (or humanguide) technique. The basis of the sighted-guide technique is to enable a person who is blind or has low vision to move through an environment safely with the assistance of a guide.16
Volume 24, NO.3: May 2023 379 Western Journal of Emergency Medicine
Carmichael et al.
Characteristic Subjects n (%) Age (years) 40-49 2 (16) 50-59 2 (16) 60-69 5 (41) 70-79 3 (25) Gender Male 2 (16) Female 10 (83) Race White 8 (66) Black 4 (33) Asian 0 Other 0 Type of Disability Physical disability 6 (50) Visual impairment 6 (50) Cognitive impairment 2 (16) Total 12 (100)
Table 1. Participant demographics
V05 – “I would suggest that everyone, all the staff of the ED be trained [in sighted guide]… … And what [sighted guide] means is I would hold their elbow and then they would guide me and if there’s a step they’d say ‘step’ or ‘there’s a doorway over here.’ And not everyone is trained in that, but certainly a medical professional should be.”
For those with mobility challenges, patients face an additional barrier of navigating hallways with multiple obstructions, such as stretchers and hospital equipment that are designed for able-bodied personnel.
M14 – “When I’m having to walk with people they forget and they just keep walking and I might not be with them because I’m stuck. Like, transport often is unaware of the obstructions I’m dealing with.”
The need for electronic delivery of after-visit summaries for individuals with cognitive and visual disabilities
Participants expressed concern about the accessibility of documents they would receive in the ED, particularly related to discharge instructions or summaries.
V01 – “I think that the more forethought that a hospital can put into not only information, any information that a doctor would be distributing to a patient in the ER as a handout to take home, but also any kind of follow-up communication, it needs to be done in an accessible format.”
V05 – “My suggestion would be along with the normal whatever [after-visit summary] is given… if the instructions can be emailed… if the instructions were sent to me by email I could read them, no problem.”
Several participants shared the idea that larger print forms would be helpful for some patients with visual impairments.
V04 – [referring to discharge papers] “.. But in terms of what you go home with, it’s always pulling teeth. ‘Can you put this in large print for me?’ … And then it’s always 10 minutes of guiding them. ‘OK, you extract it and then you put it into a Word document and then you increase it to 32- point font… Stop looking at me like I’m a monster.”
The importance of mindful listening and patience by healthcare staff
Participants felt that patience was paramount when caring for PWD and appreciated more humanism in medicine. Participants emphasized human connection and keen listening.
M13 – “Sometimes I wish people would stop and
take a breath and slow down and listen to the person more. Sometimes they’re so stressed and in a hurry. I don’t know. It’s very important to me to establish a human connection and sometimes people only have, you know, ‘Get these people in and out. Move fast, move fast.’ But you’re not servicing cattle; these are humans.”
Others spoke about how their disability impacts communication, or their ability to comply with medical directions, during an encounter.
M07 – “I know everybody is busy, but patience. Because I still lose my words. So sometimes you can’t get everything out, and before you can actually answer sometimes, they’re asking you another question… maybe they think you didn’t understand. I understood what you said, I just can’t get the words out!”
M09 – “One time where I had to get in a weird position, I did get in that position, but I was limited in how fast I could get into that position. And [staff] got a little irritated that it was taking me a little longer than some of you [able-bodied people].”
Others participants requested recognition of their autonomy and lived experience as a person with a disability.
M14 – “But it’s like we need… to be listened to because we are the ones who know our equipment. We know our bodies, we know our needs. We know our overlapping medical issues. We might be there for one problem, but you’re going to end up causing a different problem if you don’t listen to me and you don’t give me my regular meds that I need at this time. So I think from that standpoint, listening to those that are disabled, especially those with complex needs, we know ourselves the best. And that’s often under-recognized in medicine. Everybody wants to talk about us without us.”
The role of increased hospital support services including greeters and volunteers
Most participants recommended more volunteer services, specifically for navigation to and from the ED.
V05 – “ I think having somebody in the ED, if I didn’t have the family member there, if I had taken a Lyft [ride-share app], then the important thing would be for someone in the ED to see that you have some disability or can’t see… If I was alone, I would hope that somebody, some member of the ED staff, could help me kind of navigate the physical ED in order to get to the point where I could call the Lyft and kind of get me to the right place.”
Western Journal of Emergency Medicine 380 Volume 24, NO.3: May 2023
Carmichael et al.
Improving ED Accessibility for Patients with Disabilities
Others noted volunteers would be helpful in meeting their basic needs such as going to the bathroom or getting comfort care items like a drink of water or warm blanket.
M07 – “So, I think that in situations like that, that’s an issue of dignity… I’m not just going to the bathroom to look in the mirror or something, I need to use the restroom, you know?... I’ve had it happen twice. Even though I was in bed the first time, I still couldn’t get anybody to take me to the restroom. So, it’s an issue of dignity?”
Comprehensive training with both prehospital and hospital staff around assistive devices and services
Participants shared that healthcare workers need to have increased training specifically around the proper use of assistive devices and services, such as wheelchairs, canes, and service animals.
M10 – “They told me to leave my cane folded up in the bag, like ‘don’t use that in [the ED]’… So they didn’t want me to use my cane or any of my devices, they didn’t want me to bring the rollator to the hospital, they didn’t want me to open the cane there, and they weren’t offering me like any other supplementary device or help, if I requested help, to get up!”
M14 – “It’s just always a technicality about everything. Automatically bring the stretcher. There’s no way to just know on a chart that goes to transport automatically to let somebody know that they’re a wheelchair user, and there’s a wheelchair to be used in some capacity … Or they would have to find a staff member willing to drive it from one building to the other. Which was always a nerve-wracking thing, in that I’ve got valuables on the chair, I don’t want to lose my chair.”
DISCUSSION
This study highlights the experience of individuals living with disabilities to understand the barriers they face in the ED. We identified five key patient-centered areas for change that are actionable and feasible for any ED to implement. Prior research on healthcare access for individuals living with disabilities used a framework centered on seven core dimensions of accessibility.17 Our qualitative study revealed the dimensions of accommodation, acceptability, and awareness to be most applicable to understanding accessibility in the ED.
Accommodation remains the central tenet to many of the barriers and challenges facing patients living with disability when they visit the ED. Areas of improvement include sightedguide training for all staff, electronic delivery of AVS, changes to patient transport policies to accommodate those with assistive devices and wheelchairs, and verbal descriptions of procedures
Improving ED Accessibility for Patients with Disabilities
and consent when working with visually impaired patients. Some participants reflected that when they requested accommodations from the healthcare staff, they felt ostracized or insulted. This finding is not unique to the ED, as prior research has found that even when accessible medical equipment is available, healthcare personnel are still hesitant to use it.18 Thus, it is important that any equipment or technology provided to improve accessibility be paired with healthcare worker training that enables personnel to feel comfortable using the equipment. Furthermore, prior studies have found that PWD desire improved accommodations for communication, navigating unfamiliar environments, and for completion of paperwork,19 all of which were concepts identified by participants in this study.
Acceptability and awareness also emerged as critical dimensions of healthcare accessibility for PWD, and analysis of these dimensions yielded results that we found to be unique to the ED. Suggestions for improving awareness and acceptability included the following: more consistent staff introductions when entering an exam room; visual reminders and signage to indicate a patient has a visual impairment; and assistance with entry, exit, and general navigation of the ED. It is our belief that improving global awareness of the needs of PWD is a unique challenge to the ED, where patients are being seen by unfamiliar clinicians and staff in an urgent context. Results of studies investigating the experiences of PWD in other fields, such as obstetrics and gynecology or primary care, have not highlighted the importance of staff introductions or signage to indicate disability.5, 20
It is likely that the pace of the ED, including rapid turnover of both patients and staff, influences the need for an improved communication infrastructure in this setting. Outside the hospital, interventions consisting of disability awareness training to improve disability awareness among members of the community have resulted in more positive emotional and cognitive attitudes toward individuals with disabilities.21 It is reasonable to believe that similar interventions conducted with hospital staff could help improve the emotional and cognitive awareness of PWD in ways that would engender a more caring and accepting environment.
The role of the ED as the catchment area that is open 24/7 has allowed it to remain accessible under other framework dimensions, including availability, geography, affordability, and timeliness. Additionally, healthcare facilities under the American Disability Act Standards for Accessible Design have created physical accommodations to ensure facilities are accessible to patients. However, this study highlights the need for more investment in staff training and expectations to ensure personnel are continuing to create an inclusive, accommodating environment for PWD.
LIMITATIONS
This study had several limitations including its lack of generalizability, as patients were recruited locally. Additionally, the interviews were conducted remotely due to the COVID-19 pandemic, which limited our ability to access PWD, especially with the additional requirement of access to
Volume 24, NO.3: May 2023 381 Western Journal of Emergency Medicine
Carmichael et al.
Improving ED Accessibility for Patients with Disabilities
video call technology. We believe this also contributed to the small sample size and to challenges recruiting participants who were deaf or living with autism or intellectual disability. Our study was limited in scope as all of our participants had a physical disability, cognitive disability, or had blindness/visual impairment with limited engagement from other communities with disability. Future study should pursue understanding the perspectives of individuals from patients with deafness/hard of hearing and autism to understand the unique barriers to care for their populations.
CONCLUSION
We investigated the experiences of individuals living with physical, cognitive, and visual impairments to better understand the barriers they face when receiving care in the ED. Common themes from interviews emerged, touching on many aspects of care that present challenges for patients living with disabilities. Improvements made to aspects of the ED relevant to these themes may lead to improved patient comfort and satisfaction, improved communication between ED staff and patients, and improved outcomes for patients living with disabilities.
Address for Correspondence: J. Harrison Carmichael Department of Emergency Medicine UMass Medical School 55 Lake Avenue North Worcester, MA 01655. Email: john.carmichael@umassmed. edu
Conflicts of Interest: By the WestJEM article submission agreement, all authors are required to disclose all affiliations, funding sources and financial or management relationships that could be perceived as potential sources of bias. No author has professional or financial relationships with any companies that are relevant to this study. There are no conflicts of interest or sources of funding to declare.
Copyright: © 2023 Carmichael et al. This is an open access article distributed in accordance with the terms of the Creative Commons Attribution (CC BY 4.0) License. See: http://creativecommons.org/ licenses/by/4.0/
REFERENCES
1. Okoro CA, Hollis ND, Cyrus AC, et al. Prevalence of disabilities and health care access by disability status and type among adults — United States, 2016. MMWR Morb Mortal Wkly Rep. 2018;67:882–7.
2. Rasch EK, Gulley SP, Chan L. Use of emergency departments among working age adults with disabilities: a problem of access and service needs. Health Serv Res. 2013;48(4):1334-58.
3. McKee MM, Winters PC, Sen A, et al. Emergency department utilization among deaf American Sign Language users. Disabil Health J. 2015;8(4):573-8.
4. Liu G, Pearl AM, Kong L, et al. A Profile on Emergency department utilization in adolescents and young adults with autism spectrum
Carmichael et al.
disorders [published correction appears in J Autism Dev Disord. 2017 Mar 23;:]. J Autism Dev Disord. 2017;47(2):347-58.
5. Walji S, Carroll JC, Haber C. Experiences of patients with a disability in receiving primary health care: using experience-based design for quality improvement. Can Fam Physician. 2021;67(7):517-24.
6. Gibbons HM, Owen R, Heller T. Perceptions of health and healthcare of people with intellectual and developmental disabilities in Medicaid managed care. Intellect Dev Disabil. 2016;54(2):94-105.
7. de Vries McClintock HF, Barg FK, Katz SP, et al. Health care experiences and perceptions among people with and without disabilities. Disabil Health J. 2016;9(1):74-82.
8. Smeltzer SC, Avery C, Haynor P. Interactions of people with disabilities and nursing staff during hospitalization. Am J Nurs 2012;112(4):30-52.
9. Howieson, J. Experiences of acute hospital services among people with mild to moderate learning disabilities. Learning Disability Practice. 2015;18(9).
10. Tuffrey-Wijne I, Goulding L, Giatras N, et al. The barriers to and enablers of providing reasonably adjusted health services to people with intellectual disabilities in acute hospitals: evidence from a mixedmethods study. BMJ Open. 2014;4(4):e004606.
11. Gibbs SM, Brown MJ, Muir WJ. The experiences of adults with intellectual disabilities and their carers in general hospitals: a focus group study. J Intellect Disabil Res. 2008;52(12):1061-77.
12. Dinsmore AP. A small-scale investigation of hospital experiences among people with a learning disability on Merseyside: speaking with patients and their carers. British J of Learning Disabil. 2012;40:20112
13. Smeltzer SC, Mariani B, Gunberg Ross J, et al. Persons with disability: their experiences as standardized patients in an undergraduate nursing program. Nurs Educ Perspect 2015;36(6):398-400.
14. Dedoose Version 9.0.17, web application for managing, analyzing, and presenting qualitative and mixed method research data. Los Angeles, CA: SocioCultural Research Consultants, LLC. 2021. Available at: www.dedoose.com. Accessed June 13, 2021
15. Chun Tie Y, Birks M, Francis K. Grounded theory research: a design framework for novice researchers. SAGE Open Med. 2019; 7:2050312118822927.
16. Sightconnection. Sighted guide technique. TechOWL. 2011. Available at: https://techowlpa.org/wp-content/uploads/2019/04/2.-SightedGuide-Techniques-04-17_2.pdf. Accessed August 16, 2022.
17. Dassah E, Aldersey H, McColl MA, et al. Factors affecting access to primary health care services for persons with disabilities in rural areas: a “best-fit” framework synthesis. Glob Health Res Policy 2018;3:36.
18. Agaronnik N, Campbell EG, Ressalam J, et al. Accessibility of medical diagnostic equipment for patients with disability: observations from physicians. Arch Phys Med Rehabil. 2019;100(11):2032-8.
19. Morris MA, Wong AA, Dorsey Holliman B, et al. Perspectives of patients with diverse disabilities regarding healthcare
Western Journal of Emergency Medicine 382 Volume 24, NO.3: May 2023
Carmichael et al.
accommodations to promote healthcare equity: a qualitative study. J Gen Intern Med. 2021;36(8):2370-7.
20. Horner-Johnson W, Klein KA, Campbell J, et al. Experiences of women with disabilities in accessing and receiving contraceptive care. J Obstet Gynecol Neonatal Nurs. 2021;50(6):732-41.
Improving ED Accessibility for Patients with Disabilities
21. Hayward L, Fragala-Pinkham M, Schneider J, et al. Examination of the short-term impact of a disability awareness training on attitudes toward people with disabilities: A community-based participatory evaluation approach. Physiother Theory Pract 2021;37(2):257-70.
Volume 24, NO.3: May 2023 383 Western Journal of Emergency Medicine
Large-scale Implementation of Fascia Iliaca Compartment Blocks in an Emergency Department
Tony Downs, MD*
Joshua Jacquet, MD*
Jno Disch, MD*
Nicholas Kolodychuk, MD†
Lance Talmage, MD‡
Jessica Krizo, PhD§
Erin L Simon, DO*
Anita Meehan, MSN||
Robert Stenberg, MD*
Section Editor: Juan F. Acosta, DO
Cleveland Clinic Akron General, Department of Emergency Medicine, Akron, Ohio Cleveland Clinic Akron General, Department of Orthopedic Surgery, Akron, Ohio Cleveland Clinic Akron General, Department of Anesthesia, Akron, Ohio Cleveland Clinic Akron General, Department of Health Sciences, Akron, Ohio Cleveland Clinic Akron General, Department of Nursing, Akron, Ohio
Submission history: Submitted September 19, 2022; Revision received January 12, 2023; Accepted February 9, 2023
Electronically published May 3, 2023
Full text available through open access at http://escholarship.org/uc/uciem_westjem
DOI: 10.5811/westjem.58793
Introduction: A robust body of literature supports the use of fascia iliaca compartment blocks (FICB) for improving outcomes in hip fractures, especially in the geriatric population. Our objective in this project was to implement consistent pre-surgical, emergency department (ED) FICB for hip fracture patients and to address barriers to implementation.
Methods: With the support of a multidisciplinary team, including orthopedic surgery and anesthesia, a core team of emergency physicians developed and implemented a departmentwide FICB training and credentialing program. The goal was to have 80% of all emergency physicians credentialed to provide pre-surgical FICB to all hip fracture patients seen in the ED who met the criteria. Following implementation, we assessed approximately one year of data on hip fracture patients presenting to the ED. We evaluated whether or not they were eligible for FICB and, if so, whether or not they received it.
Results: Emergency physician education has resulted in 86% of clinicians credentialed to perform FICB. Of 486 patients presenting for hip fracture, 295 (61%) were considered eligible for a block. Of those eligible, (54%) consented and underwent a FICB in the ED.
Conclusion: A collaborative, multidisciplinary effort is vital for success. The primary barrier to achieving a higher percentage of eligible patients receiving blocks was the deficit of emergency physicians initially credentialed. Continuing education is ongoing, including credentialing and early identification of patients eligible for the fascia iliaca compartment block. [West J Emerg Med. 2023;24(3)384–389.]
INTRODUCTION
Approximately 340,000 patients with hip fractures present to the emergency department (ED) each year.1 These occur most commonly among patients greater than 60 years of age. One challenge emergency physicians (EP) face in caring for these patients is adequate pain control. Frequently, parenteral opiates are used as the first line of pain management for hip fractures. However, the elderly population is susceptible to the
adverse effects of these medications.2 These side effects include sedation, dizziness, delirium, constipation, and respiratory depression. The use of non-steroidal anti-inflammatory drugs also has deleterious effects. They can increase the risk of gastrointestinal bleeding and exacerbate a patient’s existing renal dysfunction. In addition, the use of opioids alone is often ineffective and leads to inadequate pain management that can place the patient at a higher risk of delirium.3
Western Journal of Emergency Medicine 384 Volume 24, NO.3: May 2023 * † ‡ § || Original Research
Regional anesthesia is an effective way of controlling pain associated with hip fractures.2, 3 The fascia iliaca compartment block (FICB) has been well studied by anesthesiologists for perioperative pain relief.4 The use of ultrasound-guided FICB has been associated with reduced pain scores, shorter length of stay, lower incidence of pneumonia, and fewer opiate requirements.5, 6 Although there are many documented benefits of performing FICBs preoperatively in the ED, it can be challenging to implement this procedure into an EP’s practice. One institution used a multidisciplinary initiative to train EPs with lectures, online video-narrated instructions, and handson sessions. The hands-on sessions involved three stations focusing on visualizing anatomy using a human model and needle utilization on models and simulators. A geriatric order set for the electronic health record was also created. Despite this implementation, the study showed that just two of 77 (2.5%) eligible patients received the FICB.7
Our emergency medicine residency program at an urban, Level 1 trauma center, tertiary care hospital recently implemented FICBs into our general practice. In this study our aim was to describe the implementation of a multidisciplinary initiative to credential EPs, describe the resources used for this process and the outcomes, and to identify barriers to implementation.
METHODS
Intended Patient Demographics
Patients included were adults who presented to the ED with femoral neck fractures, intertrochanteric fractures, or femoral shaft fractures from January 1–December 17, 2020. Patients were excluded if they had infection over the site, prior vascular surgery to the inguinal region, allergy to the anesthetic, clinical signs of femoral nerve injury or vascular injury, open fracture, polytrauma (per clinician discretion), or were on anticoagulants or antiplatelets such as warfarin (with international normalized ratio >1.4), ticagrelor, apixaban, rivaroxaban, dabigatran, and clopidogrel.
Approval Process
Emergency physicians must be credentialed to perform nerve blocks. This process was implemented and is standard of care for patients with hip fractures. Therefore, no institutional research board approval for patient enrollment was required. Prior to implementation, while there was a rare block performed by ultrasound faculty, there was no consistent use of this procedure. The ED team consulted the institution’s ethics committee to determine how to obtain consent from patients who were unable to consent to the procedure and when challenges arose in obtaining consent while patients were in the ED. The institution’s ethics committee and ED leadership determined that for patients unable to consent to the FICB procedure, attempts would be made and documented to reach out to the patient’s healthcare power of attorney. If unable to consent, the block would be deemed emergent for this time-sensitive procedure.
Population Health Research Capsule
What do we already know about this issue? Fascia iliac compartment blocks (FICB) are a safe procedure within the skillset of emergency physicians to improve clinical outcomes.
What was the research question? What methods can be used to optimize a largescale implementation of FICBs for patients with hip fractures?
What was the major finding of the study? Of eligible patients, 54% received a FICB. At end of the study period, 86% of emergency physicians were credentialed.
How does this improve population health? Expanding access to FICBs allows more patients to experience the benefits including reduced pain, shorter length of stay, and theoretical decrease in delirium.
Implementation
Initially, a core group of EPs (three ultrasound faculty and one vice chair) and an anesthesiologist served as the team for implementing the FICB in the ED. A hospital-wide multidisciplinary group was also created to evaluate the care of patients with hip fractures. A proposal was drafted (Figure 1), and then a FICB protocol was developed and summarized into a one-page document that functioned as a reference guide for the procedure (Figure 2).
Once the protocol was in place, representatives from the other departments (orthopedic surgery, anesthesia, and nursing) formed an expert panel to develop a consensus on how the block would be implemented and what guidelines would be instituted. Nursing protocols (Figure 3), as well as documents for quality assurance (Figure 4) and assessing clinical competency (Figure 5), were drafted. References (Figure 6) and post-block instruction (Figure 7) are also provided.
Addressing Barriers to Implementation
Measures were taken to minimize barriers to implementation of the FICB, encourage use, and prevent delays in care. These included protocols coordinated with ED pharmacists to ensure anesthetic (40 milliliters [mL] 0.25% bupivacaine) would be stocked. Information technology (IT) developed an order set for EPs. The ED nursing leadership assembled kits in the ED, which included chlorhexidine swabs, a nerve block needle, a large sterile transparent dressing, an 18-gauge drawing needle, two 20-mL syringes for drawing anesthetic, a colored, post-
Volume 24, NO.3: May 2023 385 Western Journal of Emergency Medicine Downs et al. Large-scale Implementation of FICB in an ED
Goal:
To establish a protocol for performing fascia iliaca blocks in the emergency department in collaboration with anesthesiology and minimize practice variation by providing guidelines for consistent practice.
Why:
In light of the opiate epidemic, regional pain control is becoming a key alternative to narcotic pain medications. The literature for regional anesthesia for hip fractures has grown markedly over the last decade. It has been shown to improve pain control, minimize opiate use, and reduce rates of delirium/pneumonia. This block has also been performed safely and effectively by emergency clinicians
Nerve Block Cart:
• Medications (stocked by pharmacy. Order and pull out of cart):
o Lidocaine
▪ Onset of action ~30 minutes with a duration of 30-120 minutes
o Bupivacaine
▪ Onset of action ~30 minutes with a duration of 2-8 hours
o Ropivacaine
▪ Onset of action ~15 30 minutes with a duration of 5-8 hours.
o Chloroprocaine
▪ Onset of action ~ 6 12 minutes with a duration of 30-60 minutes
• Stock into a bag:
o 1 - 3mL syringe
o 2 - 20mL syringes
o 1 - 10mL saline flush
o 2 - gel packets
o 2 - Chlorhexidine swabs
o 1 - 25Ga x 1" needle
o 1 - 18Ga Blunt drawing needle
o 1 - Pajunk 10cm Nerve Block Needle
o 1 - Large Tegaderm
o 1 - body marking pen
o 1 - packet of papers (Universal Protocol Sheet, Block Sheet, Supplies list)
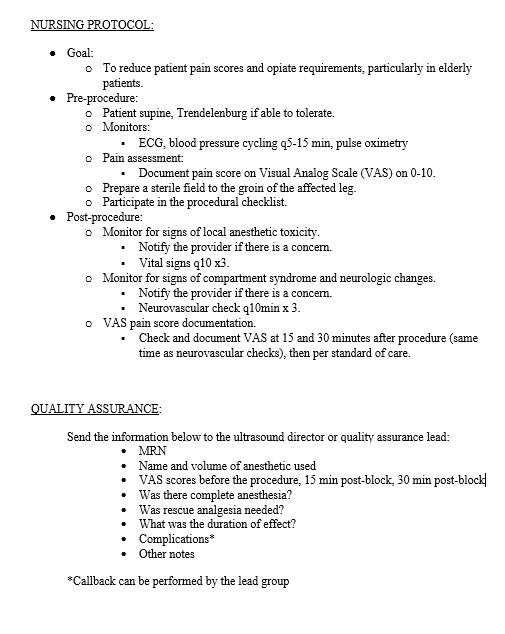
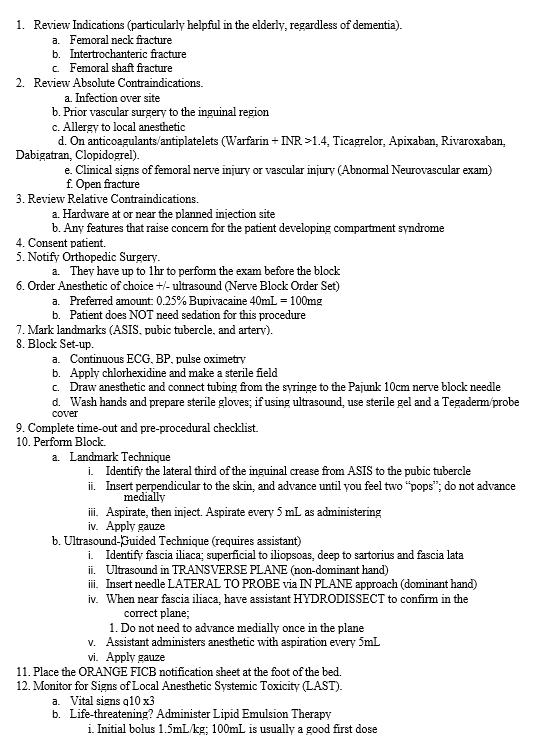
block instruction sheet to remain on the patient’s bed (Figure 7), and a body-marking pen. The ED also purchased 22-gauge 50 millimeter (mm) and 100 mm SonoPlex II Facet nerve block needles (Pajun GMbH Mediziatechnologie, Geisengen, Germany). The Department of Anesthesia was already using these needles for FICBs. These needles provide documented improvement of visualization under ultrasound and have a better safety profile around neurovascular structures.8
There is also the challenge of physicians who did not train with ultrasound feeling uncomfortable with the ultrasoundbased approach, identifying the fascia iliaca and then subsequently performing an in-plane approach. One of the means used to mitigate this was including the landmark-based approach. This provides a faster set-up, is more manageable with just one person and, as implied, does not use ultrasound.
Training and Procedural Competence
Procedural competence was determined using expert consensus by an anesthesiologist, the ED chair, the emergency ultrasound director, and the assistant emergency ultrasound director to be adequate after five successful supervised FICBs with a minimum of two live FICBs (allowing for ≤3 FICBs on
Western Journal of Emergency Medicine 386 Volume 24, NO.3: May 2023
Implementation
in an ED Downs et al.
Large-scale
of FICB
Figure 1. Initial fascia iliaca compartment block implementation proposal prepared for administration. IV, intravenous; NS, normal saline.
Figure 2. One-page reference guide for fascia iliaca compartment block procedures. INR, international normalized ratio; hr, hour; mL, milliliter; mg, milligram.
Figure 3. Protocol participation in fascia iliaca compartment blocks for nursing staff. ECG, electrocardiogram; MRN, medical record number.
a simulator). These were tracked and documented on the FICB competency worksheet. Initially, the core group of EPs became credentialed by performing blocks with anesthesia in the postanesthesia care unit.
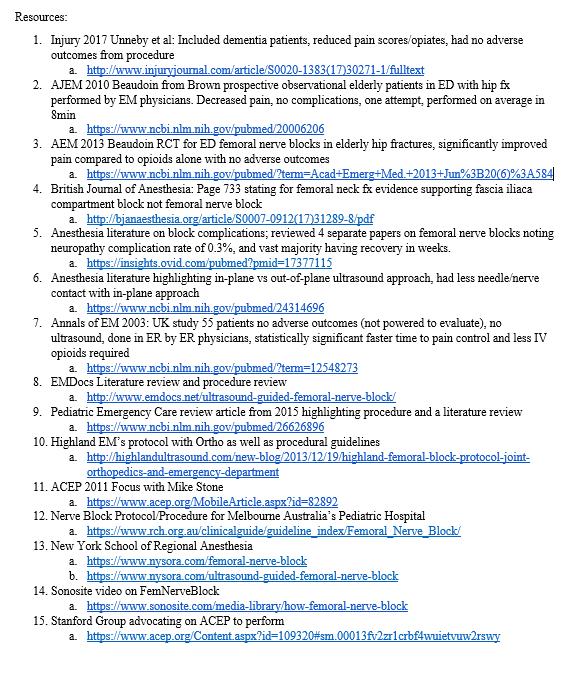
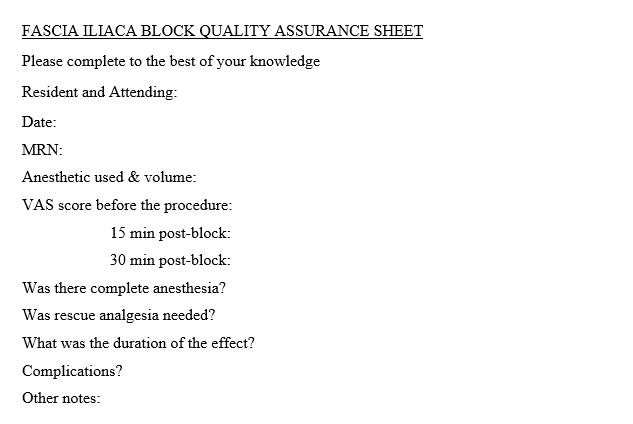
A program consisting of didactics (live or online lecture), a review of the ED FICB protocol, and a website were developed for training. The FICB simulator, a Simulab Regional Anesthesia Femoral Training Package, (Simulab Corporation, Seattle, WA) was purchased to implement the FICB training program and develop competency. The simulator was securely stored in the ED to be easily accessed while physicians were on shift. Due to the complexity of scheduling and coronavirus 2019, no formal, in-person course was done.
All staff EPs were provided the opportunity to become credentialed in performing FICBs, and their successful blocks were signed off by the four credentialed EPs or the anesthesiologist. Once a staff physician was credentialed, they could supervise other physicians (employing the “teach the teacher” model) and sign off on performances of a successful supervised FICB. All levels of emergency resident physicians were trained in this procedure and were able to perform a FICB under the direct supervision of a credentialed attending EP. In addition, in conjunction with the departments of anesthesia and orthopedic surgery, a core group of orthopedic surgery resident physicians were also credentialed
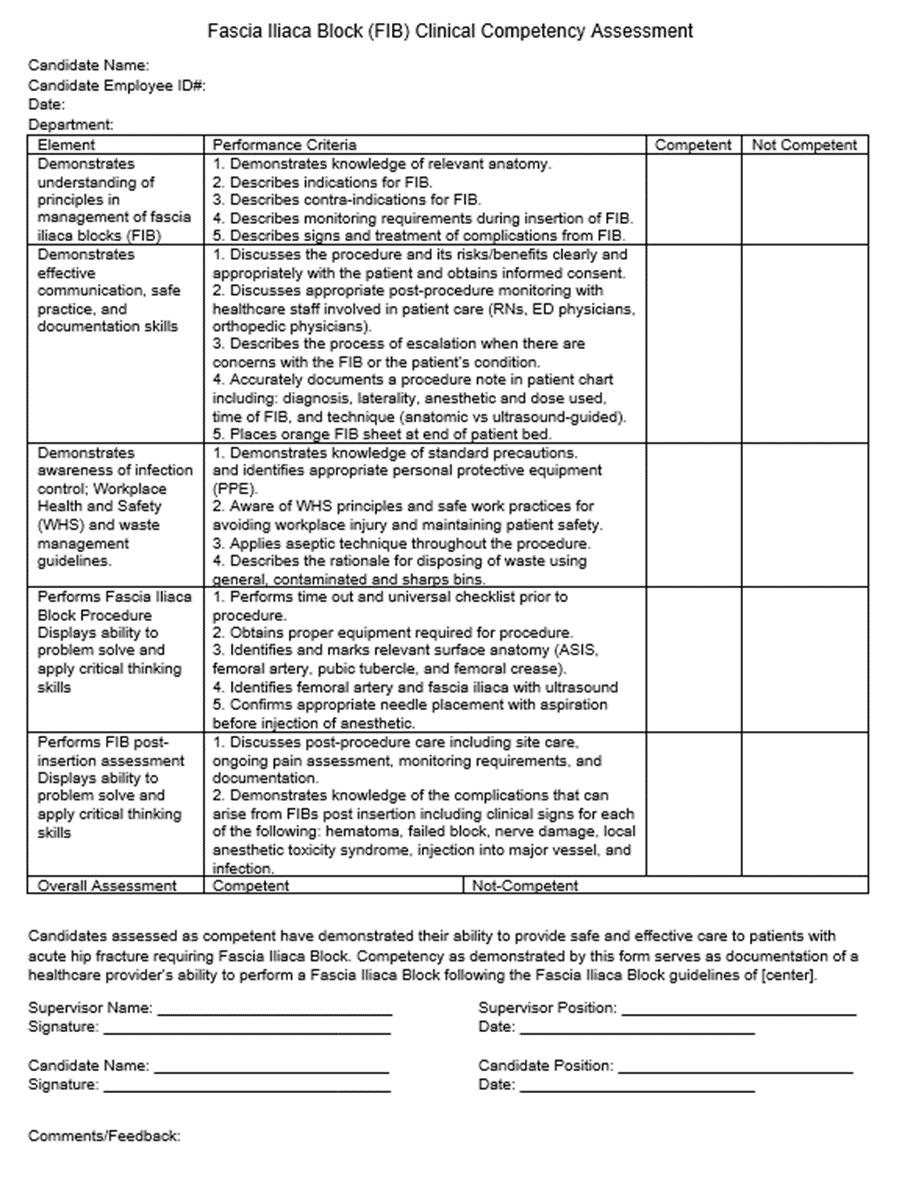
Volume 24, NO.3: May 2023 387 Western Journal of Emergency Medicine Downs et al. Large-scale Implementation of FICB in an ED
Figure 4. Documentation of fascia iliaca compartment block information to be submitted for continued quality assurance. MRN, medical record number; VAS, visual analog scale
Figure 5. Process for documentation of clinical competency for emergency medicine providers.
Figure 6. Resources used to develop fascia iliac block protocol in the emergency department.
at the same time to enhance the number of patients receiving FICB in the ED.
Throughout the process, there was encouragement by the initial core group of EPs to increase the number of credentialed clinicians performing the procedure. This was done through educational spaced repetition (an educational method to improve retention that uses a repeated review of content at different time intervals) at weekly emergency medicine conference, through access to online and written training materials, and through email communication detailing where staff physicians were in the credentialing process.13 Departmental statistics on the percentage of eligible patients who received the nerve block were also communicated to EPs.
Chart Review, Data Collection, and Data Analysis
The institutional research review board approved a review of patient charts and granted a waiver of consent due to its minimal risk. Data on all patients who presented to the ED and were diagnosed with a hip fracture (as defined above) were collected as part of a QI program within the institution and used for this evaluation. Data abstracted included the date of presentation, whether the patient received a block in the ED, and whether the patient had a contraindication for a FICB. We used descriptive statistics to determine the percentages of patients eligible for and receiving the block.
RESULTS
From January 1–December 17, 2020, 485 patients in the ED had a femoral neck fracture, intertrochanteric fracture, or femoral shaft fracture confirmed with radiographic imaging. Of the patients who presented to the ED, 295 (61%) had no contraindications to receiving a FICB. Compartment blocks were performed on 160/ 295 (54%) eligible patients after obtaining written informed consent. A total of 37 EPs (86%) are certified to perform the FICBs in the ED. These physicians can perform FICBs independently and supervise other physicians performing FICBs in the ED. During the early phases of implementation, the blocks were also completed by orthopedic surgeons consulted to the ED.
DISCUSSION
Numerous studies have shown FICB to be a safe and effective means of pain reduction in patients with
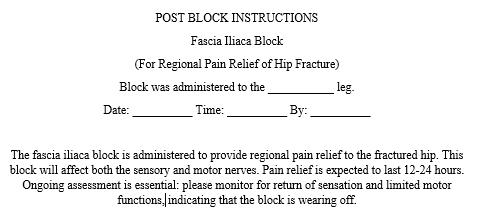
hip fractures.6,9,10 Anesthesia and orthopedic surgery have traditionally administered these blocks during the perioperative period. However, EPs can perform the FICB after a standardized training program.9 Challenges arise with the implementation of new procedures in a hospital system, and barriers to changes in patient management can occur.11
We used an interdisciplinary collaboration between anesthesia, orthopedic surgery, nursing, pharmacy, and IT to assist in implementing this procedure. Most EDs have not employed this type of collaboration regarding ultrasound-guided regional anesthesia.11 We found collaboration was fundamental for credentialing physicians caring for patients with hip fractures in the ED and optimizing the number of patients receiving blocks.
Initially, we had a goal of credentialing 95% of EPs to perform the block, but we did not reach this percentage within this timeframe. Other institutions have reported this challenge.11 Increasing the number of credentialed clinicians likely increases the number of blocks provided to eligible patients in the ED. There are multiple considerations on how to improve the number of credentialed clinicians: incentivizing (including monetarily) physicians to become credentialed and perform the FICBs, making credentialed clinicians available 24/7 to supervise and sign off on uncredentialed clinicians, paying physicians to come in off-shift for training, developing a hospital-wide nerve block team, developing a hospital-approved video teleconference for supervision, and requiring all physicians to become credentialed.12 One of the most effective pieces for credentialing was having the simulator easily accessible in the ED to help increase comfort in the moment and sign physicians off when time was found in the department or at the end of shift.
There are significant opportunities for future research. There remain opportunities to optimize the most efficient and cost-effective means to implement such procedures. As modern pain control in the ED evolves, there are other blocks to explore in the hip, such as pericapsular nerve blocks,13 and elsewhere in the body such as erector spinae blocks for visceral truncal pain or brachial plexus. We did find that the established safety profile and familiar anatomy of the fascia iliaca block function as a stepping stone to grow comfortable with regional anesthesia and explore more opportunities to better manage our patients’ pain.
When developing a FICB program, using the ethics committee and having a QI process is important. Every ultrasound-guided FICB was reviewed, with feedback given to the performing clinician via our usual departmental pointof-care ultrasound quality assurance (QA) processes at our institution. Including the QA/QI component of care assists the implementation and ongoing operations related to delivering FICBs in the ED.
LIMITATIONS
A variety of factors potentially limit the success of this implementation. This process was implemented at a tertiary trauma center with in-house access to all necessary specialties.
Western Journal of Emergency Medicine 388 Volume 24, NO.3: May 2023 Large-scale Implementation of FICB in an ED Downs et al.
Figure 7. Instructions to be left on the bed of the patient following the block.
Downs
Centers that see fewer high acuity patients may not receive patients with hip fractures or may transfer them to higher levels of care. This can make having the numbers needed for physician credentialing a challenge. This was also performed in a higher resource setting, limiting generalizability to other environments such as a community hospital with fewer resources and no learners. The landmark-based approach does offer a potentially more feasible option in some of these environments, including but not limited to time, staff, and equipment requirements.
CONCLUSION
Our experience shows that within approximately one year of implementation it is possible to significantly increase utilization of the fascia iliaca compartment block in ED patients with a documented hip fracture. Our capture of 61% of eligible patients in this period is notably higher than previously documented implementation protocols. We believe the fundamental components of successful implementation at our institution included multidisciplinary collaboration, ED leadership support, a core group of emergency physicians leading the FICB program, material and educational support for the training process that provides spaced repetition in training and communication, and hospital-specific QA/QI processes that bolster continuation of the implemented protocols. Due to the success of this project, we have expanded our program to freestanding EDs and have started to use this as a platform for other nerve blocks and associated research.
REFERENCES
1. Bhatti NS. Hip fracture: background, epidemiology, functional anatomy. 2019. Available at: https://emedicine.medscape.com/ article/87043-overview#a6. Accessed July 31, 2020.
2. Falyar C, Tola D. Ultrasound-guided fascia iliaca blocks in the emergency department. Geriatr Nur (Lond) . 2019;40(4):441-4.
3. Godoy Monzon D, Iserson KV, Vazquez JA. Single fascia iliaca compartment block for post-hip fracture pain relief. J Emerg Med 2007;32(3):257-62.
4. Groot L, Dijksman LM, Simons MP, et al. Single fascia iliaca compartment block is safe and effective for emergency pain relief in hip-fracture patients. West J Emerg Med . 2015;16(7):1188-93.
5. Cooper AL, Nagree Y, Goudie A, et al. Ultrasound-guided femoral nerve blocks are not superior to ultrasound-guided fascia iliaca blocks for fractured neck of femur. Emerg Med Australas 2019;31(3):393-8.
6. Leeper AD, Brandon PT, Morgan AVM, et al. Fascia iliaca compartment block reduces morphine requirement pre-operatively for patients with fractured neck of femur. Eur J Trauma Emerg Surg . 2012;38(6):673-7.
7. Wilson J, Maloney K, Bookman K, et al. Training emergency physicians in ultrasound-guided fascia iliaca compartment blocks: lessons in change management. Cureus . 2019;11(5):e4773.
8. Deam RK, Kluger R, Barrington MJ, et al. Investigation of a new echogenic needle for use with ultrasound peripheral nerve blocks. Anaesth Intensive Care . 2007;35(4):582-6.
9. Herring AA. Bringing ultrasound-guided regional anesthesia to emergency medicine. AEM Educ Train . 2017;1(2):165-8.
Address for Correspondence: Jessica Krizo, PhD, Cleveland Clinic Akron General, Department of Health Sciences, Department of Research, 1 Akron General Avenue, Akron, OH 44307. Email: krizoj@ccf.org.
Conflicts of Interest: By the WestJEM article submission agreement, all authors are required to disclose all affiliations, funding sources and financial or management relationships that could be perceived as potential sources of bias. No author has professional or financial relationships with any companies that are relevant to this study. There are no conflicts of interest or sources of funding to declare.
Copyright: © 2023 Downs et al. This is an open access article distributed in accordance with the terms of the Creative Commons Attribution (CC BY 4.0) License. See: http://creativecommons.org/ licenses/by/4.0/
10. Reavley P, Montgomery AA, Smith JE, et al. Randomised trial of the fascia iliaca block versus the “3-in-1” block for femoral neck fractures in the emergency department. Emerg Med J 2015;32(9):685-9.
11. Wilson CL, Chung K, Fong T. Challenges and variations in emergency medicine residency training of ultrasound-guided regional anesthesia techniques. AEM Educ Train. 2017;1(2):158-64.
12. Barrow JM, Annamaraju P, Toney-Butler TJ. Change Management. 2020. Available at: http://www.ncbi.nlm.nih.gov/books/ NBK459380/. Accessed November 30, 2020.
13. Fahey A, Cripps E, Ng A, et al. Pericapsular nerve group block for hip fracture is feasible, safe and effective in the emergency department: a prospective observational comparative cohort study. Emerg Med Australas. 2022;34(6):884-91.
Volume 24, NO.3: May 2023 389 Western Journal of Emergency Medicine
et al. Large-scale Implementation of FICB in an ED
Returns After Discharge From the Emergency Department Observation Unit:
Daniel Berger, BS*
Steven King, BS*
Catherine Caldwell, BS*
Erik F. Soto, MD†
Andrew Chambers, DO†
Susan Boehmer, MA†
Ravindra Gopaul, MD, MBA, MPH†
Section Editor: Gary Johnson, MD
Who, What, When, and Why?
Pennsylvania State University College of Medicine, Hershey, Pennsylvania
Penn State Health Milton S. Hershey Medical Center, Department of Emergency Medicine, Hershey, Pennsylvania
Submission history: Submitted September 27, 2022; Revision received February 22, 2023; Accepted March 7, 2023
Electronically published May 3, 2023
Full text available through open access at http://escholarship.org/uc/uciem_westjem
DOI: 10.5811/westjem.59023
Introduction: The number of emergency department observation units (EDOU) and observation stays has continued to increase. Despite this, there is limited data on the characteristics of patients who return unexpectedly to the ED after EDOU discharge.
Methods: We identified the charts of all patients who were admitted to the EDOU of an academic medical center between January 2018–June 2020 and had a return to the ED within 14 days of discharge from the EDOU. Patients were excluded if they were admitted to the hospital from the EDOU, left against medical advice, or died in the EDOU. We manually extracted selected demographic factors, comorbidities, and healthcare utilization data from the charts. Physician reviewers identified return visits thought to be related to the index visit or potentially avoidable.
Results: During the study period, there were 176,471 ED visits, 4,179 admissions to the EDOU, and 333 return visits to the ED within 14 days from discharge from the EDOU, representing 9.4% of all patients discharged from the EDOU. We identified a higher rate of return for patients treated for asthma and lower rates of return for patients treated for chest pain or syncope than the overall return rate. Physician reviewers determined that 64.6% of unplanned returns were related to the index visit, and 4.5% were potentially avoidable. Of potentially avoidable visits, 53.3% occurred within 48 hours of discharge, supporting the use of this period as a potential quality metric. While there was no significant difference in the percentage of related return visits between males and females, there was a higher rate of potentially avoidable visits for male patients.
Conclusion: This study adds to the limited body of literature on EDOU returns, finding an overall return rate of under 10%, with about two-thirds of returns determined to be related to the index visit and <5% considered to be potentially avoidable. [West J Emerg Med. 2023;24(3)390–395.]
INTRODUCTION
Emergency department observation units (EDOU) provide outpatient observation services for patients who do not meet inpatient criteria but still require additional care before they can be safely discharged from the ED. These units have an average length of stay (LOS) of 10 hours per patient and are
capable of caring for 5-10% of ED volume.1 On average, 80% of EDOU patients can be safely discharged, while the remaining 20% will be upgraded to inpatient status.1
There are four types of observation units (Figure 1). Type 1 units are the most structured, with care governed by specific protocols and provided within a designated area. Type 2 units use
Western Journal of Emergency Medicine 390 Volume 24, NO.3: May 2023 * † Original Research
a designated area but do not have specific protocols. Type 3 units use specific protocols but lack a designated observation area. Type 4 units lack both protocols and a designated area.2 Type 1 units have been shown to perform best, resulting in shorter LOS, lower rates of admission, and better clinical outcomes.2 EDOUs have also been reported to improve patient satisfaction.3
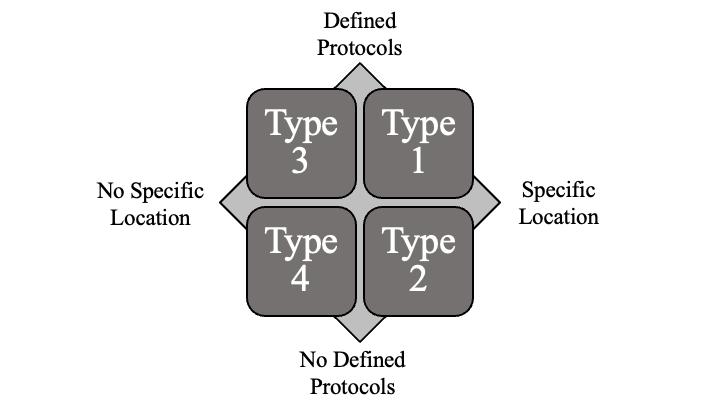
While EDOUs have existed since the 1960s, the number of observation stays resulting from ED visits has significantly grown.2 From 2001 to 2008, observation stays increased over 360%, from 0.6% of ED visits in 2001 to 1.9% in 2008.4 By 2008, over 34% of EDs had an EDOU, 56% of which were under ED administrative control.4 Observation units are associated with reduced cost, with a 27-42% lower cost in a Type 1 unit compared to a similar inpatient stay.2,5 A 2012 study estimated that if all hospitals had an EDOU, over 2.4 million inpatient visits could be avoided, saving 3.1 billion dollars annually.5 If these units were all Type 1 units, potential savings could be up to 8.5 billion dollars annually.2
However, there is limited research about the rate of unplanned returns to the ED (colloquially known as “bouncebacks”) of patients discharged from observation units. Although some studies have analyzed return visits for specific conditions, few have examined overall rates of return or compared the return rates for different complaints. The primary outcome of this paper was to describe demographic characteristics and complaints associated with higher rates of return compared to EDOU rates at large. Secondary outcomes included approximate time-to-return for return visits that were related to the initial EDOU stay or considered potentially avoidable.
METHODS
The charts of all patients admitted to the EDOU of an academic medical center between January 2018 –June 2020 were exported from the electronic health record (Cerner Corporation, Kansas City, MO) into Microsoft Excel (Microsoft Corporation, Redmond, WA). Our Type 1 EDOU is staffed with advanced practice providers (APP) and supervised by an attending physician. A list of EDOU protocols is available in Appendix 1. All patients who returned to the ED within 14
Population Health Research Capsule
What do we already know about this issue? Use of emergency department observation units (EDOU) is increasing. However, research on unplanned returns to the ED after discharge is limited.
What was the research question? We aimed to identify patient demographics or diagnoses associated with higher rates of return after discharge.
What was the major finding of the study? Our return rate was 9.42% (CI 8.45-10.38%), with 64.6% of returns related to the index visit and 4.5% potentially avoidable.
How does this improve population health? Greater understanding of rates and reasons for return visits can inform how to reduce unplanned returns after discharge from the EDOU.
days of discharge from the EDOU were identified. We excluded patients if they were admitted to the hospital from the EDOU, left against medical advice, or died in the EDOU.
Selected demographic factors, comorbidities, and healthcare utilization data were manually extracted from the charts. The EDOU medical director then sorted the data into categories by treatment protocol. When patients had multiple complaints, they were categorized under the primary complaint protocol. Once charts were sorted, two blinded emergency physicians reviewed the patients’ charts. Using their clinical judgment, they determined whether the return ED visit was related to the original EDOU visit (i.e., the same complaint) and whether it could have potentially been avoided by actions taken during the EDOU admission. A third physician reviewed and adjudicated any disagreements between the other reviewers.
A report was generated for all EDOU patients containing each visit’s diagnosis and treatment plan. We manually coded each unique pairing into the appropriate treatment protocol category, with codes then applied in bulk to the duplicate pairings. We used visits grouped by EDOU protocol when calculating the rate of related and potentially avoidable visits, whereas visits sorted by diagnosis were used to calculate return rates by complaint. Adult and pediatric patients were split into subpopulations, as different protocols were used for patients <18 years. Additionally, we compiled a report of the age and gender of all patients treated in the ED during the same period. The remaining ED and EDOU records for patients who did not return during the study period served as a comparison population.
Volume 24, NO.3: May 2023 391 Western Journal of Emergency Medicine Berger et al. Bouncebacks to the Emergency Department Observation Unit
Figure 1. Types of emergency department observation units.
We performed statistical analysis using SAS version 9.4 (SAS Institute Inc., Cary, NC). We generated descriptive statistics and used chi-square and Fisher exact tests to identify statistically significant differences within the return population. For each complaint, we calculated the rate of return with 95% confidence interval (CI).
RESULTS
ED and EDOU Visits
Between the opening of the EDOU in January 2018 and the time of data collection in June 2020, there were 176,471 ED visits, of which 43,224 (24.5%) resulted in hospital admissions. A total of 2,289 (1.3%) patients left against medical advice or without being seen; 312 (0.2%) patients died; 126,134 (71.5%) were discharged; and 4,179 (2.4%) were admitted to the EDOU. Of the 4,179 EDOU visits, 621 (14.9%) patients were admitted to the hospital, 21 (0.5%) left during treatment or against medical advice, one died, and 3,536 (84.6%) were successfully treated and discharged. Of those 3,536 patients, 333 had a return visit to the ED within 14 days of discharge from the EDOU, representing 9.4% of all patients discharged from the EDOU and 8.0% of all patients ever admitted to the EDOU. Of these 333 return visits, 215 (64.6%) were determined by two physician-reviewers to be related to the index visit and 15 (7.0% of related returns, 4.5% of all returns) were determined to have been potentially avoidable. A flowchart outlining this process is shown in Figure 2.
Rate of Returns
The overall rate of returns was 9.42% (CI 8.45-10.38%). The return rate among adult patients was 9.74% (CI 8.72-10.76%), compared with 5.67% (CI 3.28-8.37%) among pediatric patients. Table 1 shows the most common adult complaints for EDOU admission and the return rate for each complaint. The most
department observation unit; GI, gastrointestinal; UTI, urinary tract infection.
common reasons for adult EDOU admissions were for chest pain (18.9%), cellulitis (11.2%), dehydration (9.3%), and abdominal pain (7.4%). The rate of return for patients treated for asthma (17.5%; CI 10.7-24.3%) was higher than the overall return rate. The rate of return for patients treated for chest pain (6.5%; CI 4.6-8.3%) or syncope (5.1%; CI 2.2-8.2%) was lower than the overall return rate. A complete list of adult return rates is available in Appendix 2.
The most common complaints treated in the EDOU for pediatric patients were bronchiolitis (19.4% of pediatric EDOU patients; 1.5% of all EDOU patients), dehydration (17.8% of pediatric EDOU patients; 1.4% of all EDOU patients), and asthma (17.2% of pediatric EDOU patients; 1.3% of all EDOU patients) (Table 2). There were no pediatric return rates for any specific complaint greater than the overall pediatric return rate. No pediatric patients who were treated for abdominal pain (10) or pyelonephritis (6) returned during the study period. A complete list of pediatric return rates is available in Appendix 2.
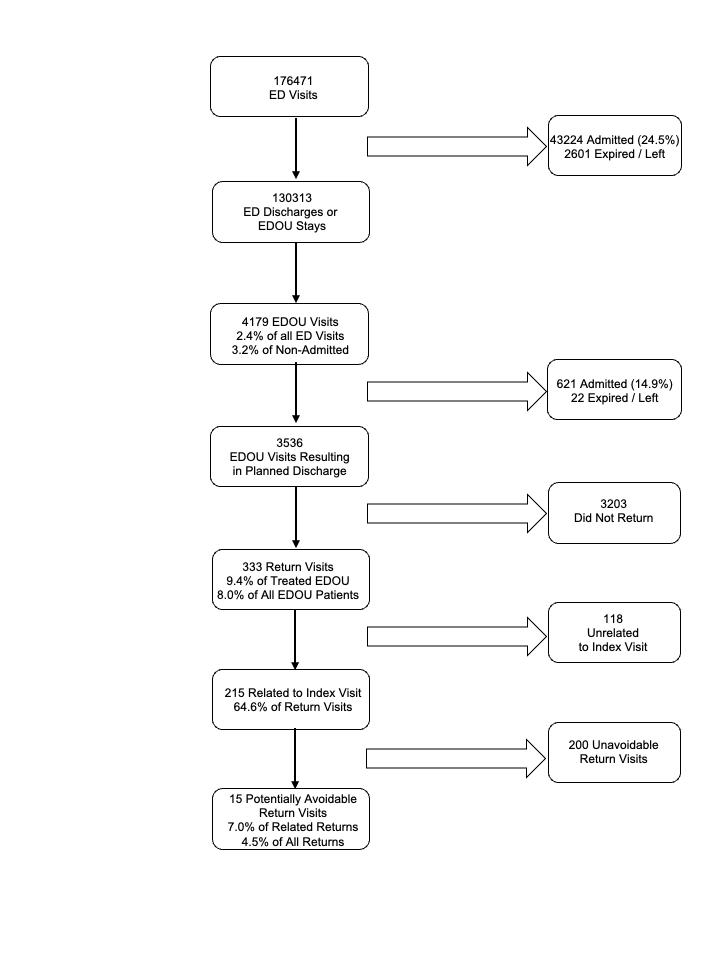
Characteristics of the Return Population
The study population was overwhelmingly White (86.2%) and English-speaking (97%). Compared with males, females were less likely to be married (36.8% vs 53.1%; P=.003) and more likely to be separated or divorced (24.5% vs 16.4%;
Western Journal of Emergency Medicine 392 Volume 24, NO.3: May 2023
Berger et al. Complaint N (%) of EDOU admissions Return visits N (%; 95% CI) Chest pain 667 (18.86) 43 (6.45%; 4.58-8.31) Cellulitis 395 (11.17) 35 (8.86%; 6.06-11.66) Dehydration 330 (9.33) 33 (10.00%; 6.76-13.24) Abdominal pain 262 (7.41) 33 (12.60%; 8.58-16.61) Ambulatory dysfunction 234 (6.62) 27 (11.54%; 7.44-15.63) Syncope 196 (5.54) 10 (5.10%; 2.20-8.18) UTI 139 (3.93) 13 (9.35%; 4.51-14.19) Asthma 120 (3.39) 21 (17.5%; 10.7-24.3) Anemia 104 (2.94) 7 (6.73%; 1.92-11.55) Dizziness 97 (2.74) 5 (5.15%; 0.75-9.55) GI bleed 96 (2.71) 10 (10.42%; 4.31-16.53)
Bouncebacks to the Emergency Department Observation Unit
Table 1. Most commonly used adult protocols in the emergency department observation unit.
CI, confidence interval; EDOU, emergency
Figure 2. Workflow to determine emergency department (ED), emergency department observation unit (EDOU), and return visits for inclusion.
P=0.01) or widowed (12.3% vs 3.1%, P<.001). Females were also more likely to arrive at the ED by ambulance (P=.01). Males were more likely to use tobacco (25.0% vs 12.7%; P<.001) and alcohol (23.8% vs 12.1%; P=.007) and have aspirin in their medication list (31.7% vs 21.6%, P=.047). There were no differences in gender by insurance type (P=0.22), hospitalizations (P=0.23), additional ED visits (beyond index visit and return visit; P=.10), or primary care physician visits (P=0.96) during the time between the index EDOU stay and their return visit. Demographic information is shown in Appendix 3.
Timing of Returns
Overall, 14.4% of returns occurred within 24 hours, 27.3% within 48 hours, and 65.76% within 72 hours, with similar timing of returns for males and females. Although only 30.2% of related visits occurred within 48 hours of discharge, 53.3% of potentially avoidable visits occurred during this period.
Related and Potentially Avoidable Visits
Physician reviewers agreed that 215 of the 333 return visits (64.6%) were related to the initial visit and 15 of 332 (4.5%) return visits were potentially avoidable. While there was no significant difference between male and female patients in the percentage of return visits that were related to the original visit (69.5% vs 61.5%; P=0.13), there was a significantly higher rate of potentially avoidable visits among males (8.7% vs 2.0%, P=.004). Reasons for potentially avoidable return visits included medications issues (errors in prescription or patient was unable to obtain), incomplete workup, lack of specialist consultation, or reviewers believed that the patient should have been admitted to the hospital during the initial ED visit.
Visits by Gender
When comparing the percentage of female patients in the ED population with that of the EDOU, there was no significant difference (56.3% vs. 54.9%; P=0.12). Although there was a higher percentage of females in the return visit population than in the ED populations (61.6% vs 54.9%; P=.02), there was no
significant difference between the percentage of females in the EDOU and return visit populations (56.3% vs 61.6%; P=.07).
Length of Stay
The overall population had a mean LOS of 26.89±11.52 hours in the ED and a mean LOS of 20.55±11.49 in the EDOU. There was no statistically significant difference t(332)=0.66, P=0.5 between the LOS in the ED for male (mean [M] 26.36, SD 13.45) and female (M 27.21, SD 10.16) patients, nor the EDOU LOS t(332)=0.44, P=0.6 for male (M 20.20, SD 13.87) and female (M 20.77, SD 9.75) patients. Patients who did not have a return visit had a mean EDOU LOS (M 13.00, SD 6.27).
Visits by Age
The mean age of patients who returned was 56.21 years (CI 53.77-58.65), not statistically different from the mean age of 54.32 years (CI 53.47-55.18) of patients who did not return. There was also no difference between the ages of males and females in the return population, nor between each respective gender when compared to the population that did not return. A complete list of mean ages for the subgroups of the populations with and without return visits are available in Appendix 4.
DISCUSSION
Our results are similar to those reported in two previous studies of academic EDOUs conducted by Ross et al. and Southerland et al.6,7 In addition to having a similar average age and percentage female, we found no statistically significant difference between the return rates of males and females and the makeup of the EDOU at large.6 While our EDOU’s 14.9% hospital admission rate was somewhat lower than the 19% and 23.5% reported by Ross and Southerland, respectively, we found percentages of EDOU patients who returned similar to those reported by Ross (9.4% vs 10.7%).6,7 Our rate of returns related to the initial visit was also similar to that found in the Ross study (65% vs 74%).6 We were unable to locate any previous studies that attempted to determine whether the EDOU return visits were potentially avoidable.
When comparing between males and females, there was no significant difference in LOS. This is in line with prior research that examined the LOS in observations units.8-9 Previous studies have demonstrated that LOS is usually associated with factors beyond the ED’s control, including organizational factors.10 Other studies have suggested that triage level, consultations, and investigative testing are causes for prolonged LOS.11
While the majority of complaints had a return rate that was not significantly different from our overall return rate, our return rate for adults treated for asthma was 17.5%. This was not only higher than our overall return rate, but higher than the 12.1% of asthma patients who returned to the ED within one year of an ED visit and the 30-day readmission rate for hospitalized asthma patients of 11.9% reported in
Volume 24, NO.3: May 2023 393 Western Journal of Emergency Medicine Berger et al. Bouncebacks to the Emergency Department Observation Unit
Complaint N (%) of EDOU admissions Return visits N (%; 95% CI) Bronchiolitis 52 (1.47) 2 (3.85%; 0.00-9.07) Dehydration 48 (1.36) 1 (2.08%; 0.00-6.12) Asthma 46 (1.30) 1 (2.17%; 0.00-6.39) Soft tissue infection 40 (1.13) 4 (10.00%; 0.70-19.30) Croup 31 (0.88) 5 (16.13%; 3.18-29.08) CI,
interval; EDOU,
CI,
interval.
Table 2. Most commonly used pediatric protocols in the emergency department observation unit.
confidence
emergency department observation unit;
confidence
Bouncebacks to the Emergency Department Observation Unit Berger
prior literature.12,13 However, a previous study of EDOU asthma returns found a rate of 9%, suggesting that our EDOU may accept a higher acuity of asthma patients or indicate the need to refine our treatment protocol.6 We also found lower rates of return for patients treated for chest pain and syncope, indicating these patients are well suited for EDOU care. Previous research also supports findings of lower rates of chest pain returns from the EDOU.6
Although less than one-third of related visits occurred within 48 hours of discharge, more than half of potentially avoidable visits occurred during this period. This suggests that using a 48-hour window for quality review might catch a majority of potentially avoidable visits, allowing for development of protocol improvements that could reduce return visits. It is important to note that for visits determined to be potentially avoidable, it does not necessarily mean there was a medical error. Our physician review team conducted a thorough review of the patient records, something that may not have been possible or indicated at the original ED visit. In some situations, consults or further workup may have been deferred because of the clinical status of the patient or patient preference, items that may not have been documented in the chart.
Our EDOU study population was very large and comprised of data collected over a 30-month period, enabling generation of an overall return rate with a relatively narrow CI, as well as generation of individual return rates for primary complaints. Our overall return rate and return rate of related visits were similar to those of a previous study, supporting the validity of our results. However, in our study, we went further by attempting to quantify the rate of potentially related return visits.
LIMITATIONS
We acknowledge that this study has several limitations. First, it took place at a single academic medical center whose patient population was overwhelmingly White, Englishspeaking, and insured, potentially limiting generalizability to differing populations. Although Type 1 EDOU units are well defined, differences in staffing, primary caregiver (physician vs APP), capabilities of the unit, types of protocols, and overall efficacy of institutional treatment protocols could pose further barriers to generalizability to other institutions. Second, patients who had a return visit to hospitals outside the health system would not have been captured in the study, potentially yielding a lower return rate than the true rate. Patients who returned after day 14 from EDOU discharge were not included in the study, also potentially affecting the true return rate.
The study period also included the first three months of the COVID-19 pandemic in the US. During this period, many hospitals saw a reduction in patients, potentially affecting our return rate.14 Lastly, although multiple physician-reviewers were used to categorize visits as related or avoidable, what is considered avoidable is highly subjective and varied between reviewers. Additionally, the reviewers knew that the charts
they were reviewing were from patients who had a return visit; so their attributions may have been affected by hindsight bias. For example, after a records review, one reviewer noted that although a patient’s vital signs were within normal range, they were abnormal for the patient in question. While this was factually correct, it is unlikely that the treating physician would have reached this conclusion while caring for the patient without an indication to conduct an extensive chart review. Future studies should establish criteria for what visits could “reasonably” be avoided.
CONCLUSION
This study adds to the limited body of literature on returns to ED observation units, finding an overall return rate of under 10%, with about two-thirds of returns determined to be related to the index visit and <5% considered to be potentially avoidable. Our study demonstrates findings consistent with previous singlecenter studies, including return rates. In addition, this study demonstrates that potentially avoidable revisits were likely to occur within the first 48 hours of discharge. Additional studies should include data from multiple institutions and further explore returns related to potentially avoidable revisits.
Address for Correspondence: Daniel Berger, BS, Pennsylvania State University College of Medicine, 500 University Drive, Hershey, PA 17033. Email: Danielbergercpr@gmail.com.
Conflicts of Interest: By the WestJEM article submission agreement, all authors are required to disclose all affiliations, funding sources and financial or management relationships that could be perceived as potential sources of bias. No author has professional or financial relationships with any companies that are relevant to this study. The first author received federal work study funding as part of a paid emergency department summer research internship. The principal investigator is the medical director of the EDOU.
Copyright: © 2023 Berger et al. This is an open access article distributed in accordance with the terms of the Creative Commons Attribution (CC BY 4.0) License. See: http://creativecommons.org/ licenses/by/4.0/
REFERENCES
1. Baugh CW, Venkatesh AK, Bohan JS. Emergency department observation units: a clinical and financial benefit for hospitals Health Care Manage Rev. 2011;36(1):28-37.
2. Ross MA, Hockenberry JM, Mutter R, et al. Protocol-driven emergency department observation units offer savings, shorter stays, and reduced admissions. Health Aff (Millwood). 2013;32(12):2149-56.
3. Chandra A, Sieck S, Hocker M, et al. An observation unit may help improve an institution’s Press Ganey satisfaction score. Crit Pathw Cardiol. 2011;10(2):104-6.
4. Venkatesh AK, Geisler BP, Gibson Chambers JJ, et al. Use of observation care in US emergency departments, 2001 to 2008
Western Journal of Emergency Medicine 394 Volume 24, NO.3: May 2023
al.
et
Berger et al.
[published correction appears in PLoS One. 2012;7(1).
5. Baugh CW, Venkatesh AK, Hilton JA, et al. Making greater use of dedicated hospital observation units for many short-stay patients could save $3.1 billion a year. Health Aff (Millwood). 2012;31(10):2314-23.
6. Ross MA, Hemphill RR, Abramson J, et al. The re cidivism characteristics of an emergency department observation unit. Ann Emerg Med. 2010;56(1):34-41.
7. Southerland LT, Simerlink SR, Vargas AJ, et al. Beyond observation: protocols and capabilities of an emergency department observation unit. Am J Emerg Med. 2019;37(10):1864-70.
8. Kashkoush M. Statistical analysis of the workload on the LVHN observation unit. LVHN Scholarly Works. Available at: https://scholarlyworks.lvhn.org/research-scholarsposters/376/#:~:text=However%2C%20for%20an%20OU%20 to,hours%20%5B2%5D%5B3%5D. 2014. Accessed August 23, 2022.
9. Tang D, Chan WL, Phua DH. Performance of an emergency department observation unit protocol in reducing length of stay for acetaminophen overdose: a retrospective study. Int J Emerg Med 2018;11(1):48.
10. Driesen BEJM, van Riet BHG, Verkerk L, et al. Long length of stay at
Bouncebacks to the Emergency Department Observation Unit
the emergency department is mostly caused by organizational factors outside the influence of the emergency department: a root cause analysis. PLoS One. 2018;13(9):e0202751.
11. Yoon P, Steiner I, Reinhardt G. Analysis of factors influencing length of stay in the emergency department. CJEM. 2003;5(3):155-61.
12. To T, Zhu J, Ryckman K, et al. Risk factors for return to the emergency department for asthma: a population-based study. J Allergy Clin Immunol Pract. 2018;6(6):1907-13.e4.
13. Patel N, Singh S, Desai R, et al. Thirty-day unplanned readmission in hospitalized asthma patients in the USA. Postgrad Med J 2022;98(1165):830-6.
14. Heppner Z, Shreffler J, Polites A, et al. COVID-19 and emergency department volume: The patients return but have different characteristics. Am J Emerg Med. 2021;45:385-388.
15. Dharmarajan K, Qin L, Bierlein M, et al. Outcomes after observation stays among older adult Medicare beneficiaries in the USA: retrospective cohort study. BMJ. 2017;357:j2616.
16. Ross MA, Compton S, Richardson D, et al. The use and effectiveness of an emergency department observation unit for elderly patients. Ann Emerg Med. 2003;41(5):668-77.
Volume 24, NO.3: May 2023 395 Western Journal of Emergency Medicine
Utilization and Impact of Pharmacist-led, Urinary Culture Follow-Up
After Discharge from the Emergency Department
Danny Pham, PharmD*
Stephen Lee, PharmD*
Sadaf Abrishami, PharmD*
Bharath Chakravarthy, MD†
Soheil Saadat, MD†
Section Editor: Laura Walker
University of California Irvine Medical Center, Department of Pharmacy, Orange, California
University of California Irvine Medical Center, Department of Emergency Medicine, Orange, California
Submission history: Submitted October 6, 2022; Revision received February 13, 2023; Accepted February 17, 2023
Electronically published May 3, 2023
Full text available through open access at http://escholarship.org/uc/uciem_westjem
DOI: 10.5811/westjem.59116
Introduction: Urinary tract infections (UTI) are a common reason for an emergency department (ED) visit. The majority of these patients are discharged directly home without a hospital admission. After discharge, emergency physicians have traditionally managed the care of the patient if a change is warranted (as a result of urine culture results). However, in recent years clinical pharmacists in the ED have largely incorporated this task into their standard practice. In our study, we aimed to 1) describe our unique process in having a pharmacist-led, urinary culture follow-up, and 2) compare it to our previous, more traditional process.
Methods: In our retrospective study, we evaluated the impact of a pharmacist-led, urinary culture follow-up program after discharge from the ED. We included patients prior to and after the implementation of our new protocol to compare the differences. The primary outcome was time to intervention after urine culture result was released. Secondary outcomes included rate of documentation of intervention, appropriate interventions made, and repeat ED visits within 30 days.
Results: We included a total of 265 unique urine cultures from 264 patients in the study: 129 cultures were from the period prior to implementation of the protocol, and 136 were from the post-implementation period. There were no significant differences between pre- and post-implementation groups for the primary outcome. Appropriate therapeutic intervention based on positive urine culture results was 16.3% in the preimplementation group vs 14.7% in the post-implementation group (P=0.72). Secondary outcomes of time to intervention, documentation rates, and readmissions were similar between both groups.
Conclusion: Implementation of a pharmacist-led, urinary culture follow-up program after discharge from the ED led to similar outcomes as a physician-run program. An ED pharmacist can successfully run a urinary culture follow-up program in an ED without physician involvement.
[West J Emerg Med. 2023;24(3)396–400.]
INTRODUCTION
Urinary tract infections (UTI) are the most common outpatient infections in the United States with over 10 million cases annually.1 In the ED, UTIs account for two million annual visits.2 Of this group, the majority of these patients are discharged directly home from the ED. For patients with a UTI, urine cultures are obtained
so that clinicians can compare antimicrobial species and antibiotic susceptibility to selected treatment. Patients are discharged from the ED with empiric antibiotics (based on institution treatment algorithms) while the results of the urine culture are processing. Once the cultures are finalized, standard practice is to follow up with the patient if medical therapy modification is required. For example, if
Western Journal of Emergency Medicine 396 Volume 24, NO.3: May 2023 Brief Research Report
* †
the patient received an antibiotic that is resistant on culture susceptibilities, a phone call would have to be made to access a change in therapy. With the increasing resistance rates of antibiotics and development of multi-drug-resistant organisms, more patients have been requiring antibiotic therapy modification after culture results.3
Although most institutions provide discharge culture follow-up, there is not a standardized workflow for this common practice.4-9 Traditionally, the emergency physician would get notified of discharge culture results and would have to make therapy modifications. The physicians may have worked in conjunction with nurses, nurse practitioners, physician assistants, or pharmacists to triage culture results.4-9 However, our new process would allow the clinical pharmacist the independence to access and modify urine culture results under a specified collaborative protocol.
Clinical pharmacists in the ED, especially those who have done residency training, are capable of interpreting culture results and identifying the optimal antibiotics. Studies involving pharmacists in discharge culture follow-up have shown a decrease in ED revisits and hospital admissions.10-11 Although there is evidence supporting pharmacist involvement, data is specifically lacking for a pharmacist-led program without physician consultation. At our institution, we implemented a pharmacist-led, urinary culture followup protocol for patients discharged from the ED. Under the stipulations of the protocol, pharmacists in the ED were empowered to interpret and intervene of their own volition. In this study our aim was to assess the efficacy of this protocol in providing timely and appropriate therapeutic interventions for this patient population while describing our unique process.
METHODS
We report a retrospective study on the impact of a pharmacist-led, urinary culture follow-up after discharge from the ED. This study was conducted at the University of California, Irvine Medical Center. The ED has over 50,000 patient visits annually with ≈50 patients discharged per week with a diagnosis of a UTI. Three pharmacists provided decentralized services in the department for 16 hours on weekdays and eight hours on the weekends.
In March 2020, a pharmacist-led, urine culture followup protocol was implemented. Prior to implementation of the protocol, ED pharmacists assisted emergency physicians in reviewing cultures and could provide recommendations regarding treatment but required physician authorization before making changes. The pharmacist would have to approach an attending physician who was on shift to discuss the culture results. With the implementation of the new protocol, pharmacists were privileged to independently adjust antibiotic regimens based on urine culture results. The ED pharmacists were able to add, adjust, and discontinue antibiotics within the specifications of the protocol.
Based on our protocol, if an intervention was required, the pharmacist would contact the patient to conduct an interview. In doing so, the pharmacist would assess the patient’s condition, medication compliance, and treatment efficacy to decide whether any interventions would be required. If the patient required a medication change, the pharmacist would notify the patient of the new treatment plan and provide counseling/education. The pharmacist would send a new prescription and document the intervention made on the patient’s electronic health record. Lastly, the pharmacist would notify the original prescriber of the updated treatment plan. Pharmacists in the ED would take about 20 minutes a day to review urine culture results. On average, there were about 10 cultures a day to review, with most of them not needing an intervention. There were no direct costs associated with implementation of this program.
We included patient data from two months before and after implementation. Patients were included in the study if they were >18 years and seen in the ED with a urine culture collected. Patients were excluded from the study if they were admitted to the hospital. We included patients treated after the new protocol was implemented. The control group was composed of patients prior to the protocol implementation.
The primary outcome was time to intervention after culture results were released. Time to intervention was measured from time of culture result to when a progress note was charted regarding the result. Secondary outcomes included rate of documentation of intervention, rate of appropriate interventions made, and repeat ED visits within 30 days. We defined an appropriate intervention as a correct treatment plan dependent on the patient’s urine culture, which included antibiotic choice, dosing, and duration. For our statistical analysis, we used chi-squared tests for nominal data and Student t-tests for continuous variables. A P-value of less than 0.05 was considered to indicate statistical significance.
RESULTS
A total of 265 positive urine culture results from 264 unique patients were included in the final analysis from February–May 2020: 129 culture results were from the pre-implementation period, and 136 were from the postimplementation period. Baseline characteristics were similar between both groups (Table 1). The most frequent comorbidities were immunocompromised state (8.7%), pregnancy (7.9%), and recent UTI (6.8%). Of the patients with a positive urine culture result, only 106 (40.2%) had a presentation consistent with a UTI. Of these patients, there was not a significant difference in rate of treatment-organism discordance, defined as inappropriate treatment based on the organism(s) that grew out (P=0.66).
The primary outcome of time to intervention was 14.5 hours in the pre-group vs 7.0 hours in the postgroup (P=0.54). For the secondary outcomes, we found
Volume 24, NO.3: May 2023 397 Western Journal of Emergency Medicine Pham et al Pharmacist-led Urinary Culture Follow-Up After ED Discharge
Pharmacist-led Urinary Culture Follow-Up After ED Discharge
a After removal of colonization and asymptomatic patients. UTI, urinary tract infection ED, emergency department; MDR, multidrug resistant; ESBL, extended-spectrum beta-lactamases; MRSA, methicillin-resistant Staphylococcus aureus
IQR, interquartile range.
no significant differences between the pre- and postimplementation groups. Of the interventions, 8 (38.1%) vs 12 (60%) of them were documented for the pre-implementation and post-implementation groups, respectively (P=0.16). The rate of appropriate therapeutic interventions based on positive urine culture results was 16.3% in the pre-implementation group vs 14.7% in the post-implementation group (P=0.72).
There was also no significant difference in repeat ED visits within 30 days (Table 2). The initial prescribing physicians were notified of any interventions made by pharmacists, and the interventions were deemed appropriate after being reviewed by the physicians. Appropriate interventions were defined as antibiotics at discharge being susceptible based on urine culture results.
Western Journal of Emergency Medicine 398 Volume 24, NO.3: May 2023
Pham et al Characteristics Pre-group, n = 129 Post-group, n = 136 P-value Female, n (%) 111 (86.1) 118 (86.8) 0.87 Age, mean ± SD 48.5 ± 20.8 47.4 ± 19.9 0.68 Clinical comorbidities,a (%) 38 (29.5) 51 (37.5) 0.17 Pregnancy, n (%) 11 (8.5) 10 (7.4) 0.72 Recent UTI, n (%) 6 (4.7) 12 (8.8) 0.18 Nephrostomy tube, n (%) 1 (0.8) 4 (2.9) 0.37 Immunocompromised, n (%) 7 (5.4) 16 (11.8) 0.07 History of MDR organisms, n (%) 1 (0.8) 1 (0.7) >0.99 Recent urological procedure, n (%) 3 (2.3) 1 (0.7) 0.36 Catheterized, n (%) 6 (4.7) 11 (8.1) 0.25 Neurological handicaps, n (%) 5 (3.9) 8 (5.9) 0.45 Positive urine analysis, n (%) 63 (48.8) 78 (57.4) 0.17 Received antibiotics in ED, n (%) 39 (30.2) 55 (40.4) 0.08 Positive urine culture growth, n (%) - - 0.20 Single pathogen, n (%) 93 (72.1) 88 (64.7)Multiple pathogens, n (%) 36 (27.9) 48 (35.3) MDR pathogens, n (%) 7 (5.4) 10 (7.4) >0.99 ESBL, n (%) 6 (85.7) 9 (90)MRSA, n (%) 1 (14.3) 1 (10) Rate of treatment-organism discordance a - - 0.66 Yes, n (%) 15 (25.9) 16 (22.5)No, n (%) 43 (74.1) 55 (77.5) Characteristics Pre-group, n = 129 Post-group, n = 136 P-value Time to intervention, median [IQR] 14.5 [2.7-25.7] 7.0 [2.3-15.7] 0.54 Discharged with antimicrobials, n (%) 60 (46.5) 70 (51.5) 0.42 Interventions required, n (%) 21 (16.3) 20 (14.7) 0.72 Interventions documented, n (%) 8/21 (38.1) 12/20 (60) 0.16 Start new antibiotics, n (%) 1 (12.5) 2 (16.7) Change in antibiotics, n (%) 6 (75) 6 (50)Discontinue antibiotics, n (%) 1 (12.5) 4 (33.3) Re-admitted within 30 days, n (%) 11 (8.5) 2 (2.3) 0.08
Table 1. Baseline demographics and clinical characteristics according to cohort.
Table 2. Discharge outcomes and associated interventions according to cohort.
DISCUSSION
In this retrospective study assessing the efficacy of a pharmacist-led, urine culture follow-up protocol, we found no significant difference in the time to intervention of urine culture results of patients with UTI discharged from the ED. None of the secondary outcomes showed a statistically significant difference pre- and post- implementation of this protocol. Despite not requiring direct physician oversight, intervention rates and repeat ED visits were similar after protocol implementation. This study provides evidence that pharmacists working independently are capable of appropriately managing urine cultures. Although our study did not show these results, having a pharmacist manage cultures could potentially increase documentation rates, decrease time to intervention, and decrease readmissions.
Like previous studies, our study described implementation of a new process for managing ED discharge cultures and compared post-implementation data with pre-implementation data.12-13 Having pharmacists work on discharge cultures is not unique to the ED setting. However, our protocol privileged ED pharmacists to work independently to review and manage discharge urine cultures. Prior to our protocol implementation, ED pharmacists were already involved in reviewing discharge culture results. Pharmacists were able to identify when interventions were required and would advise an attending physician on call to make an intervention. The difference in protocol implementation is that now pharmacists conduct interventions independently, which may allocate more time for emergency physicians to manage more acute patients. Despite a pharmacist solely managing these interventions, there was not a drop-off in appropriate interventions.
A potential benefit of an ED pharmacist-led protocol is the capability to reduce time to intervention. Because the initial prescribing physician was not involved in the management of culture callbacks, there were no delays due to physician staffing schedules. Furthermore, current physicians who were staffing in the department did not need to be notified of past culture results and then address them. This in turn would free up more time for direct patient care. Additionally, the pharmacist did not have to wait on an ED clinician to discuss the culture result, as required by many pharmacy-led protocols, and could intervene more quickly of their own volition under the collaborative practice. Although our study did not show it, our protocol could potentially lead to faster time to intervention and could identify treatment discordances and inappropriate treatment of UTIs, which would in turn reduce treatment failures, antimicrobial resistance, and readmissions.
LIMITATIONS
A limitation in our study included the short time frame of data collection. The study data was only collected for four months, and the results could have been more robust with a longer collection period and greater sample size. A power
analysis was not done; so it is unknown whether the study was adequately powered to detect a difference. Another limitation is the retrospective study design, and so we could not control for other confounding variables. A delay or lack of documentation could affect the time-to-intervention results.
CONCLUSION
This study describes the implementation of a pharmacistled, urinary culture follow-up protocol in the ED and demonstrates that ED pharmacists can successfully lead urine culture follow-ups without physician consultation under a collaborative practice. We found no significant differences in time to intervention after urine culture result was released, nor in appropriate interventions made or repeat ED visits within 30 days. The protocol described here could be implemented in other institutions and expanded upon to provide more opportunities for pharmacist clinical services.
Address for Correspondence: Danny Pham, PharmD, University of California Irvine Medical Center, 101 The City Drive S, Orange, CA 92868. Email: dpham@chapman.edu
Conflicts of Interest: By the WestJEM article submission agreement, all authors are required to disclose all affiliations, funding sources and financial or management relationships that could be perceived as potential sources of bias. No author has professional or financial relationships with any companies that are relevant to this study. There are no conflicts of interest or sources of funding to declare.
Copyright: © 2023 Pham et al. This is an open access article distributed in accordance with the terms of the Creative Commons Attribution (CC BY 4.0) License. See: http://creativecommons.org/ licenses/by/4.0/
REFERENCES
1. Flores-Mireles AL, Walker JN, Caparon M, et al. Urinary tract infections: epidemiology, mechanisms of infections and treatment options. Nat Rev Microbiol. 2015;13(5):269-84.
2. Rui P, Kang K. National Hospital Ambulatory Medical Care Survey: 2018 Emergency Department Summary Tables. 2018. Available at: https://www.cdc.gov/nchs/data/ahcd/namcs_summary/2018-namcsweb-tables-508.pdf. Accessed February 1, 2022.
3. CDC. Antibiotic Resistance Threats in the United States. 2019. Available at: https://ndc.services.cdc.gov/wp-content/uploads/ Antibiotic-Resistance-Threats-in-the-United-States-2019.pdf. Accessed February 1, 2022.
4. Dumkow LE, Kenney RM, MacDonald NC, et al. Impact of a multidisciplinary culture follow-up program of antimicrobial therapy in the emergency department. Infect Dis Ther. 2014;3(1):45-53.
Volume 24, NO.3: May 2023 399 Western Journal of Emergency Medicine Pham et al Pharmacist-led Urinary Culture Follow-Up After ED Discharge
Pharmacist-led Urinary Culture Follow-Up After ED Discharge
5. Davis LC, Covey RB, Weston JS, et al. Pharmacist-driven antimicrobial optimization in the emergency department. Am J Health-Syst Pharm. 2016;73(5suppl1):S49-56.
6. Van Enk J, Townsend H, Thompson J. Pharmacist-managed culture review service for patients discharged from the emergency department. Am J Health-Syst Pharm. 2016;73(18):1391-4.
7. Miller K, McGraw MA, Tomsey A, et al. Pharmacist addition to the post-ED visit review of discharge antimicrobial regimens. Am J Emerg Med. 2014;32(10):1270-4.
8. Zhang X, Rowan N, Pflugeisen BM, et al. Urine culture guided antibiotic interventions: a pharmacist driven antimicrobial stewardship effort in the ED. Am J Emerg Med. 2017;35(4):594-8.
9. Dumkow LE, Beuschel TS, Brandt KL. Expanding antimicrobial stewardship to urgent care centers through a pharmacist-led culture follow-up program. Infect Dis Ther. 2017;6(3):453-9.
10. Olson A, Feih J, Feldman R, et al. Involvement of pharmacistreviewed urine cultures and sexually transmitted infections in the emergency department reduces time to antimicrobial optimization. Am J Health Syst Pharm. 2020;77:S54-S58
11. Wu JY, Balmat R, Kahle M, et al. Evaluation of a health systemwide pharmacist-driven emergency department laboratory followup and antimicrobial management program. Am J Emerg Med 2020;38(12):2591-5
12. Randolph T, Parker A, Meyer L, et al. Effect of a pharmacist-managed culture review process on antimicrobial therapy in an emergency department. Am J Health Syst Pharm. 2011;68:916–9.
13. Loborec SM, Bazan JA, Brown NV, et al. Privileging pharmacists improves time to patient notification in the microbiological test review process for patients discharged from the emergency department. Am J Health Syst Pharm. 2020;77(S19-S24).
Western Journal of Emergency Medicine 400 Volume 24, NO.3: May 2023
Pham et al
National Trends in Vital Sign Abnormalities at Arrival to the Emergency Department
Rama A. Salhi, MD, MHS, MSc* Margaret Greenwood-Ericksen, MD, MSc†,‡ Keith E. Kocher, MD, MPH§
Department of Emergency Medicine, Massachusetts General Hospital, Boston, Massachusetts
Department of Emergency Medicine, University of New Mexico, Albuquerque, New Mexico
Department of Psychiatry and Behavioral Sciences, University of New Mexico, Albuquerque, New Mexico
Department of Emergency Medicine, University of Michigan, Ann Arbor, Missouri
Section Editor: Brian Yun, MD
Submission history: Submitted September 23, 2022; Revision received February 23, 2023; Accepted February 17, 2023
Electronically published May 5, 2023
Full text available through open access at http://escholarship.org/uc/uciem_westjem
DOI: 10.5811/westjem.58990
Introduction: Recent reports suggest rising intensity of emergency department (ED) billing practices, sparking concerns that this may represent up-coding. However, it may reflect increasing severity and complexity of care in the ED population. We hypothesize that this in part may be reflected in more severe manifestations of illness as indicated by vital sign abnormalities.
Methods: Using 18 years of data from the National Hospital Ambulatory Medical Care Survey, we conducted a retrospective secondary analysis of adults (>18 years). We assessed standard vital signs using weighted descriptive statistics (heart rate, oxygen saturation, temperature, and systolic blood pressure [SBP]), as well as hypotension and tachycardia. Finally, we evaluated for differing effects stratifying by subpopulations of interest, including age (<65 vs ≥65), payer type, arrival by ambulance, and high-risk diagnoses.
Results: In total there were 418,849 observations representing 1,745,368,303 ED visits. We found only minimal variations in vital signs over the study period: heart rate (median 85, interquartile range [IQR] 74-97); oxygen saturation (median 98, IQR 97-99); temperature (median 98.1, IQR 97.6-98.6); and SBP (median 134, IQR 120-149). Similar results were found among the subpopulations tested. The proportion of visits with hypotension decreased (first/last year difference 0.5% [95% CI 0.2%-0.7%]) while there was no difference in the proportion of patients with tachycardia.
Conclusions: Arrival vital signs in the ED have largely remained unchanged or improved over the most recent 18 years of nationally representative data, even for key subpopulations. Greater intensity in ED billing practices is not explained by changes in arrival vital signs.
[West J Emerg Med. 2023;24(3)401–404.]
INTRODUCTION
Recently there has been increasing scrutiny of emergency department (ED) billing practices.1 A report released by the Office of the Inspector General revealed a 21% increase in the highest reimbursement category between 2001–2010.2,3 Explanations to
account for these trends include concerns about billing at a level of care higher than appropriate for the services rendered, referred to as “up-coding,” greater adoption and integration of electronic health records that enhance billing processes, and changes related to ED clinical practices pressures, especially tied to greater
Volume 24, NO.3: May 2023 401 Western Journal of Emergency Medicine Brief Research Report
* † ‡ §
intensity of services as a result of the changing complexity, illness, or clinical instability of patients.4,5 Understanding the sources of these trends is important given increasing efforts to contain ED expenditures in the setting of rising healthcare costs.
One important hypothesis to consider that may explain rising intensity in ED billing practices is increased severity of illnesses presenting to EDs. Prior work has used claims-based data to explore correlations between coding intensity on claims and a variety of surrogate markers of illness severity, including acuity assignments and billed ED services such as use of procedures or diagnostic testing.4 However, these markers are also confounded by temporal and evolving trends in clinical practice rather than differences in the level of illness severities confronted in the ED, limiting their ability to trend increasing clinical acuity over time. Further, while generally felt to be reliable metrics to identify high-resource patients,6 acuity assignments remain vulnerable to potential bias related to factors such as physician clinical knowledge, environmental constraints, and patient demographics.7
Vital sign measurements provide an alternative approach to measuring severity of illness. Since measurement of vital signs is standard and central to the clinical assessment and treatment of ED patients, they provide a useful objective measure with resistance to the temporal biases that are encountered with other metrics and can act as a proxy for patient severity and acuity of illness.8 We examined a nationally representative dataset with longitudinally consistent, data-definition standards to test for differences over time in the vital signs of patients arriving to the ED. Specifically, we hypothesized that increasing severity of illness, as measured by vital sign instability (defined as hypotension (systolic blood pressure [SBP] <90), tachycardia (heart rate >100), or >1 abnormal vital sign), may be correlated with known increased intensity in ED billing practices over time.
METHODS
We used the most recent 18 years (2001–2018) of the National Hospital Ambulatory Medical Care Survey (NHAMCS) for this analysis. The NHAMCS is an annual, national probability sample of ambulatory visits made to nonfederal general and short-stay hospitals in the US, which is conducted by the National Center for Health Statistics. Sample hospitals are randomly assigned to 16 groups that rotate across four-week reporting periods so that each hospital is surveyed about once every 15 months.9 Information about ED visits is abstracted from chart review using standard data definitions, including demographics, vital signs, and diagnostic codes.
Because children particularly have varying definitions of abnormal vital signs dependent on age, we excluded 125,518 patients <18 years old. We then calculated and trended weighted descriptive statistics for the following vital signs: heart rate; oxygen saturation; temperature; and SBP. Given
non-normal distribution, median and interquartile ranges [IQR] are reported. Respiratory rate, also available in the dataset, was excluded due to significant missingness (>60%). As repeat vital signs are not measured in all patients, we used vital signs on arrival to the ED for this analysis.
To analyze common clinically relevant measures, we also assessed for trends in vital sign instability. This included tachycardia (pulse >100), hypotension (SBP <80), abnormal temperature (temperature <95°F or ≥100.4°F), and hypoxia (SpO2 <88%) Finally, we evaluated for the possibility of differing effects across important ED subpopulations that were defined a priori, stratifying by age (<65 vs ≥65), payer (uninsured, private, government), ambulance arrival, and previously described high-risk diagnoses.10 High-risk diagnoses were defined as those having greater than 3% inpatient mortality and include the following: pneumonia; congestive heart failure; acute myocardial infarction; stroke; sepsis; gastrointestinal bleed; acute renal failure; and respiratory failure.
We calculated survey-weighted summary statistics for each of the available vital signs, and differences between the first and last year of study were calculated using postestimation for linear combinations of variables. To assess for trends in clinical instability over time, we completed survey-weighted logistic regressions. Details regarding the methodology used to address annual NHAMCS survey revisions and data collection changes can be found in the manuscript supplement. All analyses were completed in StataSE v17.0 (StataCorp LLC, College Station, TX), and the study was deemed exempt from review by the University of Michigan Institutional Review Board.
RESULTS
In total there were 418,849 observations representing 1,932,843,890 ED visits from 2001–2018. The median age was 43 years (interquartile range [IQR] 29-60) with 43.1% male (Supplement Table 1). Vital sign trends analyzed revealed minimal variation over the study period (Figure). Heart rate measurements remained stable (median 85, IQR 74-97; yearly median range 84-85). Similar trends were noted in measurements of oxygen saturation (median 98, IQR 97-99; all yearly medians 98), temperature (median 98.1°, IQR 97.698.6°; yearly median range 98-98.2°), and SBP (median 134, IQR 120-149; yearly median range 133-135). Finally, among the assessed subpopulations evaluated, we found no difference in vital sign trends over time (Supplement).
We also evaluated for differences in the proportion of ED patients with unstable arrival vital signs but found no evidence of increasing severity. The percentage of hypotensive visits decreased over time, accounting for 1.1% in 2001 to 0.6% in 2018 (difference of –0.5%; 95% confidence interval [CI] –0.2% - –0.7%). In addition, we saw no clear trends in patients presenting with tachycardia, with this proportion being 22.9%
Western Journal of Emergency Medicine 402 Volume 24, NO.3: May 2023
the ED Salhi et al.
National Trends in Vital Sign Abnormalities at Arrival to
*Box and whisker plot intervals represent 1st, 25th, 50th, 75th, and 99th percentiles. Circle overlying box and whisker plot represents annual mean.
**Reference lines have been demarcated for pulse=100; systolic blood pressure=90; oxygen saturation=88%; temperature=100.4°F.
in 2001 as compared to 25.1% in 2018 (difference of 2.2%; 95% CI –5.4%-1.0%) (Supplement Figure 2). The proportion of patients presenting with >1 abnormal vital sign was 9.2% in 2001 and 6.7% in 2018 (difference of –2.5%; 95% CI –5.2%-0.3%). When evaluating the odds of presentation with signs of clinical instability over time, we saw there was no change in the likelihood of tachycardia (P=0.22) or hypoxia (P=0.15) over the study period. For hypotension and abnormal temperature, we noted decreasing odds over time (P<0.01 for both measures). Similar trends were noted in all subgroups.
DISCUSSION
In this nationally representative data of ED visits, we found no indication of increased severity of illness, as measured by initial vital sign abnormalities at time of ED presentation. This trend persisted among subpopulations of interest, including high-risk diagnoses, patients ≥65, ambulance arrival, and publicly insured patients. Similarly, when looking at tachycardia, there was minimal change over the studied period. Notably, there was a decrease in the proportion of hypotensive patients presenting to the ED over the study period, accounting for 1.1% of patients in 2001 to 0.6% in 2018.

Our findings suggest that trends in increasing billing practices are not correlated with increasing vital sign instability.
However, while the proportions and central estimates of these results do not suggest overall increases in the severity of illness in the average ED patient, our study years overlap with considerable temporal changes in ED care delivery. These changes include the implementation of electronic health records, which allows for improved capture of clinical elements and thus a higher level of billing, implementation of the Affordable Care Act, and Medicare expansions coupled with increasing numbers of hospital closures, which have resulted in increasing patient volumes with decreased access to local EDs and other venues for acute unscheduled care.11 There has also been evolving pressures on EDs to implement more intense and complex care management practices prior to hospitalization or discharge.12 This may include increased critical care rendered in the ED as hospital crowding increases.13 Additionally, as prehospital care practices and protocols have become increasingly sophisticated, the observed trends in vital signs may be confounded by earlier stabilization of medical conditions prior to presentation to the ED.
LIMITATIONS
Limitations of this study include the use of a single measure of vital signs rather than serial measures during the ED visit, as well as use of vital sign abnormalities as a surrogate for measuring trends over time in ED acuity and severity of illness. Vital sign changes may be only one
Volume 24, NO.3: May 2023 403 Western Journal of Emergency Medicine Salhi et al. National Trends in Vital Sign Abnormalities at Arrival to the ED
Figure. Annual trends in vital sign abnormalities.*,**
National Trends in Vital Sign Abnormalities at Arrival to the ED
potential component of clinical complexity in the ED. Other factors include increasing patient age, greater comorbidities and chronic disease burden, and rising demands on ED evaluations such as higher intensity of diagnostic testing and pressures to avoid hospitalization, which have all been shown to be increasing.4,12 However, even in the setting of these limitations, vital signs and clinical instability remain an important component of the evaluation of illness severity among patients presenting to the ED.
Further, limitations of the dataset we used include the lack of availability of respiratory rate, which is particularly relevant for cardiopulmonary disorders. That being acknowledged, the remainder of the available vital sign data independently provide important information that contributes the consideration of illness severity. Utilization of this national sample provides estimates that have broad generalizability but may not necessarily reflect trends seen in smaller communities. The limitations are among those previously noted to be inherent in the utilization and interpretation of NHAMCS data.14
CONCLUSION
Vital signs provide an objective, standard measure of patient illness severity that is both clinically relevant and can be trended over time.8 When analyzing vital signs as one component of illness severity, we note that they remain largely unchanged or improved, even for key subpopulations. These results, in the context of greater intensity in ED billing practices, do not suggest a correlation with changes in illness severity, specifically as measured by arrival vital signs.
Address for Correspondence: Rama A. Salhi, MD, MHS, MSc, Massachusetts General Hospital, Department of Emergency Medicine, 125 Nashua Street, Suite 920, Boston, MA 02114. Email: rsalhi@mgh.harvard.edu
Conflicts of Interest: By the WestJEM article submission agreement, all authors are required to disclose all affiliations, funding sources and financial or management relationships that could be perceived as potential sources of bias. No author has professional or financial relationships with any companies that are relevant to this study. There are no conflicts of interest or sources of funding to declare.
Copyright: © 2023 Salhi et al. This is an open access article distributed in accordance with the terms of the Creative Commons Attribution (CC BY 4.0) License. See: http://creativecommons.org/ licenses/by/4.0/
REFERENCES
1. Chabra K, Brown E, Ryan A. No more surprises — new legislation on out-of-network billing | NEJM. N Engl J Med. 2021;84(15):1381-3.
2. Department of Health and Human Services. Coding Trends of Medicare Evaluation and Management Services (OEI-04-10-00180). 2012. Available at: https://oig.hhs.gov/oei/reports/oei-04-10-00180. pdf. Accessed March 15, 2021.
3. Pitts SR, Pines JM, Handrigan MT, Kellermann AL. National trends in emergency department occupancy, 2001 to 2008: effect of inpatient admissions versus emergency department practice intensity. Ann Emerg Med. 2012;60(6):679-86.e3.
4. Burke LG, Wild RC, Orav EJ, et al. Are trends in billing for high-intensity emergency care explained by changes in services provided in the emergency department? An observational study among US Medicare beneficiaries. BMJ Open. 2018;8(1): e019357.
5. Pitts SR. Higher-complexity ed billing codes — sicker patients, more intensive practice, or improper payments? N Engl J Med 2012;367(26):2465-7.
6. Tanabe P, Gimbel R, Yarnold PR, et al. Reliability and validity of scores on the Emergency Severity Index Version 3. Acad Emerg Med. 2004;11(1):59-65.
7. López L, Wilper AP, Cervantes MC, et al. Racial and sex differences in emergency department triage assessment and test ordering for chest pain, 1997–2006. Acad Emerg Med. 2010;17(8):801-8.
8. Nguyen OK, Makam AN, Clark C, et al. Vital signs are still vital: instability on discharge and the risk of post-discharge adverse outcomes. J Gen Intern Med. 2017;32(1):42-8.
9. Centers for Disease Control and Prevention. NHAMCS Scope and Sample Design. Available at: https://www.cdc.gov/nchs/ahcd/ahcd_ scope.htm. Accessed July 26, 2021.
10. Kocher KE, Haggins AN, Sabbatini AK, et al. Emergency department hospitalization volume and mortality in the United States. Ann Emerg Med. 2014;64(5):446-57.e6.
11. American Hospital Association. Trendwatch Chartbook 2018: Trends affecting hospitals and health systems. Available at: https://www.aha. org/system/files/2018-07/2018-aha-chartbook.pdf. Accessed October 12, 2021.
12. Lin MP, Baker O, Richardson LD, Schuur JD. Trends in emergency department visits and admission rates among US acute care hospitals. JAMA Intern Med. 2018;178(12):1708-10.
13. McKenna P, Heslin SM, Viccellio P, et al. Emergency department and hospital crowding: causes, consequences, and cures. Clin Exp Emerg Med. 2019;6(3):189-95.
14. Cooper RJ. NHAMCS: Does It hold up to scrutiny? Ann Emerg Med 2012;60(6):722-5.
Western Journal of Emergency Medicine 404 Volume 24, NO.3: May 2023
et al.
Salhi
Original Research
Characteristics of Suspected COVID-19 Discharged Emergency Department Patients Who Returned During the First Wave
Jonathan Gong, MD*
Rene Mayorga AAS†
Roland Hentz, MS‡
Martin Lesser, PhD‡§
Seleshi Demissie, DrPH‡
Frederick Davis, DO*
Adam Berman, MD*
Matthew Barish, MD||
Stuart L. Cohen, MD||
Kate L. van Loveren, BS*
Nancy S. Kwon, MD*
Northwell COVID-19 Research Consortium#
Section Editor: Stephen Liang, MD
Zucker School of Medicine at Hofstra/Northwell, Long Island Jewish Medical Center, Department of Emergency Medicine, New Hyde Park, New York Northwell Health, Emergency Medicine Service Line, New Hyde Park, New York
Feinstein Institute for Medical Research, Biostatistics Unit, Great Neck, New York
Zucker School of Medicine at Hofstra/Northwell, Department of Molecular Medicine & Department of Population Health, Hempstead, New York
Donald & Barbara Zucker School of Medicine at Hofstra/Northwell, Northwell Health, Department of Radiology, Hempstead, New York
Listed at end of article
Submission history: Submitted August 31, 2023; Revision received January 30, 2023; Accepted January 24, 2023
Electronically published April 3, 2023
Full text available through open access at http://escholarship.org/uc/uciem_westjem
DOI: 10.5811/westjem.58717
Introduction: Limited information exists on patients with suspected coronavirus disease 2019 (COVID-19) who return to the emergency department (ED) during the first wave. In this study we aimed to identify predictors of ED return within 72 hours for patients with suspected COVID-19.
Methods: Incorporating data from 14 EDs within an integrated healthcare network in the New York metropolitan region from March 2–April 27, 2020, we analyzed this data on predictors for a return ED visit—including demographics, comorbidities, vital signs, and laboratory results.
Results: In total, 18,599 patients were included in the study. The median age was 46 years old [interquartile range 34-58]), 50.74% were female, and 49.26% were male. Overall, 532 (2.86%) returned to the ED within 72 hours, and 95.49% were admitted at the return visit. Of those tested for COVID-19, 59.24% (4704/ 7941) tested positive. Patients with chief complaints of “fever” or “flu” or a history of diabetes or renal disease were more likely to return at 72 hours. Risk of return increased with persistently abnormal temperature (odds ratio [OR] 2.43, 95% CI 1.8-3.2), respiratory rate (2.17, 95% CI 1.6-3.0), and chest radiograph (OR 2.54, 95% CI 2.0-3.2). Abnormally high neutrophil counts, low platelet counts, high bicarbonate values, and high aspartate aminotransferase levels were associated with a higher rate of return. Risk of return decreased when discharged on antibiotics (OR 0.12, 95% CI 0.0-0.3) or corticosteroids (OR 0.12, 95% CI 0.0-0.9).
Conclusion: The low overall return rate of patients during the first COVID-19 wave indicates that physicians’ clinical decision-making successfully identified those acceptable for discharge. [West J Emerg Med. 2023;24(3)405–415.]
INTRODUCTION
The coronavirus disease 2019 (COVID-19) outbreak was declared a pandemic by the World Health Organization on March 11, 2020.1 At that time, emergency departments (ED) and hospitals in the United States, and specifically New York
City, became inundated with patients with respiratory concerns for a disease with evolving diagnostics and therapeutics. The COVID-19 outbreak quickly spread throughout New York State at an unprecedented rate with the peak of hospitals’ capacity occurring on April 9, 2020.2-4 Many patients presenting
Volume 24, NO.3: May 2023 405 Western Journal of Emergency Medicine
* † ‡ § || #
Characteristics of Suspected COVID-19 Patients Who Returned
to EDs were evaluated, and their disposition was made largely without confirmatory testing. Thus far, little is known about the subsequent healthcare encounters of patients who were discharged from the ED with COVID-19 or suspected COVID-19 and the factors that may have increased their risk for return. We hope to better understand the role of EDs during this outbreak and the outcomes of treat-and-release patients with suspected COVID-19.
Although recent studies have looked at clinical characteristics and risk factors for poor outcomes in hospitalized patients with COVID-19, sparse data exists for the ED setting.5-12 During the initial surge of COVID-19 in New York, there were no evidence-based guidelines to help clinicians care for patients in the ED. The role of the ED in evaluating patients with suspected COVID-19 and determining disposition was instrumental during this ongoing public health crisis. Limited inpatient beds and overall resources, such as COVID-19 testing and mechanical ventilators, forced emergency clinicians to use surrogate markers of critical illness—vital signs, laboratory data, and radiologic data—to determine whether patients with suspected COVID-19 required admission. Further, during the first COVID-19 surge there were dynamic changes in clinical decision-making and admission criteria. As our knowledge of COVID-19 evolved and resources remained limited, data on outcomes of patients who were discharged from the ED with suspected COVID-19 would assist in the development of future clinical guidelines.
Our main study objective was to understand how ED care was delivered during the first wave of the novel COVID-19 pandemic when resources and therapeutics were severely limited. Specifically, we aimed to achieve this objective by characterizing the demographics, baseline comorbidities, presenting clinical tests, and outcomes of patients with suspected COVID-19 who were discharged from an academic healthcare system at the epicenter of the pandemic. Understanding this information is vital in identifying patients who were at the highest risk of returning to the ED potentially due to worsening COVID-19 infection. Findings from this study may also highlight those patients who were safely discharged from the ED despite the acuity of their presenting complaint. This investigation can assist healthcare systems in developing future disaster protocols and allocating limited resources.
MATERIALS AND METHODS Study Design and Setting
This was a retrospective chart review of consecutive patients with suspected COVID-19 who were seen in one of 14 EDs at 13 hospitals within an integrated healthcare network. This health system serves approximately 11 million persons in the New York City metropolitan area. The study was performed with institutional review board approval and waiver of informed consent. As a general quality metric, EDs track patients who return for a second visit to the ED within 72 hours to assess possible misdiagnosis or treatment failures. Due to the availability of this metric in our health
Population Health Research Capsule
What do we already know about this issue?
There is limited data about discharged patients from the emergency department (ED) and those at risk for requiring further care due to progression of disease.
What was the research question?
We sought to identify factors that increased the risk of coronavirus disease 2019 (COVID-19) patients returning to the hospital within 72 hours.
What was the major finding of the study?
2.9% returned within 72 hours and 95% were then admitted. Patients with increased age (OR 1.37 per decade), abnormal temperature (OR 2.43), and abnormal chest radiograph (OR 2.54) are at higher odds of returning to the ED.
How does this improve population health?
Our findings can help emergency physicians and outpatient clinicians caring for suspected COVID-19 patients, as most can be treated as an outpatient.
system and in other health systems, we specifically assessed the characteristics of patients with suspected COVID-19 who returned to the ED within 72 hours of discharge and who required hospital admission on their second visit. Patients with suspected COVID-19 were included mainly because testing and delays in results were extremely limited during this period with turnaround times of 72-96 hours. Thus, patients’ COVID-19 status was not known at the time of disposition.
Patients were included if they had an initial ED visit between March 2–April 27, 2020. This timeframe represents a bell curve of cases that presented to the ED during the initial surge of the COVID-19 pandemic in the New York City metropolitan area. The EDs were classified based on their available services and included one freestanding ED, six community EDs, six tertiary EDs, and one tertiary pediatric ED. We selected these 14 EDs because they use the same electronic health record (EHR) (Sunrise Emergency Care, Allscripts Healthcare Solutions, Inc., Chicago, IL).
Selection of Participants
We collected data on consecutive adult patients ≥18 years with suspected COVID-19 who were discharged from the ED. To determine suspicion of COVID-19, participants needed to meet two criteria. The first criteria for inclusion was presentation to the ED with a chief complaint related to “viral illness” (See Table 1). The second criteria for inclusion was documentation of either a COVID-19-related discharge
Western Journal of Emergency Medicine 406 Volume 24, NO.3: May 2023
First Wave Gong et al.
During
Gong
Characteristics of Suspected COVID-19 Patients Who Returned During First Wave
diagnosis or discharge instructions containing verbiage such as “quarantine” or “stay at home” that started in March 2020 at the beginning of the pandemic (See Table 1 and Appendix A). For example, a patient could meet the first criteria for inclusion with an initial chief complaint of “flu.” To meet the second criteria for inclusion, the patient would need either a COVID-19-related discharge diagnosis or a set of discharge instructions containing phrases such as “quarantine,” “14day,” or “stay at home.”
Patients could have an ICD-10 discharge diagnosis of “pain” or “headache” that was not COVID-19 related, but their discharge instructions contained pandemic-related verbiage, which meets the second criteria for inclusion. Or, they could have a COVID-19 related discharge diagnosis of “COVID-19” and have discharge instructions that did not contain pandemic-related verbiage. Discharge from the ED was defined as having an ED disposition of “discharged” or “left against medical advice.” Patients were excluded if they were registered in the ED and left without being seen by a clinician or were admitted or transferred on their first visit. Included patients were divided into two cohorts: 1) patients who did not return within 72 hours; and 2) patients who returned within 72 hours.
Measurements and Outcomes
We collected initial triage vital signs and discharge vital signs. Vital signs were classified as normal–yes or no–based upon clinical relevance (See Appendix B). To account for the possibility of improvement or worsening of vital signs after administration of therapies, multiple categories were identified for each patient: normal to normal; normal to abnormal; abnormal to normal; and abnormal to abnormal. Laboratory test variables from a patient’s first visit were classified either as a normal value, an abnormal high value, or an abnormal low value depending on clinical significance. Laboratory testing was based upon the treating clinician’s discretion, and well-presenting patients may not have required laboratory values. If a laboratory test was not ordered at the discretion of the clinician, it was classified as “not ordered.” These “not ordered” laboratory values had no impact on the decision to discharge the patient as the values were not available to the clinicians at the time of disposition decision. These values were assumed to be normal had they had been officially ordered, and thus were classified as such.
coronavirus disease 2019; ICD-10-CM, International Classification of
10th Revision, Clinical Modification.
Findings from chest radiograph (CXR) reports from the initial ED visit were extracted and then analyzed using a natural language processing computer model developed by our institution’s radiology department. The model was built in a stepwise iterative method. An initial model was designed by asking radiologists for common terms used to describe common lung pathology or the absence of lung pathology and review of 100 cases by manual annotation of key terms and phrases. This served as the initial model. Three random samples of 100 studies were annotated by two radiologists
Volume 24, NO.3: May 2023 407 Western Journal of Emergency Medicine
et al.
No. (%) Inclusion criteria description chief complaint relating to viral illness Flu 4,528 (24.35%) Fever 4,372 (23.51%) Cough 3,870 (20.81%) Shortness of breath 3,223 (17.33%) Chest pain 741 (3.98%) COVID-19 469 (2.52%) Cold 226 (1.22%) Upper respiratory infection 46 (0.25%) Category of discharge diagnosis based on ICD-10-CM codes designated by clinician Signs and symptoms involving the respiratory system 4,317 (23.21%) General symptoms and signs 3,353 (18.03%) Infectious and communicable diseases 2,873 (15.45%) Flu-like symptoms including fever, malaise, fatigue, dizziness 2,337 (12.57%) No ICD-10 code available 2,275 (12.23%) Respiratory infection 2,127 (11.44%) COVID-19 331 (1.78%) Pain 282 (1.52%) Signs and symptoms involving the gastrointestinal system 233 (1.25%) Encounter for other disease, disorder, or symptom 154 (0.83%) Headache 77 (0.41%) Signs and symptoms involving the circulatory system 54 (0.29%) Other symptoms and signs involving the circulatory and respiratory system 43 (0.23%) Syncope and collapse 41 (0.22%) Signs and symptoms of mental and behavioral disorders 22 (0.12%) Abnormal findings through testing and on examination 20 (0.11%) Signs and symptoms involving the musculoskeletal system 20 (0.11%) Injuries and environmental health hazards 16 (0.09%) Disturbances of smell and taste 12 (0.06%) Encounter for circumstances and disorders related to maternal care, pregnancy, and reproduction 10 (0.05%) Complications of surgical and medical care, not elsewhere classified 2
Table 1. Inclusion criteria met by study sample (N=18,599).
COVID-19,
Diseases,
Characteristics of Suspected COVID-19 Patients Who Returned During First Wave
(MAB, SLC) in a binary fashion (pathology/no pathology). The same annotated reports were then analyzed by the model with discrepancies analyzed by MAB and SLC.
The model was then manipulated after each of the three rounds of 100 studies to account for these discrepancies and additional phrases. This process (annotation followed by model testing) was then repeated until a threshold accuracy rate of >94% was achieved on all three samples of 100 cases within the iteration. Once the threshold was reached, the model was considered complete, and model statistics were tested on a random sample of 10 sets of 100 cases. In this set of 1,000 annotated cases, the model had an accuracy rate of 96.6%.
Analysis
We divided the included patients into two cohorts: patients discharged with no return within 72 hours; and patients discharged with a return visit within 72 hours. Predictor variables from each patient’s first visit were used to determine the predictors of a return to the ED within 72 hours.
Continuous variables are described by mean and standard deviation or median and interquartile range (IQR). Frequency counts and percentages are reported for categorical variables. Predictor variable importance was initially determined by testing the univariable associations between each variable and return to the ED within 72 hours. Age was tested using logistic regression, and categorical variables were tested using chisquare and Fisher exact tests. Predictor variables were selected for relevance if the P-value from this initial test was P < 0.1.
Next, predictors meeting this threshold were entered into a multivariable logistic regression model that was refined using backward elimination. Backward elimination continued until tests of association between each predictor variable in the model and return to the ED within 72 hours had P-values of P < 0.05. We performed logistic regression models using the identified important predictor variables to evaluate their association with return to the ED within 72 hours status. We classified laboratory variables into normal or missing, abnormal high, or abnormal low depending on clinical significance. All statistical analyses were performed using SAS software version 9.4 (SAS Institute Inc, Cary, NC).
RESULTS
Characteristics of Study Subjects
A total of 81,321 patients were seen in the ED during the study period, of whom 27,144 were identified as having a chief complaint of “viral illness” and 18,599 were identified as having “suspected COVID-19” as per our inclusion definitions. A total of 18,599 patients met the inclusion criteria.
The demographic distribution of included patients is shown in Table 2 and 3. The median age of patients who met inclusion criteria was 46 years (IQR 34-58, range 18-104). The gender distribution was 50.74% female (9,437), and 49.26%
Western Journal of Emergency Medicine 408 Volume 24, NO.3: May 2023
et al.
Gong
Demographic information No. (%) Age, median (IQR), [Range] 46, (34-58), [18-104] Gender Female 9,437 (50.74%) Male 9,162 (49.26%) Race Black 3,287 (17.67%) Asian 1,499 (8.06%) White 6,365 (34.22%) Native American/Alaskan/ Hawaiian/Pacific Islander/ unknown 1,222 (6.57%) Other/multiracial 6,226 (33.47%) Ethnicity Hispanic or Latinx 5,384 (28.95%) Not Hispanic or Latinx 11,677 (62.78%) Unknown 1,538 (8.27%) Prior hospitalization within past 6 months 0 17,304 (93.04%) 1-2 1,137 (6.11%) ≥3 158 (0.58%) Insurance Commercial 13,983 (75.18%) Medicaid 869 (4.67%) Medicare 1,322 (7.11%) Other/unknown 114 (0.61%) Self-pay/uninsured 2,311 (12.43%) ESI Triage Level 1 16 (0.09%) 2 2,386 (12.83%) 3 9,722 (52.27%) 4 6,312 (33.94%) 5 163 (0.88%) Language English 14,694 (79.00%) Spanish 2,871 (15.44%) Other 576 (3.10%) Unknown 458 (2.46%) Medical history Cancer 573 (3.08%) Chronic pulmonary disease 21 (0.11%) Cardiovascular disease 1,130 (6.08%) COVID-19 15 (0.08%) IQR, interquartile range; ESI, Emergency Severity Index; COVID-19, coronavirus disease 2019.
Table 2. Demographic characteristics of patients with suspected COVID-19 (N=18,599).
Gong et
Characteristics of Suspected COVID-19 Patients Who Returned During First Wave
or renal disease were more likely to return at 72 hours. Patients with persistently abnormal temperature (OR 2.43, 95% CI 1.83.2) and respiratory rate (2.17, 95% CI 1.6-3.0) were more likely to return within 72 hours. Abnormal systolic blood pressure at triage or at discharge had lower odds of returning for evaluation. Of the laboratory tests, abnormally high neutrophil counts, abnormally elevated bicarbonate, abnormally low platelets, and abnormally elevated aspartate aminotransferase (AST) were associated with a higher rate of return within 72 hours (Table 3). Furthermore, patients with an abnormal CXR had higher odds of return admission (OR 2.54, 95% CI 2.0-3.2).
Among all patients, those discharged on antibiotics (2.77% of our study population) were significantly less likely to return at 72 hours (OR 0.12, 95% CI 0.0–0.3). Of the 516 patients who were discharged on antibiotics, five returned within 72 hours. Similarly, those discharged on corticosteroids (2.23% of the study population) were significantly less likely to return at 72 hours (OR 0.12, 95% CI 0.02-0.9). Of the 415 patients who received corticosteroids, only one patient (0.24%) returned within 72 hours.
DISCUSSION
CVA, cerebral vascular accident; TIA, transient ischemic attack; BMI,
male (9,162). Most patients identified as not Hispanic or Latino (62.78%; 11,677) and the remaining were Hispanic or Latino (28.95%; 5,384) or of unknown ethnicity (8.27%; 1,538). With regard to race, 34.22% (6,365) of patients were White, 33.47% (6,226) identified as other/multiracial, 17.67% (3,287) were Black, 8.06% (1,499) were Asian, and 6.57% (1,222) were Native American/Alaskan/ Hawaiian/Pacific Islander/unknown. Most patients were insured through commercial insurance including private insurance, insurance through an employer, or managed care (75.18%, 13,983).
Of the 18,599 patients identified, 532 (2.86%) returned to the ED within 72 hours from their initial visit (See Figure 1a). The admission rate was 95.49% (508/532) for those who returned within 72 hours. Of these patients who were admitted to the hospital on their second visit, 73 (13.72%) were admitted to the intensive care unit (ICU). Historical data from 2019 showed a 72-hour return rate for patients presenting with respiratory symptoms of 1.42% and an admission rate of 93.68% on the second ED visit (See Figure 1b).
Males had significantly higher odds of return within 72 hours (odds ratio [OR] 1.41, 95% CI 1.2-1.7) (Table 3). Older patients had greater odds of returning than younger patients (10-year increment: OR 1.37, 95% CI 1.3-1.5 for 72-hour return). With regard to chief complaints and past medical history, patients with chief complaints of “fever” or “flu” or with a history of diabetes
Despite the lack of evidence-based clinical guidelines in the ED setting during the initial surge in the New York City metropolitan area, our study found that the return rate was relatively low (<3%). While our sample looked at return rates within three days, two other studies by Husain et al and Berdahl et al noted return rates of 13.7% within 14 days and 24.7% within 30 days during this initial surge, respectively.28,29 Further, our admission rate for return patients presenting with respiratory concerns was lower when compared to the year prior. Considering the unprecedented circumstances and the novel presenting features of COVID-19, the admission rate was much lower than expected.
Our lower admission rates could be explained by the lack of availability of inpatient beds and the overall volume of critically ill patients, which necessitated discharge of patients who were stable. Disposition decisions for suspected COVID-19 patients were based largely on available vital signs, clinical gestalt, and laboratory results. Our findings further establish that despite not having definitive confirmation of COVID-19, emergency physicians can base their clinical decisions on results from more widely available resources to discharge patients, even with a novel disease. Moreover, our low return rate signifies that patients who were safe for discharge were reliably identified, which speaks volumes for potentially subsequent waves and future disasters.
Vital sign abnormalities in respiratory rate and temperature increased the odds of return to the ED in patients with suspected COVID-19. Of those within our analysis, persistent abnormal respiratory rate and temperature were noted to have the largest effect. While temperature is a concrete variable, respiratory rate can be subjective and at times undermeasured, it is important to highlight the effect on a patient of persistently abnormal
Volume 24, NO.3: May 2023 409 Western Journal of Emergency Medicine
al.
Demographic information No. (%) CVA/TIA 179 (0.96%) Diabetes 1,702 (9.15%) Gastrointestinal disorder 150 (0.81%) Hematologic 22 (0.12%) Hypertension 3,209 (17.25%) Immunologic disease 115 (0.62%) Obesity 378 (2.03%) Pulmonary disease 1,715 (9.22%) Renal disease 138 (0.74%) Smoking 36 (0.19%) Transplant 10 (0.05%) Venous thrombotic disease 193 (1.04%) BMI Class Missing/unknown 8,436 (45.36%) Underweight 123 (0.66%) Normal weight 2,596 (13.96%) Pre-obesity 3,845 (20.67%) Obesity class I 2,213 (11.90%) Obesity class II 864 (4.65%) Obesity class III 522 (2.81% Table 2. Continued.
mass
body
index.
Characteristics of Suspected COVID-19 Patients Who Returned During First Wave
Table 3. Odds ratio estimates for multivariate analysis: 72-hour return.
The area under the receiver operating characteristic curve for the regression model was 0.84. ESI, Emergency Severity Index; BP, blood pressure.
Western Journal of Emergency Medicine 410 Volume 24, NO.3: May 2023
et al.
Gong
Effect Point estimate 95% Wald confidence limits Age (Estimate x [n] year) 1.03 1.03 1.04 Age (Estimate x 10 [n] year) 1.37 1.28 1.47 Gender Female 1.00 (Reference) Male 1.41 1.17 1.70 Insurance status Employee/managed care 1.00 (Reference) Medicaid 1.23 0.82 1.83 Medicare 0.66 0.49 0.90 Other/unknown 1.89 0.74 4.83 Self-pay/uninsured 0.64 0.45 0.92 Initial chief complaint Fever Not present 1.00 (Reference) Present 1.78 1.44 2.20 Flu Not present 1.00 (Reference) Present 1.56 1.20 2.01 Past medical history Diabetes Not present 1.00 (Reference) Present 1.33 1.04 1.69 Renal Not present 1.00 (Reference) Present 2.07 1.14 3.76 Number of hospitalizations within past 6 months 0 1.00 (Reference) 1-2 1.63 1.21 2.18 ≥3 1.51 0.80 2.88 Triage ESI Level 1 5.34 1.07 26.55 2 1.29 1.03 1.62 3 1.00 (Reference) 4 0.69 0.51 0.92 5 0.52 0.07 3.77 Vital signs from triage to discharge Temperature Normal to normal 1.00 (Reference) Abnormal to abnormal 2.43 1.83 3.218 Abnormal to normal 1.65 1.26 2.16 Normal to abnormal 1.78 1.06 2.98 Systolic BP Normal to normal 1.00 (Reference)
Gong et al.
Characteristics of Suspected COVID-19 Patients Who Returned During First Wave
respiratory rate, possibly as a sign of potential decompensation from this respiratory illness. We found that abnormalities in heart rates were not associated with increased odds of return, which differs from Husain et al and Margus et al.28,29 The Margus et al
Volume 24, NO.3: May 2023 411 Western Journal of Emergency Medicine
Effect Point estimate 95% Wald confidence limits Abnormal to abnormal 0.68 0.53 0.86 Abnormal to normal 0.68 0.51 0.92 Normal to abnormal 0.72 0.43 1.18 Respiratory rate Normal to normal 1.00 (Reference) Abnormal to abnormal 2.17 1.57 3.00 Abnormal to normal 1.57 1.15 2.14 Normal to abnormal 1.17 0.64 2.13 Radiology findings of chest radiograph Normal 1.00 (Reference) Abnormal 2.54 2.00 3.22 Not done 0.93 0.70 1.22 Therapies administered Antibiotics in the ED Not administered 1.00 (Reference) Administered 1.52 1.11 2.07 Discharged on antibiotics Not discharged on antibiotics 1.00 (Reference) Discharged on antibiotics 0.12 0.05 0.30 Discharged on corticosteroids Not Discharged on corticosteroids 1.00 (Reference) Discharged on corticosteroids 0.12 0.02 0.89 Laboratory values AST Normal/missing 1.00 (Reference) High 1.63 1.30 2.07 Bicarbonate Normal/missing 1.00 (Reference) High 4.66 1.84 11.79 Low 1.98 0.62 6.35 Neutrophils Normal 1.00 (Reference) Low 0.31 0.08 1.31 High 1.32 1.03 1.69 Platelets Normal 1.00 (Reference) Low 1.68 1.19 2.38 High 0.64 0.23 1.80 Disposition on first visit Discharge 1.00 (Reference) Against medical advice 2.97 1.29 6.84 ED, emergency department; AST, aspartate aminotransferase; CRP, C-reactive protein. Table 3. Continued.
Characteristics of Suspected COVID-19 Patients Who Returned
high AST, neutrophil counts, and bicarbonate level and abnormally low platelet counts were also indicative of a higher rate of return. This finding of transaminitis was also found to be a predictor for return in the sample from Husain et al.28 While each individual finding may have impact on the likelihood of return to the ED, the composite results of this study may lead toward prospective scoring tools that can better guide the clinician on disposition decisions for patients who present with COVID-19.
Among patients who did return to the ED within 72 hours, we found the subsequent admission rate to be almost 96%. In comparison to our data from 2019 for those patients presenting with respiratory symptoms, our system admitted a similar percentage (93.7%) of patients. More specifically, these patients who returned were noted to have significantly worsening symptoms, with approximately 13.7% requiring an ICU admission. This is consistent with the inpatient data published during the earlier surge with the finding that14.2% were treated in the ICU.30 Our study identifies factors that increases the odds for returning to the ED and admission to the hospital for patients with suspected COVID-19. The natural disease progression of COVID-19, like many other infectious respiratory illnesses, has the possibility of a patient requiring ICU admission and mechanical ventilation.
COVID-19, coronavirus 2019; ED, emergency department.
study differs in methodology from our paper and that of Husain et al in that the Margus study was a nested control trial, where patients were matched who returned within 72 hours. While bradycardia and tachycardia may clinically differ in a clinician’s decision-making, our analysis of the unadjusted rates of return was higher for patients with either bradycardia or tachycardia. This further supports grouping heart rate abnormalities together as abnormal.
Systolic blood pressure (BP) abnormalities decreased the likelihood of returning to the ED within 72 hours. Systolic BPs (SBP) that were not normal were defined as anything outside of the 90-140 range (Appendix B). Only 53 patients of this group were hypotensive during their ED stay, and only five of the 53 were noted to have returned within 72 hours. We were unable to separate the abnormal into high and low given the small number of hypotensive patients in this large sample, with hypotensive patients representing 0.28%. Thus, clinical judgment should be used when discharging patients who experienced hypotension during their ED stay. Patients presenting with hypertension, which was initially thought of as a predisposing factor based upon past medical history for worse outcomes, were noted to have a lower return rate, which also is contrary to Margus et al.
Diagnostic tests such as laboratory values and imaging can also impact the clinician’s disposition decision. Abnormal lung findings on a CXR increased the odds of return within 72 hours, similar to Margus et al. More subtle findings of an abnormally
Other studies have also looked at clinical factors in the ED that could be predictive of worse outcomes or return to the ED. In our study, older age, abnormal temperature readings, increased respiratory rate, and abnormal CXRs predicted return in 72 hours. These results were similar to a recent study by Kilaru et al12 and to the discharge criteria used by Berdahl et al. In Kilaru’s study, only confirmed COVID-19 patients (1,419) were included, and their findings were similar with abnormal temperature, oxygen saturation, and CXR, and older age (>60 years) having higher odds of return within 72 hours (66 patients) or 7 days (117).12 The findings in our study support some of the findings in these prior studies. Unlike the Kilaru study, we did not restrict our study population to patients with confirmed COVID-19. Instead, we included any patients under investigation for COVID-19 based upon chief complaints, discharge diagnoses, and discharge instructions related to COVID-19. During our study, only 7,941/18,599 patients (42.70%) were tested for COVID-19, of whom 4,704 (59.24%) tested positive (See Table 2). Testing for COVID-19 was a non-contributing factor in the disposition decision-making for the treating emergency physician, as these results were not available for 24-48 hours for the study period. Factors such as abnormal oxygen saturation, advanced age, abnormal temperature, and CXR results appear to be markers of COVID-19 disease severity.
Although the sample size is small, we must note the significantly decreased odds of returning within 72 hours for patients discharged on corticosteroids and antibiotics. During the study period, health system guidelines initially warned against the use of steroids, which was later changed upon identification of the inflammatory phase of the COVID-19 infection. These findings support early data on COVID-19-hospitalized patients


Western Journal of Emergency Medicine 412 Volume 24, NO.3: May 2023
First Wave Gong et al. 2019 Historical Data for Patients Presenting with Respiratory Symptoms Returned to the ED within 72 hours (1.42%) Admitted to the Hospital During the Second ED Visit (93.68%) B Patients with Chief Complaint Related to Viral Illness (N=27,144) Excluded Patients with Discharge Diagnosis and Instructions Not Related to COVID-19 (n=8,545) Included Patients with Discharge Diagnosis or Instructions Related to COVID-19 (n=18,599) Returned to the ED within 72 hours (n=532, 2.86%) Admitted to the Hospital During Their Second Visit (n=508, 95.49%) Admitted to the ICU During Their Second Visit (n=73, 13.72%) Did Not Return within 72 hours (n=18,067, 97.14%) A.
During
Figure 1. A. Eligibility criteria for study sample (N=18,599). B. Historical data on emergency department 72-hour return and admission from 2019 for patients presenting with respiratory symptoms.
requiring supplemental oxygen that showed corticosteroids could be beneficial. Currently, corticosteroids are a key therapy for hospitalized patients who require oxygen. More research is needed to evaluate the effect of corticosteroids for patients who are seen for COVID-19 in the ED or outpatient setting.13 Recent studies on the impact of antibiotics on COVID-19 have shown a lack of efficacy. However, in our small sample of patients who received antibiotics at discharge, the odds of return were also reduced. Given that our current sample is not fully composed of COVID-19 cases, administration of antibiotics and steroids could be effective in treating alternative diagnoses, like bacterial etiologies of infection.
Our study adds to the limited literature that describes patients who presented to the ED during the initial wave of COVID-19 in the New York City metropolitan area. Our study supports using clinically available data for clinicians to discharge suspected COVID-19 patients. However, given the nature of COVID-19 and the natural progression of the disease, strict return precautions must be provided to patients. Before these studies, risk factors were primarily extrapolated from in-patient studies, and based on experiences in China, Europe, and other countries that were affected by the pandemic before the US.8,12,14-26 Our study supports that many risk factors for severe disease found in hospitalized patients—older age and abnormal temperature, tachypnea, and CXR—were also present in discharged ED patients with suspected or confirmed COVID-19 who had higher odds of returning to the ED within 72 hours.14-16,27
LIMITATIONS
While this retrospective cohort study allows us to identify associations between patient characteristics and return to the ED, it does not permit conclusions related to causality. This study was performed at a single health system in the Northeast, so our findings may not reflect national or international populations. They may have had a 72-hour return to an ED at different health system, death, or other morbidity that was not captured within the EHR shared by the 14 EDs from which we collected data. Further, neither do we know how mortality rates among those who returned within 72 hours compared to those who were initially admitted with COVID-19, information that could have provided deeper clinical insight into the effects of discharge.
Emergency departments track 72-hour returns as a quality measure and can be indicative for possible misdiagnosis and or treatment failures. Given the pathogenesis of COVID-19, 72-hour return may not encompass the progression of the COVID-19 disease process, although patients may present to the ED at different points during their disease. Their first visit could be on day 1 or 10 of symptoms; thus, allowing for a 72hour return could allow for varying sequelae of COVID-19 depending on the day of their presentation. Husain et al and Berdhal et al extended the window of follow-up to 14 and 30 days, respectively; however, these follow-up windows may be more indicative of other pathology rather than the acute viral
phase of COVID-19. Furthermore, we are not advocating that these patients require admission for that length of time.30,31 Within the 72-hour window, certain sequelae of COVID-19 may be missed, such as bacterial super-infections, deep vein thromboses, and neurologic complications that were seen as late complications of COVID-19.
Our cohort included patients based on presenting symptoms consistent with COVID-19. They did not always have a COVID-19 test to confirm the diagnosis, as the testing platform was limited at that time. Within our cohort that was tested, the positivity rate was 59.24%, although it must be noted that during the study period the accuracy of the polymerase chain reaction tests was evolving; some patients required multiple tests and were clinically treated as having COVID-19. Furthermore, with regard to our findings regarding who did not return after receiving antibiotics, some of these patients may have been treated for bacterial etiologies, which may explain their low return rate.
One of our assumptions in our regression analysis was that patients who did not have lab tests ordered, and thus had no reported values, were classified as normal. This assumption was made because clinicians did not deem the tests to be relevant to the patient’s diagnosis or disposition. As these tests were not available upon discharge, it did not contribute to the overall decision-making process regarding the patient’s disposition. Patients in these instances were presenting overall well-appearing, and during a time of limited resources, ordering such tests was unnecessary. In addition, our analytical testing indicated that separating those patients who did not have labs ordered into their own category resulted in unstable modeling estimates, therefore necessitating the combining of categories. Because of this, there is the potential that some patients were misclassified. However, we believe this proportion to be low and to have not influenced our estimates in any meaningful way.
CONCLUSION
During the initial surge of the pandemic in the New York City metropolitan area, there was limited knowledge of COVID-19 and its clinical course in patients who presented to the ED. Despite this lack of knowledge, our 72-hour return rate was relatively low, even with an extremely high rate of patients who were presenting with COVID-19. As COVID-19 diagnostic tools and treatment algorithms evolve, we need to better understand the factors that may contribute to a patient returning to the ED. As many patients with COVID-19 can be discharged at the initial time of evaluation, programs and follow-up procedures tailored to these patients should be implemented and investigated.
ACKNOWLEDGMENTS
We would like to acknowledge the contributions of the Northwell Health COVID-19 Research Consortium, including Crystal R. Herron, PhD, for editorial support.
Volume 24, NO.3: May 2023 413 Western Journal of Emergency Medicine
et al. Characteristics
Patients
During First Wave
Gong
of Suspected COVID-19
Who Returned
Characteristics of Suspected COVID-19 Patients Who Returned During First Wave Gong
We acknowledge all our Northwell team members who consistently put themselves in harm’s way to care for our patients during the COVID-19 pandemic.
Northwell COVID-19 Research Consortium
John D’Angelo, MD††, Molly McCann-Pineo, PhD, MS*, Richard Tang, MD*, Roseanne O’Gara-Shubinsky, RN§§, Matthew Pinkus, MBA§§, Kerry Lin, MS§§, Yves Duroseau, MD||||, Shruti Koti##, Sharon Klein##, Charlotte Kvasnovsky, MD‡‡, Jennifer Cookingham**, Timmy Li, PhD*, David Hirschwerk, MD¶, and Lance Becker, MD*
¶Donald & Barbara Zucker School of Medicine at Hofstra/ Northwell, Department of Medicine, Division of Infectious Diseases, Hempstead, New York
**Feinstein Institutes for Medical Research, Center for Personalized Health, Great Neck, New York
††Donald & Barbara Zucker School of Medicine at Hofstra/ Northwell, Northwell Health, Emergency Medicine Services, New Hyde Park, New York
‡‡Cohen’s Children Medical Center, Northwell Health, Donald & Barbara Zucker School of Medicine at Hofstra/Northwell, Department of Surgery, New Hyde Park, New York
§§Long Island Jewish Medical Center, Northwell Health, Quality Management, New Hyde Park, New York
||||Donald & Barbara Zucker School of Medicine at Hofstra/Northwell, Lenox Hill Hospital, Northwell Health, Department of Emergency Medicine, New York, New York
##Donald & Barbara Zucker School of Medicine at Hofstra/ Northwell, Hempstead, New York
Address for Correspondence: Jonathan Gong, MD, Long Island Jewish Medical Center - Northwell Health System, Department of Emergency Medicine, 270-05 76th Avenue, New Hyde Park, NY 11040. Email: JGong1@northwell.edu.
Conflicts of Interest: By the WestJEM article submission agreement, all authors are required to disclose all affiliations, funding sources and financial or management relationships that could be perceived as potential sources of bias. Funding for this work was supported by grants R24AG064191 from the National Institute on Aging of the National Institutes of Health (NIH) and R01LM012836 from the National Library of Medicine of the NIH. The funders had no role in the design and conduct of the study; collection, management, analysis, and interpretation of the data; preparation, review, or approval of the manuscript; or decision to submit the manuscript for publication. The views expressed in this paper are those of the authors and do not represent the views of the NIH, the US Department of Health and Human Services, or any other government entity. There are no conflicts of interest to declare.
Copyright: © 2023 Gong et al. This is an open access article distributed in accordance with the terms of the Creative Commons Attribution (CC BY 4.0) License. See: http://creativecommons.org/ licenses/by/4.0/
REFERENCES
1. WHO Director-General’s opening remarks at the media briefing on COVID-19 - 11 March 2020. World Health Organization, 2020. Available at: https://www.who.int/dg/speeches/detail/who-directorgeneral-s-opening-remarks-at-the-media-briefing-on-covid-19---11march-2020. Accessed August 15, 2020.
2. NYSDOH Covid-19 Tracker. NYSDOH, 2020. Available at: https:// coronavirus.health.ny.gov/positive-tests-over-time-region-and-county Accessed June 1, 2020.
3. Centers for Disease Control and Prevention. United States COVID-19 Cases and Deaths by State. 2020. Available at: https://www.cdc.gov/ covid-data-tracker/#cases. Accessed June 1, 2020.
4. Silver, Nate. Has New York bent the curve? 2020. Available at: https://fivethirtyeight.com/features/new-york-coronavirus-curve/ Accessed June 1, 2020.
5. Guan WJ, Ni ZY, Hu Y, et al. Clinical characteristics of coronavirus disease 2019 in China. N Engl J Med 2020;382:1708-20.
6. Wu Z, McGoogan JM. Characteristics of and important lessons from the coronavirus disease 2019 (COVID-19) outbreak in China: summary of a report of 72314 cases from the Chinese Center for Disease Control and Prevention. JAMA. 2020;323:1239-42.
7. Zhou F, Yu T, Du R, et al. Clinical course and risk factors for mortality of adult inpatients with COVID-19 in Wuhan, China: a retrospective cohort study. Lancet. 2020;395:1054-62.
8. Ruan Q, Yang K, Wang W, et al. Correction to: clinical predictors of mortality due to Covid-19 based on an analysis of data of 150 patients from Wuhan, China. Intensive Care Med. 2020;46:1294-7.
9. Ruan Q, Yang K, Wang W, et al. Clinical predictors of mortality due to COVID-19 based on an analysis of data of 150 patients from Wuhan, China. Intensive Care Med. 2020;46:846-8.
10. Akhavan AH, Habboushe JP, Gulati, R, et al. Risk stratification of COVID-19 patients using ambulatory oxygen saturation in the emergency department. West J Emerg Med. 2020;21(6):5-14.
11. Peyrony O, Marbeuf-Gueye C, Truong V, et al. Accuracy of emergency department clinical findings for diagnosis of coronavirus disease 2019. Ann Emerg Med. 2020;76:405-12.
12. Kilaru AS, Lee K, Snider CK, et al. Return hospital admissions among 1419 COVID-19 patients discharged from five U.S. emergency departments. Acad Emerg Med. 2020;27:1039-42.
13. Feldstein LR, Rose EB, Horwitz SM, et al. Multisystem inflammatory syndrome in U.S. children and adolescents. N Engl J Med. 2020;383:334-46.
14. RECOVERY Collaborative Group, Horby P, Lim WS, et al. Dexamethasone in hospitalized patients with COVID-19. N Engl J Med. 2021;384(8):693-704.
15. Zheng Z, Peng F, Xu B, et al. Risk factors of critical and mortal COVID-19 cases: a systematic literature review and meta-analysis. J Infect 2020;81:e16-e25.
16. Huang C, Wang Y, Li X, et al. Clinical features of patients infected with 2019 novel coronavirus in Wuhan, China. Lancet. 2020;395:497-506.
Western Journal of Emergency Medicine 414 Volume 24, NO.3: May 2023
al.
et
17. Huang D, Lian X, Song F, et al. Clinical features of severe patients infected with 2019 novel coronavirus: a systematic review and metaanalysis. Ann Transl Med. 2020;8:576.
18. Mo P, Xing Y, Xiao Y, et al. Clinical characteristics of refractory COVID-19 pneumonia in Wuhan, China. Clin Infect Dis. 2021;73(11):e4208-13.
19. Shi Y, Yu X, Zhao H, et al. Host susceptibility to severe COVID-19 and establishment of a host risk score: findings of 487 cases outside Wuhan. Crit Care. 2020;24:108.
20. Peng YD, Meng K, Guan HQ, et al. [Clinical characteristics and outcomes of 112 cardiovascular disease patients infected by 2019nCoV]. Zhonghua Xin Xue Guan Bing Za Zhi. 2020;48:450-5.
21. Wang D, Hu B, Hu C, et al. Clinical characteristics of 138 hospitalized patients with 2019 novel coronavirus-infected pneumonia in Wuhan, China. JAMA. 2020;323:1061-9.
22. Wang Z, Yang B, Li Q, et al. Clinical features of 69 cases with coronavirus disease 2019 in Wuhan, China. Clin Infect Dis. 2020;71:769-77.
23. Tang N, Li D, Wang X, et al. Abnormal coagulation parameters are associated with poor prognosis in patients with novel coronavirus pneumonia. J Thromb Haemost. 2020;18:844-7.
24. Tian S, Hu N, Lou J, et al. Characteristics of COVID-19 infection in Beijing. J Infect. 2020;80:401-6.
25. Wu C, Chen X, Cai Y, et al. Risk Factors associated with acute respiratory distress syndrome and death in patients with coronavirus
disease 2019 pneumonia in Wuhan, China. JAMA Intern Med. 2020;180:934-43.
26. Yang X, Yu Y, Xu J, et al. Clinical course and outcomes of critically ill patients with SARS-CoV-2 pneumonia in Wuhan, China: a singlecentered, retrospective, observational study. Lancet Respir Med. 2020;8:475-81.
27. Husain I, O’Neill J, Mudge R, et al. Clinical characteristics associated with return visits to the emergency department after Covid-19 diagnosis. West J Emerg Med. 2021;22(6):1257-61.
28. Margus C, Sondheim SE, Peck NM, et al. Discharge in pandemic: suspected Covid-19 patients returning to the emergency department within 72 hours for admission. Am J Emerg Med. 2021;45:185-91.
29. De Vito A, Geremia N, Fiore V, et al. Clinical features, laboratory findings and predictors of death in hospitalized patients with COVID-19 in Sardinia, Italy. Eur Rev Med Pharmacol Sci. 2020;24:7861-8.
30. Berdahl CT, Glennon NC, Henreid AJ, et al. The safety of home discharge for low-risk emergency department patients presenting with coronavirus-like symptoms during the COVID-19 pandemic: a retrospective cohort study. J Am Coll Emerg Physicians Open 2020;1(6):1380-5.
31. Richardson S, Hirsch JS, Narasimhan M, et al. Presenting characteristics, comorbidities, and outcomes among 5700 patients hospitalized with COVID-19 in the New York City area. JAMA 2020;323(20):2052–9.
Volume 24, NO.3: May 2023 415 Western Journal of Emergency Medicine
al.
First Wave
Gong et
Characteristics of Suspected COVID-19 Patients Who Returned During
Association of Early Serum
Phosphate Levels and Mortality in Patients with Sepsis
Lauren Page Black, MD, MPH*
Michael Mohseni, MD†
Ehsan Shirazi, MD†
Kasondra Hartman, MD*
Carmen Smotherman, MS‡
Charlotte Hopson, MS*
Elizabeth DeVos, MD, MPH*
Rosemarie Fernandez, MD§
Johnathan Sheele, MD, MHS, MPH†
Faheem Guirgis, MD*
Section Editor: Eric Melnychuk, DO
University of Florida College of Medicine - Jacksonville, Department of Emergency Medicine, Jacksonville, Florida
Mayo Clinic, Department of Emergency Medicine, Jacksonville, Florida
University of Florida Health Jacksonville, Center for Data Solutions, Jacksonville, Florida
University of Florida College of Medicine, Department of Emergency Medicine, Gainesville, Florida
Submission history: Submitted October 13, 2022; Revision received January 31, 2023; Accepted February 4, 2023
Electronically published April 28, 2023
Full text available through open access at http://escholarship.org/uc/uciem_westjem
DOI: 10.5811/westjem.58959
Background: Metabolic derangements in sepsis influence phosphate levels, wh ich may predict mortality outcomes. We investigated the association between initial phosphate levels and 28-day mortality in patients with sepsis.
Methods: We conducted a retrospective analysis of patients with sepsis. Initial (first 24 hours) phosphate levels were divided into phosphate quartile groups for comparisons. We used repeated-measures mixed-models to assess differences in 28- day mortality across the phosphate groups, adjusting for other predictors identified by t he Least Absolute Shrinkage and Selection Operator variable selection technique.
Results: A total of 1,855 patients were included with 13% overall 28-day mortality (n=237). The highest phosphate quartile (>4.0 milligrams per deciliter [mg/dL]) had a higher mortality rate (28%) than the three lower quartiles (P<0.001). After adjustment (age, organ failure, vasopressor administration, liver disease), the highest initial phosphate was associated with increased odds of 28-day mortality. Patients in the highest phosphate quartile had 2.4 times higher odds of death than the lowest (≤2.6 mg/dL) quartile (P<0 .01), 2.6 times higher than the second (2.6-3.2 mg/dL) quartile (P<0.01), and 2.0 times higher than the third (3.2-4.0 mg/dL) quartile (P=0.04).
Conclusion: Septic patients with the highest phosphate levels had increased odds of mortality. Hyperphosphatemia may be an early indicator of disease severity and risk of adverse outcomes from sepsis. [West J Emerg Med. 2023;24(3)416–423.]
INTRODUCTION
Patients with sepsis have life-threatening organ dysfunction caused by a dysregulated host response to infection.1 Septic shock is the most severe manifestation of sepsis syndrome with increased mortality due to circulatory
and metabolic abnormalities.1 Approximately 1.7 million adults are hospitalized with sepsis per year in the United States, with a mortality rate of 15.6%.2 Early recognition and diagnosis of sepsis remain challenging due to the nonspecific diagnostic criteria for the syndrome. Consensus guidelines
Western Journal of Emergency Medicine 416 Volume 24, NO.3: May 2023 * † ‡ § Original Research
recommend prompt resuscitation with intravenous crystalloid, early administration of broad-spectrum antibiotics, and vasopressors to support blood pressure in the setting of septic shock.3 Elevated serum lactate levels are indicative of cellular dysfunction in sepsis, making hyperlactatemia a useful marker of sepsis severity.1,4–6
Other metabolic derangements occur in critically ill sepsis patients, including changes in phosphate levels. Phosphorus is a component of cell membranes, nucleic acids, and nuclear proteins. It is required for energy metabolism and intracellular signaling, and it plays a key role in regulatory mechanisms, generation of adenosine triphosphate, acid-base homeostasis, and oxygen release by hemoglobin.8,9 Phosphate derangements are, therefore, commonly expected in critically ill patients.
Hypophosphatemia has been described in sepsis, metabolic or respiratory alkalosis, refeeding syndrome, and ketoacidosis, as well as after major trauma or surgery.10 It has also been associated with increased morbidity and mortality in critically ill patients.11–13 Several studies suggest hypophosphatemia may be an early indicator of infection and increased mortality in sepsis.14,15 However, more recent studies found associations between hyperphosphatemia and increased mortality in critically ill patients with sepsis and septic shock.16,17 The direction of early phosphate derangement (high or low) and its predictive ability for mortality in sepsis remains unclear. Our primary objective in this study was to determine the association of initial phosphate levels (measured in the first 24 hours) in septic patients with 28-day mortality.
METHODS Data Source
We conducted a retrospective analysis using an existing dataset of adult patients admitted for sepsis at University of Florida Health Jacksonville, an urban, not-for-profit academic medical center. The parent study evaluated hospital sepsis outcomes before and after the implementation of a quality improvement program.18 The parent study was a retrospective analysis of patients identified by diagnosis codes for sepsis in the University of Florida Health Jacksonville electronic health record system.18 Trained research coordinators worked in concert with the biostatistician and clinician team to clean and curate the data for analysis. Our approach and reporting followed STROBE guidelines.19 The study was approved by the University of Florida Institutional Review Board with a waiver of informed consent.
The original dataset included patients admitted with any one of 28 explicit International Classification of Diseases, 9th Revision, Clinical Modification codes for sepsis (see Supplemental Information) and two or more systemic inflammatory response syndrome (SIRS) criteria between October 2013–May 2016. In 2016, the Third International Consensus Definitions for Sepsis and Septic Shock (Sepsis-3) deemphasized SIRS criteria, defining sepsis as a dysregulated response to infection. 1,4 Sepsis-3 operationalized this
Population Health Research Capsule
What do we already know about this issue?
Phosphate derangements are common in critically ill patients and may be an early indicator of infection and increased mortality in patients with sepsis.
What was the research question?
Our objective was to determine the association of initial phosphate levels in septic patients with 28-day mortality.
What was the major finding of the study?
Patients with the highest phosphate levels (4.0 mg/dL) had a higher mortality rate than those in the three lower quartiles (P<0.001).
How does this improve population health?
Hyperphosphatemia may be an early indicator of disease severity and risk of adverse outcomes from sepsis.
consensus definition as an increase in the Sequential Organ Failure Assessment (SOFA) score of two or more points.4 Therefore, we a priori planned a sub-analysis limited to patients with a SOFA score of two or more.
Exclusion and Inclusion Criteria
Patients were included in this study if they met the above study criteria for sepsis and they were in the parent dataset and had a phosphate lab result within the first 24 hours of emergency department (ED) presentation. We excluded patients who had a diagnosis of hyperparathyroidism, hypoparathyroidism, or end-stage renal disease (ESRD), as well as those patients who did not have a phosphate lab result within 24 hours of ED presentation (Figure 1).
Data Collection
We collected demographic information, clinical data, vital signs, SOFA scores, and lab values for all patient encounters. Phosphate levels collected within 24 hours of ED presentation were included for analysis. Only the initial phosphate laboratory result from each encounter was included in the analysis, as subsequent values may have been influenced by phosphate repletion, and phosphate repletion data was not available. We excluded phosphate results (reported in milligrams per deciliter [mg/dL]) that were extreme outliers
Volume 24, NO.3: May 2023 417 Western Journal of Emergency Medicine Black et al. Association of Early Serum Phosphate Levels and Mortality in Patients with Sepsis
(greater than 3 interquartile range [IQR] above the third quartile) among all phosphate lab results from the study.20 There were no extremely low outliers. The quartiles of the initial phosphate values were used as the boundaries of the four phosphate quartile groups. The primary outcome was 28day mortality.
Statistical Analysis
We summarized data using medians (first quartile, third quartile) for continuous data and using counts and percentages for categorical data. Chi-square and Wilcoxon rank-sum tests were used to compare the baseline characteristics among the phosphate quartile groups. For univariate analyses, we used data from the first encounter if the patient had multiple encounters during the study period. Repeated-measures mixed-models were used to identify predictors of 28-day mortality. We used data from all encounters for the 28-day mortality multivariable regression model with repeated-measures mixed-models to account for repeated encounters. Candidate predictors in the model were phosphate quartile group; age at first encounter (years); gender (biologic sex); race (Black, White, other);
vasopressor use (yes/no); mechanical ventilation (yes/no); history of diabetes (yes/no); history of liver disease (yes/ no); initial creatinine level during the encounter; initial calcium level during the encounter; total SOFA scor; and the interaction between creatinine and SOFA score.
Missingness was under 1% for all variables included in the logistic regression model. As a prescreening step to discard the least important model terms, the least absolute shrinkage and selection perator (LASSO)21 and least angle regression22 methods implemented in the GLMSELECT23 SAS procedure were used. The LASSO method is a penalized regression method that considers all candidate variables and reduces the coefficients of non-important variables to zero, thereby removing them from the final model. It allows us to perform comprehensive variable selection from the candidate variables and reduce multicollinearity. We determined the optimal covariance structure by fitting several covariance structures and determining the one with the lowest corrected Akaike information criterion.24 We estimated differences between groups using adjusted odds ratios (aOR), along with 95% confidence intervals. We used area under the receiver operating characteristic (ROC) curve to assess the performance of the predictive model. The level of significance was set at 5%. We performed all analyses using SAS version 9.4 for Windows (SAS Institute, Inc; Cary, NC).
RESULTS
We reviewed data from 3,297 encounters in the original dataset, representing 2,796 unique patients, for inclusion in this study. The primary reason for exclusion was a lack of phosphate levels within the first 24 hours of ED presentation (882 encounters). Other reasons for exclusion included a history of ESRD or parathyroid disorders. Finally, we excluded extremely high outlier phosphate values (phosphate >8.2 mg/dL). The final study population included 2,101 encounters, representing 1,855 unique patients (Figure 1).

The 1,855 patients admitted for sepsis had a median age of 60 years (Table 1); 51% of patients were female, 48% were Black, 47% were White, and 5% were other races. The median initial SOFA score was 2 (0, 5). Table 1 displays demographics, comorbidities, and disease severity for enrolled patients. The overall 28-day mortality rate was 13% (237).
Among all encounters for sepsis, the median phosphate level was 3.2 mg/dL, the bounds of first and third quartiles were 2.6 and 4.0 mg/dL, respectively (Table 2). The median time to initial phosphate level was 2.87 hours (quartiles 0.7, 12.8). Table 2 presents the number of patients, the mortality rate, and the distributions of phosphate levels within each quartile group by unique patients. Mortality differed among phosphate quartile groups (P <0.001). The greatest mortality rate (28%, 113) occurred in the quartile with the highest phosphate levels (> 4.0 mg/dL). The quartile with the lowest phosphate levels (≤ 2.6 mg/dL) had the lowest mortality rate (7%, 38). The second and third quartiles had mortality rates of
Western Journal of Emergency Medicine 418 Volume 24, NO.3: May 2023 Association of Early Serum Phosphate Levels and Mortality in Patients with Sepsis Black et al.
Figure 1. Patient inclusion flow diagram. ESRD, end-stage renal disease.
Association of Early Serum Phosphate Levels and Mortality in Patients with Sepsis
†Any malignancy except malignancy skin neoplasm; ‡metastatic solid tumor; data is reported as count (percentage) and analyzed using chi-square test, unless specified by *median (1st quartile, 3rd quartile) and Wilcoxon rank-sum test; ˆfirst available measure at first encounter.
AIDS, acquired immunodeficiency syndrome; CHF, congestive heart failure; COPD, chronic obstructive pulmonary disease; CVD, cerebrovascular disease; mg/dL, milligram per deciliter; SOFA, Sequential Organ Failure Assessment,.
9% (39) and 10% (47), respectively.
As shown in Table 1, both comorbidities and disease severity varied among phosphate quartile groups. Compared to other quartile groups, patients in the highest quartile were older and more likely to have a history of congestive heart failure or myocardial infarction. There was also a significant difference in rates of chronic obstructive pulmonary disease across phosphate quartiles. Initial creatinine and lactate levels were significantly higher among patients with higher
phosphate levels. Initial total SOFA scores increased with phosphate quartiles, with the highest quartile experiencing the most pronounced degree of organ failure. Patients in the highest quartile were also more likely to require mechanical ventilation and vasopressor support.
Multivariable Analyses
After screening of candidate variables, the LASSO method selected age at first encounter, SOFA score,
Volume 24, NO.3: May 2023 419 Western Journal of Emergency Medicine
Black et al.
Variable Overall Highest quartile Third quartile Second quartile Lowest quartile P-value Age, years* 60 (50, 71) 64 (53, 74) 60 (49, 73) 59 (49, 70.5) 58 (48, 68) <0.001 Gender, female 950 (51) 219 (54) 233 (52) 238 (52) 260 (48) 0.39 Race, Black 889 (48) 190 (46) 226 (50) 211 (46) 262 (49) 0.34 Other 92 (5) 14 (4) 18 (4) 25 (5) 34 (6) White 874 (47) 204 (50) 207 (46) 220 (48) 243 (45) AIDS 61 (3) 11 (3) 18 (4) 14 (3) 18 (3) 0.75 Malignancy† 210 (11) 47 (11) 56 (12) 50 (11) 57 (11) 0.83 CHF 388 (21) 127 (31) 85 (19) 92 (20) 84 (16) <.001 COPD 629 (34) 149 (36) 145 (32) 184 (40) 151 (28) <.001 CVD 180 (10) 53 (13) 37 (8) 44 (10) 46 (9) 0.08 Diabetes 637 (34) 144 (35) 165 (37) 158 (35) 170 (32) 0.40 Dementia 104 (6) 31 (8) 35 (8) 17 (4) 21 (4) 0.01 Liver disease 207 (11) 47 (11) 45 (10) 53 (12) 62 (12) 0.84 Myocardial infarct 152 (8) 54 (13) 33 (7) 28 (6) 37 (7) <.001 Mechanical vent 116 (6) 50 (12) 28 (6) 21 (5) 17 (3) <.001 Metastatic cancer‡ 78 (4) 16 (4) 22 (5) 19 (4) 21 (4) 0.87 Vasopressors 532 (29) 204 (50) 105 (23) 111 (24) 112 (21) <.001 Calcium, mg/dL*ˆ 9.1 (8.6, 9.5) 9 (8.4, 9.5) 9.1 (8.6, 9.6) 9 (8.6, 9.5) 9.1 (8.6, 9.5) 0.07 Creatinine, mg/dL *ˆ 1.09 (0.78, 1.65) 1.73 (1.12, 2.73) 1.11 (0.77, 1.76) 0.94 (8.6, 9.5) 0.99 (0.74, 1.33) <.001 Lactate, mmol/L *ˆ 2.0 (1.4, 3.1) 2.3 (1.5, 3.9) 1.7 (1.2, 2.8) 1.9 (1.2, 3.0) 2.0 (1.5, 3.0) <.001 SOFA Total*^ 2 (0, 5) 5 (3, 8) 5 (3, 8) 2 (0, 4) 1 (0, 3) <.001
Table 1. Categorical variables by phosphate quartile group (unique patients).
Phosphate lab value range* Median phosphate value* (1st quartile, 3rd quartile) Mortality rate Lowest quartile ≤2.6 2.20 (1.90, 2.50) 7% (38/539) Second quartile 2.6 - 3.2 2.90 (2.80, 3.10) 9% (39/456) Third quartile 3.2 - 4.0 3.60 (3.40, 3.80) 10% (47/451) Highest quartile >4.0 5.00 (4.50, 5.90) 28% (113/409) Overall 0.40-8.20 3.20 (2.50, 3.90) 13% (327/1,855)
Table 2. Distribution of phosphate quartile groups and mortality by unique patients.
*mg/dL. mg/dL, milligram per deciliter.
Association of Early Serum Phosphate Levels and Mortality in Patients with Sepsis
vasopressor use, history of diabetes, and history of liver disease to be the covariates in the multivariable analyses, in addition to the phosphate quartile. Initial creatinine and calcium levels were included as candidate variables in the initial model. However, because their contribution was nonsignificant, these variables were not selected by the LASSO procedure for the final model. The area under the ROC curve (AUC) was 0.950 (95% CI 0.939-0.960, Figure 2), indicating excellent performance of the fitted model in predicting 28day mortality.
Figure
from multivariable model, adjusting for age at first encounter, SOFA score, vasopressor use, history of diabetes, and history of liver disease. CI=Confidence interval OR, odds ratio; SOFA, Sequential Organ Failure Assessment.
2.0 times higher odds than the third (3.2-4.0 mg/dL) quartile group (P=0.04).
Sub-analysis of Sepsis-3 Cohort
Figure 2. Receiver Operating Characteristic (ROC) curve for 28-day Mortality with Area Under the Curve (AUC) from the multivariable model, controlling for age at first encounter, SOFA score, vasopressor use, history of diabetes, history of liver disease, and phosphate quartile. AUC 0.950 (95% CI 0.939, 0.960).
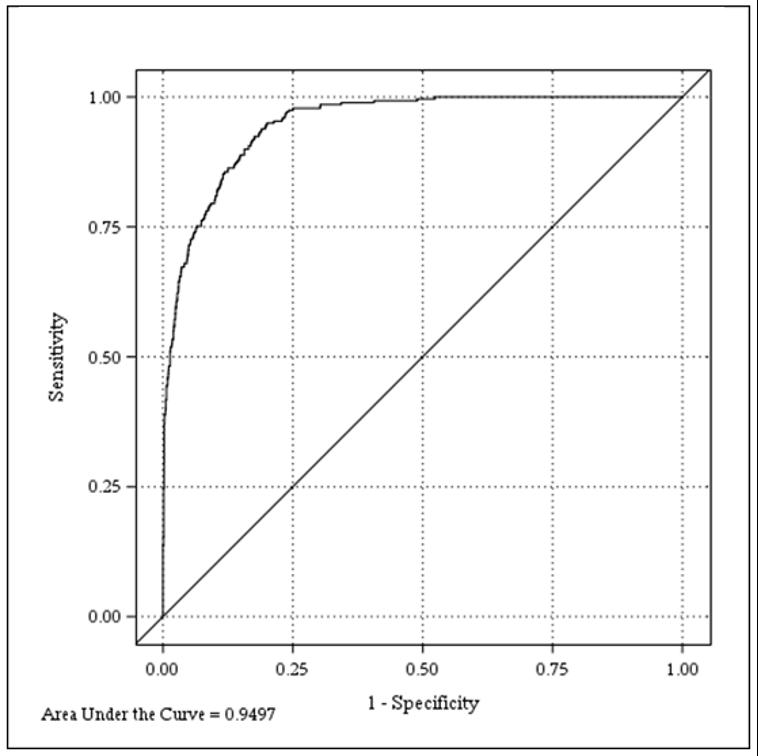
Controlling for the effect of these covariates, the repeatedmeasures mixed-model revealed that the likelihood of 28-day mortality was different across the quartile groups (P<0.01). Increasing age, higher initial SOFA score, vasopressor use, and history of liver disease were also significantly associated with mortality (Figure 3).
The odds ratios, adjusted for other covariates in the multivariable model, for 28-day mortality by phosphate quartile groups are presented in Table 3. Accounting for other covariates, the highest phosphate quartile group (> 4.0 mg/dL) had 2.4 times higher odds of death than the lowest (≤ 2.6 mg/ dL) quartile group (P<0.01), 2.6 times higher odds of death than the second (2.6-3.2 mg/dL) quartile group (P<0.01), and
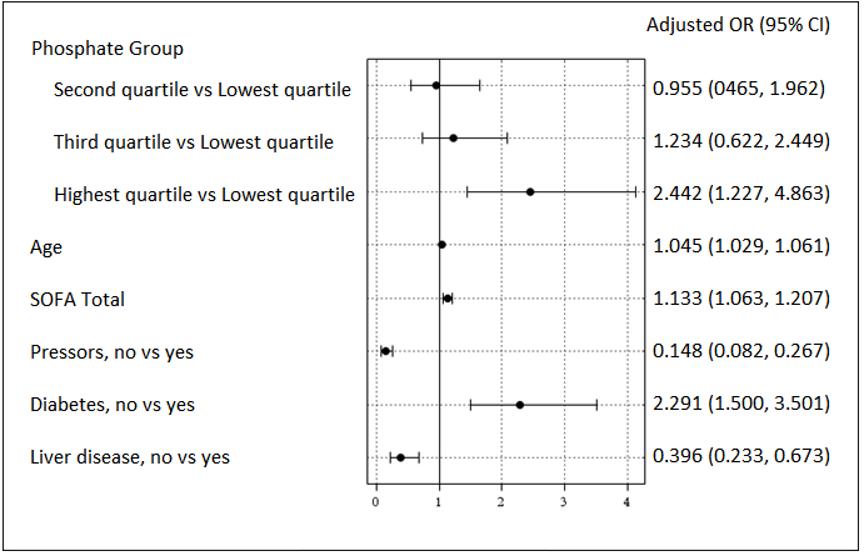
In the pre-planned sub-analysis of patients with SOFA scores of two or more, initial phosphate remained significantly associated with mortality. There were 1,051 patients in the sub-analysis with an overall mortality rate of 19% (Supplemental Table 1). The mortality rate was highest among patients in the highest phosphate quartile (30%; Supplemental Table 1). Again, patients in the highest quartile had increased odds of mortality compared to those in the lowest two quartiles (Supplemental Table 2). However, mortality differences between patients in the highest quartile and those in the third quartiles were no longer significant (P=0.05; Supplemental Table 2). Other significant predictors of mortality in the original model were similar in the secondary analysis multivariable model (Supplemental Figure 1).
DISCUSSION
In this retrospective study of hospitalized sepsis patients, we found patients in the highest quartile of first 24-hour phosphate levels had increased mortality and odds of death compared to all other phosphate quartiles. Patients in the lowest quartile of phosphate levels had similar odds of mortality compared to those in the second or third quartiles and significantly lower odds of mortality compared to those in the highest quartile. Although we divided phosphate levels into quartiles for analysis, the bounds closely aligned with accepted diagnostic thresholds. The significance of our findings persisted after adjusting for comorbidities, severity of illness, and potential confounders.
Our findings are similar to other recent studies, which have found that elevated phosphate levels are associated with poor outcomes. 16,17 Miller et al reported significantly
Western Journal of Emergency Medicine 420 Volume 24, NO.3: May 2023
et al.
Black
3. Adjusted odds ratios for 28-day mortality. Odds rations
*From regression model adjusting for age at first encounter, Sequential Organ Failure Assessment score, vasopressor use, history of diabetes, and history of liver disease. OR, odds ratio.
higher rates of 28-day mortality in mechanically ventilated sepsis patients with phosphate levels above 3.5 mg/ dL. 16 Paradoxically, both time-weighted hypo- and hyperphosphatemia were associated with decreased length of time on mechanical ventilation.16 Mortality rates observed by Miller et al were higher compared to our study (58.5% and 28%, respectively); however, all the patients in their dataset were mechanically ventilated and represented a more critically ill cohort at baseline. In our study, which was not limited to mechanically ventilated patients, patients in the highest phosphate quartile (>4.0 mg/dL) experienced higher mortality and were also more likely to require mechanical ventilation.
Al Harbi et al reported increased intensive care unit (ICU) and hospital mortality (aOR 1.60, 95% CI 1.13–2.28, P<0.01 and 1.70, 95% CI 1.21-2.29, P<0.01, respectively) among ICU patients with hyperphosphatemia.17 In addition to increased mortality, patients with hyperphosphatemia had increased vasopressor use and mechanical ventilation dependence. 17 Similar to our methodology, phosphate levels in their study were from the first day of presentation, although our study was not limited to ICU patients. Although cutoff values in our study were slightly different, and our cohort included a broader severity of illness, we found comparably higher mortality and increased mechanical ventilation requirements among patients with the highest phosphate levels.
Haider et al investigated the association between hyperphosphatemia and mortality among a broad cohort of 2,390 patients presenting to the ED.25 They found hyperphosphatemia was an independent risk factor for mortality (OR 3.29; P <0.001). Among the 215 patients with hyperphosphatemia, the mortality rate was 10.7%, compared to 3.2% in the overall cohort. Their study was a cross-sectional study of ED patients regardless of the reason for presentation, whereas our study was specifically focused on phosphate derangements among septic patients.
Although we, and others, found septic patients with hyperphosphatemia had higher odds of mortality,
some literature supports an association between hypophosphatemia and adverse outcomes.11,12,14 However, there are several notable limitations to those studies. In a small retrospective study of 55 patients from 2006, Shor et al found that severe hypophosphatemia (<1.0 mg/dL) was an independent risk factor for sepsis mortality, compared to patients without severe hypophosphatemia (>1.0 mg/ dL). 14 However, all patients with a phosphate level >1.0 mg/dL were included in the same group for analyses for their study, and no data were presented on patients with hyperphosphatemia.
Suzuki et al included all ICU patients, not limited to sepsis, in their investigation of phosphate levels among critically ill patients.11 After excluding patients with any episode of hyperphosphatemia, patients with at least one episode of hypophosphatemia had higher ICU mortality than those without any episodes of hypophosphatemia (34% vs 22%, respectively; P<0.01). However, in their multivariable analysis, hypophosphatemia was not independently associated with mortality, and a hyperphosphatemia subgroup (>4.3 mg/dL) had increased ICU mortality, duration of mechanical ventilation, and ICU length of stay. Moreover, correction of hypophosphatemia was not associated with improvement of outcomes. Although they did not find hypophosphatemia to be an independent predictor of mortality, their study seems to suggest a potential bimodal distribution, with phosphate extremes (either low or high) having an association with increased illness severity in critically ill patients.
Wang et al also investigated the relationship between hypophosphatemia and mortality among all ICU patients, although not limited to sepsis.12 They separated patients into a normal phosphate group and a hypophosphatemia group based on phosphate levels at time of ICU admission and found hypophosphatemia to be an independent risk factor for ICU 28-day mortality (OR 1.5; P =0.01). Patients with hyperphosphatemia were excluded from their analysis. We did not find an association between hypophosphatemia and mortality among our cohort of patients with
Volume 24, NO.3: May 2023 421 Western Journal of Emergency Medicine Black et al. Association of Early
Levels and Mortality in Patients with Sepsis
Serum Phosphate
Phosphate quartile group Comparator phosphate quartile group Adjusted OR (95% CI)* Adjusted P value Second quartile Lowest quartile 0.955 (0.465-1.962) 0.9984 Second quartile Third quartile 0.774 (0.377-1.589) 0.79 Third quartile Lowest quartile 1.234 (0.622-2.449) 0.86 Highest quartile Lowest quartile 2.442 (1.227-4.863) <0.01 Highest quartile Second quartile 2.558 (1.239-5.291) <0.01 Highest quartile Third quartile 1.980 (1.026-3.817) 0.04
Table 3. Adjusted odds of mortality by phosphate quartile groups.
Association of Early Serum Phosphate Levels and Mortality in Patients with Sepsis
sepsis. Although some studies only investigated severe hypophosphatemia, in our cohort less than 1% of encounters had phosphate levels <1.0 mg/dL. Several of the above studies only examined the relationship between hypophosphatemia and adverse outcomes and excluded patients with hyperphosphatemia. A strength of our study design was that we included patients with both high and low phosphate levels in our analysis.
Our results support some existing literature that suggests an association between hyperphosphatemia and adverse outcomes in critically ill patients. Our study provides valuable insights into the association between phosphate derangements and adverse outcomes in septic patients, an area with limited, and conflicting, existing evidence. Our findings suggest that phosphate dysregulation, and specifically elevated phosphate levels, is associated with increased sepsis mortality, although the pathophysiologic mechanism could not be elucidated by the retrospective design of our study. Potential etiologies of this relationship could include that phosphate is a marker of organ dysfunction or dysregulated cellar metabolism from sepsis. Whether high serum phosphate is an early indicator of increased mortality, a marker of organ failure severity, a potential therapeutic target, or mediates cellular dysfunction, warrants further investigation.
LIMITATIONS
It is possible that the relationship between elevated phosphate levels and mortality could reflect residual confounding from an unmeasured covariate. For example, increased phosphate could be secondary to other unexplained organ dysfunction that influences sepsis mortality. However, we accounted for a number of potentially confounding factors in our multivariable model and included both SOFA score and markers of renal dysfunction as candidate variables and found high phosphate levels to be persistently associated with increased sepsis-related mortality. Additionally, we had a limited number of patients with severe hypophosphatemia in our patient population, which may have limited our ability to detect significant associations. Finally, given the retrospective nature of our study, we were unable to ascertain the reason a phosphate level was drawn. Although this could have been part of some clinicians’ usual practice, it may also have biased the sample toward a sicker cohort that had a broader laboratory evaluation.
CONCLUSION
In this retrospective study of hospitalized sepsis patients, we found that patients with the highest initial phosphate levels in the first 24 hours of presentation had increased odds of death compared to patients in all other phosphate-level groups.
Address for Correspondence: Lauren Page Black, MD, MPH, University of Florida College of Medicine, Department of Emergency Medicine, Division of Research. 655 West 8th Street, Jacksonville, Florida 32209. Email: LaurenPage.Black@jax.ufl.edu.
Conflicts of Interest: By the WestJEM article submission agreement, all authors are required to disclose all affiliations, funding sources and financial or management relationships that could be perceived as potential sources of bias. No author has professional or financial relationships with any companies that are relevant to this study. There are no conflicts of interest or sources of funding to declare.
Copyright: © 2023 Black et al. This is an open access article distributed in accordance with the terms of the Creative Commons Attribution (CC BY 4.0) License. See: http://creativecommons.org/ licenses/by/4.0/
REFERENCES
1. Singer M, Deutschman CS, Seymour C, et al. The Third International Consensus Definitions for Sepsis and Septic Shock (Sepsis-3). JAMA. 2016;315(8):801-10.
2. Rhee C, Dantes R, Epstein L, et al. Incidence and trends of sepsis in US hospitals using clinical vs claims data, 2009-2014. JAMA 2017;318(13):1241-9.
3. Rhodes A, Evans LE, Alhazzani W, et al. Surviving Sepsis Campaign: International Guidelines for Management of Sepsis and Septic Shock: 2016. Crit Care Med. 2017;45(3):486-552.
4. Seymour CW, Liu VX, Iwashyna TJ, et al. Assessment of Clinical Criteria for Sepsis: For the Third International Consensus Definitions for Sepsis and Septic Shock (Sepsis-3). JAMA. 2016;315(8):762-74.
5. Bakker J, Coffernils M, Leon M, et al. Blood lactate levels are superior to oxygen-derived variables in predicting outcome in human septic shock. Chest. 1991;99(4):956-62.
6. Nguyen HB, Rivers EP, Knoblich BP, et al. Early lactate clearance is associated with improved outcome in severe sepsis and septic shock. Crit Care Med. 2004;32(8):1637-42.
7. Jansen TC, Van Bommel J, Schoonderbeek FJ, et al. Early lactateguided therapy in intensive care unit patients: a multicenter, openlabel, randomized controlled trial. Am J Respir Crit Care Med 2010;182(6):752-61.
8. Bai W, Li J, Liu J. Serum phosphorus, cardiovascular and all-cause mortality in the general population: a meta-analysis. Clin Chim Acta 2016;461(374):76-82.
9. Suki WN, Moore LW. Phosphorus regulation in chronic kidney disease. Methodist Debakey Cardiovasc J. 2016;12(4):6-9.
10. Broman M, Wilsson AMJ, Hansson F, et al. Analysis of hypo- and hyperphosphatemia in an intensive care unit cohort. Anesth Analg 2017;124(6):1897-905.
11. Suzuki S, Egi M, Schneider AG, et al. Hypophosphatemia in critically ill patients. J Crit Care. 2013;28(4):53.e9-536.e19.
12. Wang L, Xiao C, Chen L, et al. Impact of hypophosphatemia on outcome of patients in intensive care unit: a retrospective cohort study. BMC Anesthesiol. 2019;19(1):1-7.
Western Journal of Emergency Medicine 422 Volume 24, NO.3: May 2023
et al.
Black
13. Zazzo JF, Troché G, Ruel P, et al. High incidence of hypophosphatemia in surgical intensive care patients: efficacy of phosphorus therapy on myocardial function. Intensive Care Med 1995;21(10):826-31.
14. Shor R, Halabe A, Rishver S, et al. Severe hypophosphatemia in sepsis as a mortality predictor. Ann Clin Lab Sci. 2006;36(1):67-72.
15. Shoenfeld Y, Hager S, Berliner S, et al. Hypophosphatemia as diagnostic aid in sepsis. NY State J Med. 1982;82(2):163-5.
16. Miller CJ, Doepker BA, Springer AN, et al. Impact of serum phosphate in mechanically ventilated patients with severe sepsis and septic shock. J Intensive Care Med. 2020;35(5):485-93.
17. Al Harbi SA, Al-Dorzi HM, Al Meshari AM, et al. Association between phosphate disturbances and mortality among critically ill patients with sepsis or septic shock. BMC Pharmacol Toxicol. 2021;22(1):30.
18. Guirgis FW, Jones L, Esma R, et al. Managing sepsis: Electronic recognition, rapid response teams, and standardized care save lives. J Crit Care. 2017;40:296-302.
19. von Elm E, Altman DG, Egger M, et al. The Strengthening the Reporting of Observational Studies in Epidemiology (STROBE) statement: guidelines for reporting observational studies. J Clin Epidemiol. 2008;61(4):344-9.
20. Tukey J. Exploratory Data Analysis. Addison-Wesely; 1977.
21. Tibshirani R. Regression shrinkage and selection via the Lasso. J R Stat Soc Ser B. 1996;58(1):267-88.
22. Efron B, Hastie T, Johnstone I, et al. Least angle regression. Ann Stat. 2004;32(2):407-99.
23. Cohen RA. Introducing the GLMSELECT procedure for model selection. 2006. Available at: http://www2.sas.com/proceedings/ sugi31/207-31.pdf. Accessed April 30, 2020.
24. Akaike H. A new look at the statistical model identification. IEEE Trans Autom Control. 1974;19(6):716-23.
25. Haider DG, Lindner G, Wolzt M, et al. Hyperphosphatemia is an independent risk factor for mortality in critically Ill patients: results from a cross-sectional study. PLoS One. 2015;10(8):1-8.
Volume 24, NO.3: May 2023 423 Western Journal of Emergency Medicine
Black et al. Association of Early Serum Phosphate Levels and Mortality in Patients with Sepsis
A Cross-sectional Survey to Assess Awareness of Syndromic Surveillance by Clinicians Practicing Emergency Medicine: An Opportunity for Education and Collaboration
Gabriel Ann Haas, MPH*
Brittany Hudson-Walsh, DO†
Adrienne Malik, MD†
Kellie Wark, MD, MPH‡
Section Editor: Trevor Mills, MD, MPH
Kansas Department of Health and Environment, Kansas Syndromic Surveillance Program, Topeka, Kansas
University of Kansas School of Medicine, Department of Emergency Medicine, Kansas City, Kansas
University of Kansas School of Medicine, Division of Infectious Disease, Kansas City, Kansas
Submission history: Submitted August 14, 2022; Revision received not given on escholarship; Accepted February 17, 2023
Electronically published May 3, 2023
Full text available through open access at http://escholarship.org/uc/uciem_westjem
DOI: 10.5811/westjem.58392
Introduction: Syndromic surveillance (SyS) is an important public health tool using de-identified healthcare discharge data from emergency department (ED) and urgent care settings to rapidly identify new health threats and provide insight into current community well-being. While SyS is directly fed by clinical documentation such as chief complaint or discharge diagnosis, the degree to which clinicians are aware their documentation directly influences public health investigations is unknown. The primary objective of this study was to evaluate the degree to which clinicians practicing in Kansas EDs or urgent care settings were aware that certain de-identified aspects of their documentation are used in public health surveillance and to identify barriers to improved data representation.
Methods: We distributed an anonymous survey August–November 2021 to clinicians practicing at least part time in emergency or urgent care settings in Kansas. We then compared responses from emergency medicine (EM)-trained physicians to non-EM trained physicians. Descriptive statistics were used for analysis.
Results: A total of 189 respondents across 41 Kansas counties responded to the survey. Of those surveyed, 132 (83%) were unaware of SyS. Knowledge did not differ significantly by specialty, practice setting, urban region, age, nor by experience level. Respondents were unaware of which aspects of their documentation were visible to public health entities, or how quickly records were retrievable. When asked about improving documentation for SyS, lack of clinician awareness (71.5%) was perceived as a greater barrier than electronic health record platform usability or time available to document (61% and 59%, respectively).
Conclusion: This survey suggests that most practitioners in EM have not heard of SyS and are unaware of the invaluable role certain aspects of their documentation play in public health. Critical information that would be captured and coded into a key syndrome is often missing, but clinicians are unaware of what types of information may be most useful in their documentation, and where to document that information. Lack of knowledge or awareness was identified by clinicians as the single greatest barrier to enhancing surveillance data quality. Increased awareness of this important tool may lead to enhanced utility for timely and impactful surveillance through improved data quality and collaboration between EM practitioners and public health.
[West J Emerg Med. 2023;24(3)424–430.]
Western Journal of Emergency Medicine 424 Volume 24, NO.3: May 2023 * † ‡ Original Research
INTRODUCTION
Syndromic surveillance (SyS) is a data collection strategy that informs public health about concerning trends in near realtime by analyzing patient-reported symptoms and electronic health record (EHR) documentation from clinicians in emergency departments (ED) and urgent care.1,2 The timely information that SyS can provide about current community well-being, and the ability to query free-text fields (eg, chief complaint, triage notes) in addition to discharge diagnosis, allow for early outbreak detection and active surveillance of a wide variety of public health indicators. Health departments work with hospitals to send de-identified visit data in batches as frequently as every hour, and the data is monitored on a daily basis to alert epidemiologists to potential health-related concerns.
Epidemiologists actively use SyS tools in their day-today practice, and there is great opportunity for collaboration with frontline clinicians providing the data input. For example, e-cigarette or vaping-associated lung injury, was initially identified when astute healthcare clinicians alerted public health practitioners to cases of respiratory failure among young adults, prompting widespread SyS queries to further quantify this public health problem and identify cases for investigation.3 More recently, SyS was used to assess the real-time impact of physical and social distancing rules implemented in the initial phase of the coronavirus coronavirus 2019 pandemic.4
Syndromic surveillance has also been used to prove the efficacy of vaccination initiatives by demonstrating a decrease in patients presenting to EDs for target diseases.6,7 Furthermore, SyS has been used to analyze extreme weather events, providing information to assist in statewide response plans.8-10 The public health applications of SyS are as vast as the data SyS obtains from EHR-documented symptoms and diagnoses, and the data can be used to more rapidly respond to emerging health threats than traditional sources of public health information.
As SyS systems use data generated from clinician documentation, the strength of the data collected is reliant on clinician awareness of the role of their documentation in SyS.11 To date, this relationship has not been well examined in public health or medical literature, which is surprising as SyS systems are fed directly by EHR documentation from acute care, urgent care, and ED settings (which in this manuscript we will consider collectively as “ED settings”). To better explore clinician understanding of SyS, we created a survey evaluating their awareness of SyS and perception of EHR data-collection methods. We hypothesized that emergency clinicians in our state are largely unaware of SyS and unaware of the invaluable role their documentation plays in the aggregation of data for public health action. Given that Kansas has a robust SyS system and is leading the way in SyS outreach and application, the state was well situated for an investigation of this hypothesis.
METHODS
We conducted a cross-sectional survey designed to assess emergency clinician (physician and midlevel practitioner)
Population Health Research Capsule
What do we already know about this issue? Syndromic surveillance (SyS) is a public health tool using de-identified ED visit records to rapidly assess current health threats.
What was the research question? Are clinicians in emergency medicine aware their documentation is important for public health surveillance?
What was the major finding of the study? Of 189 clinicians surveyed, 83% were unfamiliar with SyS or the role their charting plays in public health.
How does this improve population health? Increasing awareness of SyS within emergency medicine will inform public health practice through collaboration to target surveillance and enhance data quality.
awareness and understanding of SyS through an electronic survey questionnaire. Twelve of 29 survey questions gathered respondent demographics, training level, primary practice setting, and assessed their understanding of SyS and perceived barriers toward improving documentation for public health purposes. (For full survey template see supplement.) The questionnaire was created by the Kansas Syndromic Surveillance Program. The survey instrument was piloted with nine physicians and underwent three revisions.
Survey subjects were eligible to participate if they identified as practicing in an EM or urgent care (UC) setting in the state of Kansas (eg, EM-trained, and non-urban family medicine [FM], internal medicine [IM] clinicians and rural physician assistants [PA]). In rural counties, the ED did not have to be the primary practice setting provided the clinician identified as practicing in the ED at least part time. We acquired clinicians’ emails from the Kansas Board of Healing Arts database, and we contacted potential survey participants via email correspondence and the Kansas Chapter of the American College of Emergency Physicians (KS ACEP). Responses were anonymous. The survey was disseminated and stored with survey software (Qualtrics XM, Provo, UT) from August 1–November 12, 2021, and participants were contacted multiple times. We analyzed qualitative data using survey analytic descriptive statistics (SAS Institute, Inc, Cary, NC). Awareness and perception differences were compared with Pearson chi-square tests.
Volume 24, NO.3: May 2023 425 Western Journal of Emergency Medicine Haas et al. Awareness of Syndromic Surveillance by Emergency Medicine Clinicians
RESULTS
Of 1,553 EM, FM, IM physicians and PAs queried, 189 responded. Of those queried, 480 were formally trained in EM. There is no existing source to quantify how many clinicians practice in Kansas EDs. Further, not all physicians queried may have been eligible to participate in the survey as outlined by our communication. The response rate for
emergency physicians at our state’s large academic medical facility reached 38%. Responses were received from clinicians in 41 counties, reflecting excellent Kansas clinician representation given that three-quarters of the state population resides in just six counties.
See Table 1 for responses by practice setting, age range, and level of training. The majority of respondents identified
*Not all respondents answered every question. Total responses to this question may vary from imputed practitioner information. SyS, syndromic surveillance
Western Journal of Emergency Medicine 426 Volume 24, NO.3: May 2023 Awareness of Syndromic Surveillance by Emergency Medicine Clinicians Haas et al. Demographics All respondents (N=189) Have you heard of syndromic surveillance?* % (n) Yes, % (n) No, % (n) Unsure, % (n) Group P-value (chi-square) 17.0% (27/159) 74.8% (119/159) 8.2% (13/159) Hospital type Critical access hospital 14.0% (23/164) 0% (0/21) 90.5% (19/21) 9.5% (2/21) 0.152 Teaching facility 37.8% (62/164) 20.8% (11/53) 71.7% (38/53) 7.5% (4/53) Non-teaching facility 25.6% (42/164) 16.7% (6/36) 80.6% (29/36) 2.8% (1/36) Other (Urgent care, ambulatory) 22.6% (37/164) 21.9% (7/32) 62.5% (20/32) 15.6% (5/32) Age 20-29 15.4% (29/188) 0% (0/25) 84% (21/25) 16% (4/25) 0.173 30-49 54.8% (103/188) 20.5% (17/83) 73.5% (61/183) 6.0% (5/83) 50-69 25.5% (48/188) 20.9% (9/43) 69.8% (30/43) 9.3% (4/43) 70+ 4.3% (8/188) 12.5% (1/8) 87.5% (⅞) 0% (0/8) Level of training Resident or fellow 18.6% (34/183) 14.8% (4/27) 74.1% (20/27) 11.1% (3/27) 0.468 Attending 67.8% (124/183) 18.9% (21/111) 73.0% (81/111) 8.1% (9/111) Mid-level practitioner 13.7% (25/183) 9.5% (2/21) 85.7% (18/21) 4.8% (1/21) Practice location Urban or semi-urban 75.5% (143/189) 20% (23/115) 72.2% (83/115) 7.8% (9/115) 0.347 Rural 24.3% (46/189) 10% (4/40) 80% (32/40) 10% (4/40) Primary practice setting Emergency department 48.1% (88/183) 16.9% (13/77) 76.6% (59/77) 6.5% (5/77) 0.676 Inpatient 15.3% (28/183) 14.3% (3/21) 76.2% (16/21) 9.5% (2/21) Urgent care 4.4% (8/183) 37.5% (3/8) 62.5% (5/8) 0% (0/8) Other (clinic, tele-medicine) 32.2% (59/183) 15.1% (8/53) 73.6% (39/53) 11.3% (6/53) Specialty Emergency medicine 46.7% (86/184) 21.3% (16/75) 73.3% (55/75) 5.3% (4/75) .806 Family medicine 24.5% (45/184) 16.7% (7/42) 71.4% (30/42) 11.9% (5/42) Internal medicine 20.7% (38/184) 10.3% (3/29) 79.3% (23/29) 10.3% (3/29) Pediatrics 3.3% (6/184) 16.7% (1/6) 66.7% (4/6) 16.7% (1/6) Other (hematology, oncology, occupational medicine, endocrinology, geriatrics, toxicology) 4.9% (9/184) 28.6% (2/7) 57.1% (4/7) 14.3% (1/7)
Table 1. Respondent breakdown and calculated P-values to assess whether awareness of syndromic surveillance differed significantly by hospital type, age, role, specialty, or practice setting.
as EM-specialized (46.7%) followed by FM (24.5%) and IM (20.7%). Primary practice setting was identified as the ED in 48.1%, followed by “other” in 32.2%, inpatient for 15.3%, and 4.4% urgent care. As Kansas is a largely rural state, emergency clinicians in critical access areas are often physicians or mid-level practitioners from a variety of specialty-training backgrounds, practicing acute care primarily in non-traditional EM settings.
The majority of survey respondents indicated they were unfamiliar with SyS, and the role that EHR documentation serves in public health. When discussing public health and SyS, 75% of respondents indicated “no” when asked “Have you heard of a subset of public health surveillance called syndromic surveillance?” Only 17% of respondents indicated they had heard of SyS, although none indicated where they had previously learned of SyS. Awareness of SyS did not significantly differ by practice setting, academic vs nonacademic center, age, nor by clinician training (Table 1). For the analysis, we compared the relative difference in responses between EM and non-EM trained physicians and found no significant differences between the responses.
Respondents were unsure which aspects of documentation are visible to public health, how quickly data is received, and what conditions are monitored using SyS (Table 2).
When asked what their perceived barriers were to improving clinician documentation as it relates to public health data, the most popular three answers were clinician lack of awareness (most frequently chosen), electronic health systems (second most frequent response), and time (third most frequent response). (These answer choices do not reflect accurate information related to SyS data collection in Kansas.)
DISCUSSION
The data obtained in this survey supports our hypothesis that emergency physicians and other clinicians who practice in ED settings are unfamiliar with SyS. Respondents were also unclear about the role EHRs serve in capturing public health trends using SyS. Although not all clinicians identified as practicing primarily in an ED setting, the distribution of responses was similar to a 2020 study demonstrating that FM physicians represented nearly half of the overall physician workforce.12 Additionally, we found that awareness did not differ significantly by primary practice setting or formal training. This near ubiquitous lack of awareness was identified by clinicians as the largest barrier to improving EHR documentation for SyS, ahead of constraints of EHR platforms and the time available to document thoroughly. While there is minimal ability to broadly impact the types of EHR systems
surveillance?
Is public health able to monitor de-identified healthcare discharge data for surveillance purposes?
Which aspects of documentation can be monitored for public health surveillance? (Select all that apply.)
ICD, International Classification of Diseases; HPI, history of present illness; EVALI, e-cigarette or vaping product use-associated lung injury; AMI, acute myocardial infarction; CC, chief complaint; ED, emergency department; EHR, electronic health record.
Volume 24, NO.3: May 2023 427 Western Journal of Emergency Medicine Haas et al. Awareness of Syndromic Surveillance by Emergency Medicine Clinicians
Awareness EM Respondents, % (n) All Respondents, % (n) Have you heard of syndromic
yes 21.3% (16/75) 17.0% (27/159) no 73.3% (55/75) 74.8% (119/159) unsure 5.3% (4/75) 8.2% (13/159)
yes 36.0% (27/75) 30.2% (48/159) no** 4.0% (3/75) 6.3% (10/159) unsure 60.0% (45/75) 53.4% (101/159)
unsure 63.1% (41/64) 65.4% (85/130) ICD diagnosis codes 51.6% (33/64) 50.8% (66/130) patient demographics (e.g. age, county) 20.3% (13/64) 23.1% (30/130) procedure codes 15.6% (10/64) 16.9% (22/130) chief complaint 14.1% (9/64) 13.9% (18/130) identifiable patient data (e.g. name, address)** 6.3% (4/64) 26.9% (35/130) vital signs 4.7% (3/64) 5.4% (7/130) triage notes 4.7% (3/64) 4.6% (6/130) Clinician assessments (e.g. HPI, assessment, and plans)** 0.0% (0/64) 10.8% (14/130)
Table 2. All analyzed survey questions and their results.
When ED or UC surveillance is possible, how soon is it generally retrievable after ED discharge?
Which data is monitored from ED/urgent care EHR systems at the public health level? (Select all that apply.)
What barriers would you perceive as most affecting your ability to improve documentation for public health surveillance data? (Select your top 3.)
clinicians do not realize certain
for
used, or the time available for clinicians to document patient encounters, increasing awareness among ED practitioners about SyS is a feasible intervention that could impact the future of SyS practice.
This survey fills a gap in the literature addressing the understanding of SyS by clinicians. Our survey results indicate clinicians are unsure what types of information might be useful and where in the EHR documentation. They are not sure what types of conditions and social determinants of health epidemiologists are attempting to monitor. When asked about what this data is used for, respondents were more likely
to select that public health monitors reportable infectious diseases or conditions only via state mandate of importance. In reality, public health is using SyS data to monitor a wide variety of health outcomes.13 Its use has recently been expanded beyond outbreak detection for real-time monitoring of a wide variety of conditions including mental health-related visits, drug overdose, environmental health impacts, and surveillance of patterns in trauma, violence, and injury.8,10,14,15,16 Public health can do more to actively inform emergency clinicians about conditions and codes of interest or work directly with them to actively monitor conditions of
Western Journal of Emergency Medicine 428 Volume 24, NO.3: May 2023 Awareness of Syndromic Surveillance by Emergency Medicine Clinicians Haas et al. Awareness EM respondents, % (n) All respondents, % (n)
Unsure 78.1% (50/64) 80.8% (105/130) 1-12 hours 7.8% (5/64) 4.6% (6/130) 12-48 hours 6.3% (5/64) 10.0% (13/130) 2-7 days** 0% (0/64) 4.6% (6/130) 1-2 weeks** 4.7% (3/64) 3.1% (4/130) Not possible** 3.1% (2/64) 1.6% (2/130)
Unsure 56.3% (36/64) 56.2% (73/130) Reportable infectious diseases 34.3% (22/64) 36.2% (47/130) Critical diseases only by state mandate of importance 34.3% (22/64) 34.6% (45/130) Emerging conditions of interest (e.g. EVALI) 29.7% (19/64) 29.2% (38/130) Environmental exposures (e.g. weather related) 28.2% (18/64) 28.5% (37/130) Visits following a mass gathering or disaster 26.6% (17/64) 28.5% (37/130) Adverse events (e.g. vaccine side effects) 25.0% (16/64) 26.2% (34/130) Trauma-related (e.g. child abuse, interpersonal violence) 25.0% (16/64) 25.4% (33/130) Syndromes (e.g. diarrhea, rash + fever) 15.6% (10/64) 18.5% (24/130) Acute conditions (e.g. AMI, appendicitis) 12.5% (8/64) 16.9% (22/130) Mental health-related visits 18.8% (12/64) 15.4% (20/130)
Clinician lack of awareness (e.g.
documentation is monitored or important
surveillance) 49/62 (79.0%) 71.5% (93/130) Electronic health systems (i.e. usability, platforms, and vendors) 66.1% (41/62) 60.8% (79/130) Time required to document 64.5% (40/62) 59.2% (77/130) Perceived level of importance (e.g.
coding) 50.0% (31/62) 43.1% (56/130) Lack of standardization/proper codes 40.3% (25/62) 39.2% (51/130) Lack of collaboration between medicine and public health 35.5% (22/62) 36.9% (48/130) Nurse or receptionist lack of awareness (e.g. documentation of CC or triage-note data by nurse or receptionist is not perceived as important) 33.9% (21/62) 32.3% (42/13)
ICD, International Classification of Diseases; HPI, history of present illness; EVALI, e-cigarette or vaping product use-associated lung injury; AMI, acute myocardial infarction; CC, chief complaint; ED
emergency department; EHR
electronic health record.
irrelevance of patient history to
Table
2 Continued. All analyzed survey questions and their results.
,
,
concern.13
From direct conversations with the National Syndromic Surveillance Program and ACEP we suspect awareness of SyS is low nationally, not just in Kansas. In fact, Kansas has been one of the state programs leading the way in SyS outreach and application. Increasing awareness of SyS by clinicians has the potential to unearth many meaningful applications for this data through academic public health partnerships and applied public health research. Physicians in Kansas changed the way they document to include additional contextual diagnosis codes not included prior to knowledge about SyS. Codes or language of interest may be determined in collaboration with local public health agencies for emerging health threats or community events. This is also an opportunity to enhance the feedback loop between public health and medicine to target surveillance efforts and provide useful data back to clinicians. Improving the quality of SyS data at the clinician level through increased awareness has obvious implications for future advances in the way we predict, monitor, and respond to disease on a local and national level.
LIMITATIONS
Although our overall response rate was typical for e-mailbased survey studies of clinicians without incentives, our study is limited by the number of respondents. While our responses are representative of a wide variety of practice settings and experience levels, we cannot exclude the possibility of non-response bias or bias from the survey instrument itself. The length of the survey was likely a factor, as not all respondents answered every question. Additionally, while we suspect our results are likely generalizable to other states, the survey in this study was only administered to practitioners in Kansas. Many of our responses came from clinicians who are not formally EM trained or may be practicing in ED settings part time. While this could generate concerns about reaching our intended audience, it is also a strength of our study because it demonstrates that we captured responses from non-traditional, rural clinicians who practice in ED settings. Finally, the high response rate of academic practitioners in EM to the survey may introduce bias that makes the results less representative of the statewide ED workforce.
CONCLUSION
Frontline clinicians practicing in ED settings in the state of Kansas are largely unaware of syndromic surveillance and the critical role their documentation plays within this facet of the public health system. Clinicians reported that a lack of understanding of SyS is a significant barrier to making changes to electronic health record-level documentation that would improve the quality of data collected for SyS. These findings represent an opportunity to increase education and collaboration between EM and
public health for surveillance purposes.
ACKNOWLEDGMENTS
The authors would like to acknowledge the physicians who piloted the survey instrument and provided feedback, the Kansas Department of Health and Environment Bureau of Epidemiology and Public Health Informatics (KDHE), and Justin Blanding, MPH with KDHE for assistance with SAS analysis. Dr. Hudson-Walsh was a resident physician at the University of Kansas during the bulk of this project but now practices at Mercy Northwest in Rogers, AR.
Address for Correspondence: Adrienne Malik, MD, University of Kansas Medical Center, Department of Emergency Medicine, 3901 Rainbow Blvd, Mailstop 1045, Kansas City, KS 66160. Email: amalik3@kumc.edu
Conflicts of Interest: By the WestJEM article submission agreement, all authors are required to disclose all affiliations, funding sources and financial or management relationships that could be perceived as potential sources of bias. No author has professional or financial relationships with any companies that are relevant to this study. There are no conflicts of interest or sources of funding to declare.
Copyright: © 2023 Haas et al. This is an open access article distributed in accordance with the terms of the Creative Commons Attribution (CC BY 4.0) License. See: http://creativecommons.org/ licenses/by/4.0/
REFERENCES
1. Colón-González FJ, Lake IR, Morbey RA, et al. A methodological framework for the evaluation of syndromic surveillance systems: a case study of England. BMC Public Health. 2018;18(1):544.
2. Yoon PW, Ising AI, Gunn JE. Using syndromic surveillance for allhazards public health surveillance: successes, challenges, and the future. Public Health Rep. 2017;132(1_suppl):3S-6S.
3. Krishnasamy VP, Hallowell BD, Ko JY, et al. Update: characteristics of a nationwide outbreak of e-cigarette, or vaping, product useassociated lung injury - United States, August 2019 to January 2020. MMWR Morb Mortal Wkly Rep. 2020; 69:90-4.
4. Hartnett KP, Kite-Powell A, DeVies J, et al. National Syndromic Surveillance Program community of practice. impact of the COVID-19 pandemic on emergency department visits - United States, January 1, 2019-May 30, 2020. MMWR Morb Mortal Wkly Rep 2020;69(23):699-704.
5. Bellazzini MA, Minor KD. ED syndromic surveillance for novel H1N1 spring 2009. Am J Emerg Med. 2011;29(1):70-4.
6. Hughes HE, Elliot AJ, Hughes TC, et al. Using emergency department syndromic surveillance to investigate the impact of a national vaccination program: a retrospective observational study. PLoS One. 2020;15(10):e0240021.
Volume 24, NO.3: May 2023 429 Western Journal of Emergency Medicine Haas et al. Awareness of Syndromic Surveillance by Emergency Medicine Clinicians
7. Christie A, Henley SJ, Mattocks L, et al. Decreases in COVID-19 cases, emergency department visits, hospital admissions, and deaths among older adults following the introduction of COVID-19 vaccine — United States, September 6, 2020–May 1, 2021. MMWR Morb Mortal Wkly Rep. 2021;70:858–64.
8. Dirmyer VF. Using real-time syndromic surveillance to analyze the impact of a cold weather event in New Mexico. J Environ Public Health. 2018;2018:2185704.
9. Tsai S, Hamby T, Chu A, et al. Development and application of syndromic surveillance for severe weather events following Hurricane Sandy. Disaster Med Public Health Prep. 2016;10(3):463-71.
10. Schramm PJ, Vaidyanathan A, Radhakrishnan L, et al. Heatrelated emergency department visits during the Northwestern heat wave — United States, June 2021. MMWR Morb Mortal Wkly Rep. 2021;70:1020–1.
11. Smith GE, Elliot AJ, Lake I, et al. Syndromic surveillance: two decades experience of sustainable systems: It’s people, not just data! Epidemiol Infect. 2019;147:e101.
12. Bennett CL, Gerard WA, Cullen JS, et al. National study on the contribution of family physicians to the US emergency physician workforce in 2020. J Am Board Fam Med. 2021;34(6):1221-8.
13. Mandl KD, Overhage JM, Wagner MM, et al. Implementing syndromic surveillance: a practical guide informed by the early experience. J Am Med Inform Assoc. 2004;11(2):141-50.
14. Slavova S, Rock P, Bush HM, et al. Signal of increased opioid overdose during COVID-19 from emergency medical services data. Drug Alcohol Depend. 2020;214:108176.
15. Zwald ML, Holland KM, Bowen DA, et al. Using the Centers for Disease Control and Prevention’s National Syndromic Surveillance Program data to monitor trends in US emergency department visits for firearm injuries, 2018 to 2019. Ann Emerg Med. 2022;79(5):46573.
16. Smith GE, Harcourt SE, Hoang U, et al. Mental health presentations across health care settings during the first 9 months of the COVID-19 pandemic in England: retrospective observational study. JMIR Public Health Surveill. 2022;8(8):e32347.
Western Journal of Emergency Medicine 430 Volume 24, NO.3: May 2023
Syndromic
by Emergency Medicine Clinicians Haas et al.
Awareness of
Surveillance
Use of Hotels as a Disposition Alternative to Hospital Admission for Undomiciled Patients
Undergoing SARS-CoV-2 Testing
Lucia C. Lin, MD*
Brendan B. McIntyre, BA*
Kaitlin McIntyre, MD†
Edward Castillo, PhD, MPH†
Rachna Subramony, MD†
Allyson Kreshak, MD†
Section Editor: León D. Sánchez, MD, MPH
University of California San Diego School of Medicine, San Diego, California University of San Diego, Department of Emergency Medicine, San Diego, California
Submission history: Submitted June 7, 2022; Revision received January 14, 2023; Accepted February 3, 2023
Electronically published May 3, 2023
Full text available through open access at http://escholarship.org/uc/uciem_westjem
DOI: 10.5811/westjem.57639
Introduction: The coronavirus 2019 (COVID-19) pandemic has presented various unprecedented challenges to healthcare systems globally, prompting society to adopt new preventative strategies to curb spread of the disease. Those experiencing homelessness have been particularly impacted because of barriers to practicing social distancing, inability to isolate, and poor access to care. Project Roomkey was established in California as a statewide measure to provide non-congregate shelter options for individuals experiencing homelessness to properly quarantine. On goal in this study was to analyze the effectiveness of hotel rooms as a safe disposition alternative to hospital admission for patients experiencing homelessness and who were also positive for severe acute respiratory syndrome coronavirus 2 (SARS-CoV-2).
Methods: This was a retrospective, observational study that included chart review of patients who were discharged to the hotel from March 2020–December 2021. We recorded demographic information, index visit details, number of emergency department (ED) visits both a month prior to and following the index visit, admission rates, and number of deaths.
Results: During this 21-month study period, a total of 2,015 patients who identified as undomiciled were tested for SARS-COV-2 in the ED for various reasons. Of those patients, 83 were discharged from the ED to the hotel. Of the 83 patients, 40 (48.2%) ultimately tested positive for SARS-CoV-2 during their index visit. Two patients returned to the ED within seven days with COVID-19-related symptoms, and 10 patients within 30 days. Two patients required subsequent admission with COVID-19 pneumonia. No deaths were recorded within the 30-day follow-up period.
Conclusion: The availability of a hotel served as a safe alternative to hospital admission for patients experiencing homelessness and who were either suspected or confirmed to have COVID-19. It is reasonable to consider similar measures in the management of other transmissible diseases for patients experiencing homelessness who require isolation. [West J Emerg Med. 2023;24(3)431–435.]
Volume 24, NO.3: May 2023 431 Western Journal of Emergency Medicine * † Original Research
INTRODUCTION
The coronavirus 2019 (COVID-19 pandemic caused by severe acute respiratory syndrome coronavirus-2 (SARS COV2) presented various unprecedented challenges to healthcare systems globally since it was first identified in December 2019. According to the National Center for Health Statistics, the highly contagious viral illness had resulted in greater than 6.2 million deaths worldwide by May 2022, thereby quickly emerging as the worst global health crisis since the 1918 influenza pandemic.1 More than one million of those deaths occurred in the United States alone. Although significant progress in clinical research has led to better understanding of the disease and its subsequent management, the continued spread and emergence of variants are of increasing concern.2 Hospitals around the world continue to be overwhelmed by admissions due to COVID-19, prompting society as a whole to adopt new strategies on preventive measures to help curb the spread of the disease.
Those experiencing homelessness have been particularly impacted because of barriers to practicing social distancing, inability to isolate, and poor access to care. Due to these numerous barriers, more extensive interdisciplinary work has been required for individuals experiencing homelessness during the pandemic with emphasis on disposition planning.3 As of 2018, 47% of individuals experiencing homelessness in the US were living in California, and 69% of California’s homeless population was determined to be unsheltered (ie, they were living on the streets as opposed to emergency shelters or transitional housing. That number continues to climb.4
In a statewide attempt to address the COVID-19 pandemic, Project Roomkey was established in California in March 2020. The initiative aimed to provide non-congregate shelter options for individuals experiencing homelessness to properly quarantine, which would consequently aid in recovery, prevent further spread, and minimize strain on the healthcare system due to the disease. People eligible for Project Roomkey included those experiencing homelessness who had tested positive for SARS-CoV-2, had been exposed to the virus, or were at “high risk” of health complications should they have become infected including those who were elderly, immunocompromised, or had other medical comorbidities.5,6
In this study our goal was to analyze the effectiveness of hotel rooms as a safe quarantine option for undomiciled patients discharged from the emergency department (ED) during the COVID-19 pandemic from March 2020–December 2021.
METHODS Study Design and Setting
This was a retrospective, observational study performed at an ED from an inner-city, tertiary care, teaching hospital in Southern California. We collected data from March 2020–December 2021 for a total of 21 months. A hotel in geographic proximity to our hospital that was funded by the state of California was designated as an alternative admission site for
Population Health Research Capsule
What do we already know about this issue? Those experiencing homelessness during the COVID-19 pandemic experienced barriers to practicing social distancing and accessing care.
What was the research question?
Are hotel rooms a safe disposition alternative to hospital admission for undomiciled patients with COVID-19?
What was the major finding of the study?
Two of 83 undomiciled patients (2.4%) who were discharged to a hotel were later admitted for pneumonia. No deaths were reported.
How does this improve population health?
Hotel rooms can be a safe disposition alternative for undomiciled patients with or suspected to have transmissible diseases, such as COVID-19.
patients experiencing homelessness who were suspected or confirmed to be positive for SARS-CoV-2 and determined to have a low likelihood of needing further medical interventions in an inpatient setting.
Patients and Data Collection
Inclusion criteria for the study patients were as follows:
1) identified as homeless in the electronic health record according to information provided during registration; 2) tested positive for SARS-CoV-2 during their ED visit and/ or were suspected to be SARS-CoV-2 positive while pending testing results based on symptoms including fever, cough, fatigue, anosmia, and ageusia; and 3) were medically stable for discharge.
Excluded from the study were patients who were unable to perform activities of daily living and those exhibiting behavioral health issues that deemed them unsafe for hotel room solidarity.
Once eligibility was confirmed, social workers in the ED made arrangements to have the patient transported to one specific, state-funded hotel. At the hotel a registered nurse was on duty. The nurse was available to assist with acute medical needs, thereby potentially mitigating the need for a return visit to the ED from the hotel. The criteria for safe release from the hotel varied as the pandemic progressed and were based on information issued by the US Centers for Disease Control
Western Journal of Emergency Medicine 432 Volume 24, NO.3: May 2023 Discharge to Hotels Rather Than Hospital Admission for COVID Patients Lin et al.
Discharge to Hotels Rather Than Hospital Admission for COVID Patients
and in accord with the California Department of Public Health criteria and San Diego County guidelines.
Demographic information was collected including gender, race, and age. Other data points obtained included Emergency Severity Index (ESI), chief complaint, SARS-CoV-2 testing results, comorbidities, and disposition. The ESI is a five-level triage algorithm that has been shown to help facilitate reliable acuity assessment and predict patient disposition in the ED. We also recorded visits to the ED in the month both prior to and following the index visit and admission rates, as well as number of deaths.
Statistical Methods
Given the small numbers of patients in the study, we analyzed the data using descriptive statistics.
RESULTS
During this 21-month study period, a total of 2,015 patients who identified as undomiciled were tested for SARSCoV-2 in the ED for various reasons. Of those patients, 83 were discharged from the ED to the hotel for quarantine purposes. Within this cohort of patients discharged to the designated hotel, 56 patients (67.5%) were male, 34 (41.0%) were White, 17 (20.2%) were Black, and the average age was 45.7 years (Table 1). The majority of patients had an ESI score of 3-4 (97.6%). Of the 83 patients, 40 (48.2%) ultimately tested positive for SARS-CoV-2 during their index visit, with one patient having an unknown result from a pending test ordered from an outside hospital. The most common presenting symptom was cough in 42 patients (50.6%), followed by 24 with fever (28.9%), 21 with shortness of breath (25.3%), and 18 with prior COVID-19 diagnosis and/ or personal request for COVID-19 testing (21.7%). Common comorbidities represented in this cohort included 28 patients with hypertension (33.7%), 27 with psychiatric illness (32.5%), and 16 with chronic obstructive pulmonary disease and/or asthma (19.3%) (Table 2).
Following the index ED visit, five patients (6.0%) returned within seven days, of whom two presented with possible COVID-19-related symptoms, specifically
worsening shortness of breath and hypotension. Nineteen of the 83 patients (22.9%) returned within 30 days, of whom 10 presented with possible COVID-19-related symptoms including new or worsening cough, shortness of breath, fever, and generalized weakness. Of those 19 patients returning within 30 days, three required hospital admission. Two of the three patients—the same patients who presented to the ED with COVID-related symptoms within seven days following their index visits—were hospitalized for COVID-19 pneumonia, while one was hospitalized for seizures secondary to alcohol withdrawal. No deaths were reported in the 30 days following ED discharge to the hotel (Table 3).
DISCUSSION
With the high transmissibility of SARS-CoV-2, physical isolation of patients positive for this virus has been essential to mitigate spread.7 The implementation of an alternative to hospital admission, such as sequestering in hotel rooms
Volume 24, NO.3: May 2023 433 Western Journal of Emergency Medicine
Lin et al.
(N = 83) Mean age 45.7 Gender Male 56 (67.5%) Female 27 (32.5%) Race White 34 (41.0%) Black 17 (20.2%)
(N = 83) Presenting Symptom Cough 42 (50.6%) Fever 24 (28.9%) Shortness of breath 21 (25.3%) Prior COVID-19 diagnosis and/or personal request for COVID-19 testing 18 (21.7%) Common Comorbidities Hypertension 28 (33.7%) Psychiatric illness 27 (32.5%) COPD and/or asthma 16 (19.3%)
Table 1. Demographics of 83 homeless patients who sheltered in a hotel during the COVID-19 pandemic.
Table 2. Presenting symptoms and comorbidities at emergency department index visit.
(N
83) SARS-CoV-2 testing during index visit Positive 40 (48.2%) Negative 43 (51.8%) Following Index ED visit Returned to ED within 7 days of index visit 5 (6.0%) Returned to ED within 7 days AND required hospitalization 2 (2.4%) Returned to ED within 30 days of index visit 19 (22.9%) Returned to ED within 30 days AND required hospitalization 3 (3.6%) Deaths within 30 days 0 (0%) SARS-CoV-2, severe acute respiratory syndrome coronavirus 2; ED, emergency department.
Table 3. Summary of results.
=
for those experiencing homelessness amid a pandemic, was a novel intervention to facilitate the physical isolation of a population with limited resources to do so. This study demonstrated the feasibility and safety of securing disposition to a hotel for appropriately selected patients infected or concerned to be infected with SARS-CoV-2 and who were experiencing homelessness.
Leveraging the availability of an alternative, safe disposition from the ED for a population experiencing homelessness has several advantages. In the absence of this option, these patients would otherwise have required hospitalization for isolation. Hospitalization is not without risks, such as falls, delirium, and nosocomial infections including SARS-CoV-2.8 Thus, by avoiding unnecessary hospitalization, these risks may have been averted. Additionally, disposition of these patients to a hotel helped to mitigate hospital crowding due to the COVID-19 pandemic. Hospital crowding is characterized by a shortage of inpatient beds rather than lack of ED capacity, as had been previously suspected.9 Various factors can contribute to hospital crowding including increasing age of patients, hospital regulations, and the use of EDs as an alternative to primary care.10 With increased admissions and hospital crowding, the ED can transition from a temporary holding area to an extended patient care unit, thereby decreasing capacity for new admissions. As a result, delays in treatment, increased mortality, and a greater number of hospital readmissions may occur.11 Furthermore, recent studies have shown that when intensive care unit (ICU) beds reach capacity, the risk of death for patients infected with SARS-CoV-2 nearly doubled.10 One study found that once ICU occupancy reaches 85%, the chance of a COVID-19 patient dying was nearly 20% higher compared to when occupancy was between 45-85%.12
Medical safety is essential for patient disposition from the ED to a hotel. We did not establish firm medical criteria to guide patients’ medical appropriateness for the hotel; rather, we let the emergency physicians make this determination. If the patient was medically safe for discharge, then the patient was considered appropriate for disposition to the hotel. Interestingly, most of our patients had an ESI score of 3 or higher, suggesting overall medical stability.13 We did set behavioral standards and establish basic functionality regarding activities of daily living so that the patients would be functional and safe in the hotel. This decision-making process proved to be effective as we had a low rate of return to the ED, with just two of the 83 patients requiring subsequent hospitalization for COVID-19-related disease. Additionally, there were no deaths within 30 days of the index visit.
As of December 2020, Project Roomkey had provided hotel rooms for more than 22,000 people, which equated to about 8% of California’s homeless population and slightly over 10% of the state’s unsheltered population. In response to the success of Project Roomkey as a short-term emergency measure, Project Homekey was developed in a statewide
effort to sustain and rapidly expand housing for individuals experiencing or at risk of homelessness14. The initiative had varied effects over different counties statewide, providing rooms to about 3% of the homeless population in San Diego County compared to 20% in San Francisco County. While our study notably included a smaller cohort, its conclusions are in alignment with more robust studies, such as that by Fleming et al, which demonstrated that shelter-in-place hotels with embedded health services may be an effective strategy to mitigate the risk of SARS-CoV-2 infection and reduce acute care use among undomiciled patients with a history of high health services use.15
Although established as a direct response to the COVID-19 pandemic, the use of hotel rooms could theoretically be expanded beyond the current pandemic in the management of various other communicable diseases. Repurposed hotel rooms can be differentiated from other shelters, which have stricter admission requirements and limitations from ineligibility criteria as well as limited availability. Furthermore, permanent shelters and temporary shelter alternatives, such as convention centers, entail congregate settings that can be counteractive when combating contagious illnesses. Theoretically, the use of hotel rooms could be considered in future public health interventions for transmissible disease outbreaks, such as tuberculosis, measles, scabies, meningitis, shingles, hepatitis A, and influenza. Notably, there is a paucity of literature demonstrating the effectiveness of hotel rooms in disposition-planning for communicable diseases other than COVID-19, as this is an area of emerging research.
LIMITATIONS
There are several limitations to this study, including the small sample size and short period of observation. An additional limitation is that patients self-reported their status of experiencing homelessness. If a patient did not report that they were experiencing homelessness, then that patient would not have been included in this study. In this regard, the self-reporting status of experiencing homelessness may have limited selection and biased the study. Furthermore, we did not have access to the hotel nursing notes or have the potential to mitigate return visits to the ED from the hotel. Our inability to track hotel nurse check-ins with the patients while they were staying at the hotel is a limitation of the study. Additionally, as this was a single-center study with strong social support available to its ED patients, these results may not be generalizable to all EDs.
CONCLUSION
The availability of a hotel for undomiciled patients presenting to the ED for quarantine purposes served as a feasible and safe alternative to hospital admission during the COVID-19 pandemic. It is reasonable to consider similar measures in the management of other transmissible diseases for
Western Journal of Emergency Medicine 434 Volume 24, NO.3: May 2023
et al.
Discharge to Hotels Rather Than Hospital Admission for COVID Patients Lin
patients experiencing homelessness and requiring isolation.
project-roomkey. Accessed September 9, 2021.
Address for Correspondence: Lucia C. Lin, MD, University of California San Diego, Department of Emergency Medicine, 200 W Arbor Dr. San Diego, CA 92103. Email: lucia.c.lin@gmail.com
Conflicts of Interest: By the WestJEM article submission agreement, all authors are required to disclose all affiliations, funding sources and financial or management relationships that could be perceived as potential sources of bias. No author has professional or financial relationships with any companies that are relevant to this study. There are no conflicts of interest or sources of funding to declare.
Copyright: © 2023 Lin et al. This is an open access article distributed in accordance with the terms of the Creative Commons Attribution (CC BY 4.0) License. See: http://creativecommons.org/ licenses/by/4.0/
6. San Diego County. Temporary Lodging Resources. 2021. Available at: https://www.sandiegocounty.gov/content/sdc/hhsa/programs/ phs/community_epidemiology/dc/2019-nCoV/CommunitySectors/ Healthcare_Providers_Community_Clinics_Hospitals_and_ Pharmacies.html#.html. Accessed September 9, 2021.
7. Talic S, Shah S, Wild H, et al. Effectiveness of public health measures in reducing the incidence of Covid-19, SARS-CoV-2 transmission, and Covid-19 mortality: systematic review and meta-analysis [published correction appears in BMJ. 2021 Dec 3;375:n2997]. BMJ. 2021;375:e068302.
8. Chang BP. Can hospitalization be hazardous to your health? A nosocomial-based stress model for hospitalization. Gen Hosp Psychiatry. 2019;60:83-9.
9. Simmons FM. Hospital overcrowding: an opportunity for case managers. Case Manager. 2005;16(4):52-5.
10. Derlet RW, Richards JR. Ten solutions for emergency department crowding. West J Emerg Med. 2008;9(1):24-7.
REFERENCES
1. Centers for Disease Control and Prevention. COVID-19 data from the National Center for Health Statistics. 2021. Available at: https://www. cdc.gov/nchs/covid19/index.htm. Accessed May 1, 2022.
2. Cascella M, Rajnik M, Aleem A, et al. Features, Evaluation, and Treatment of Coronavirus (COVID-19) [Updated 2023 Jan 9]. In: StatPearls [Internet]. Treasure Island (FL): StatPearls Publishing; 2023 Jan-. Available from: https://pubmed.ncbi.nlm.nih. gov/32150360/ (PMID: 32150360)
3. Howells K, Burrows M, Amp M, et al. Exploring the experiences of changes to support access to primary health care services and the impact on the quality and safety of care for homeless people during the COVID-19 pandemic: a study protocol for a qualitative mixed methods approach. Int J Equity Health. 2021;20(1):29.
4. Liu CY, Chai SJ, Watt JP. Communicable disease among people experiencing homelessness in California. Epidemiol Infect 2020;148:e85.
5. California Department of Social Services. Project Roomkey/Housing and Homelessness COVID Response. 2020. Available at: https:// www.cdss.ca.gov/inforesources/cdss-programs/housing-programs/
11. Wilde H, Mellan T, Hawryluk I, et al. The association between mechanical ventilator compatible bed occupancy and mortality risk in intensive care patients with COVID-19: a national retrospective cohort study. BMC Med. 2021;19(1):213.
12. Steventon A, Deeny S, Friebel R, et al. Emergency hospital admissions in England: Which may be avoidable and how? The Health Foundation. 2018. Available at: https://www.health.org.uk/ publications/emergency-hospital-admissions-in-england-which-maybe-avoidable-and-how. Accessed 2021 Sep 9.Tanabe P, Gimbel R, Yarnold PR, et al. Reliability and validity of scores on the Emergency Severity Index version 3. Acad Emerg Med. 2004;11(1):59-65.
13. Tanabe P, Gimbel R, Yarnold PR, Kyriacou DN, Adams JG. Reliability and validity of scores on The Emergency Severity Index version 3. Acad Emerg Med. 2004 Jan;11(1):59-65. doi: 10.1197/j. aem.2003.06.013. PMID: 14709429.
14. Public Policy Institute of California. What lessons can be learned from Project Roomkey? 2020. Available at https://www.ppic.org/ blog/what-lessons-can-be-learned-from-project-roomkey/. Accessed September 9, 2021.
15. Fleming MD, Evans JL, Graham-Squire D, et al. Association of shelter-in-place hotels with health services use among people experiencing homelessness during the COVID-19 pandemic. JAMA Netw Open. 2022;5(7):e2223891.
Volume 24, NO.3: May 2023 435 Western Journal of Emergency Medicine
et al.
to
Hospital
Patients
Lin
Discharge
Hotels Rather Than
Admission for COVID
Original Research
Vaccine Acceptance During a Novel Student-led Emergency Department COVID-19 Vaccination Program
Carly Eastin, MD*
Brendan Moore, MD, MPH*
Aaron Moulton, MD, MPH*
Luke Lefler, BA†
Fuad Haydar, MBA†
Morgan Sweere, MD, MPH‡
Gavin Jones, PhD, PharmD, MHA§
Crystal Sparks, MSAM*
Austin Porter III, DrPH, MPH||
M. Kathryn Allison, PhD, MPH#
Travis Eastin, MD, MS*
University of Arkansas for Medical Sciences, College of Medicine, Department of Emergency Medicine, Little Rock, Arkansas
University of Arkansas for Medical Sciences, College of Medicine, Little Rock, Arkansas
University of Florida, College of Medicine, Department of Emergency Medicine, Jacksonville, Florida
University of Arkansas for Medical Sciences, Department of Pharmacy and Therapeutics, and College of Medicine, Department of Emergency Medicine, Little Rock, Arkansas.
University of Arkansas for Medical Sciences, College of Public Health, Department of Health Policy and Management; Arkansas Department of Health, Little Rock, Arkansas.
University of Arkansas for Medical Sciences, College of Public Health, Department of Health Behavior and Health Education, Little Rock, Arkansas
Section Editor: Elissa M. Schechter-Perkins, MD, MPH
Submission history: Submitted September 12, 2022; Revision received February 1, 2023; Accepted February 9, 2023
Electronically published May 5, 2023
Full text available through open access at http://escholarship.org/uc/uciem_westjem
DOI: 10.5811/westjem.58728
Introduction: The coronavirus 2019 (COVID-19) pandemic not only exacerbated barriers to healthcare but has also highlighted the trend toward increased vaccine hesitancy. Our goal was to improve COVID-19 vaccine uptake through a student-led, emergency department-based (ED) vaccination program.
Methods: This prospective, quality-improvement pilot program used medical and pharmacy student volunteers as COVID-19 vaccine screeners in a southern, urban, academic ED. Patients eligible for vaccination were offered either the Janssen-Johnson & Johnson or the Pfizer-BioNTech COVID-19 vaccine and were educated about vaccine concerns. Vaccine acceptance rates were recorded, as well as reasons for vaccine hesitancy, vaccine brand preferences, and demographics. The primary and secondary quantitative outcomes were overall vaccine acceptance and change in vaccine acceptance after student-provided education, respectively. We performed logistic regression to identify potential variables that correlated with vaccine acceptance. Guided by the Consolidated Framework for Implementation Research, focus group interviews with four key stakeholder groups explored implementation facilitators and barriers.
Results: We screened 406 patients for COVID-19 vaccination eligibility and current vaccine status, the majority of whom were unvaccinated. Of unvaccinated or partially vaccinated patients, vaccine acceptance before education was 28.3% (81/286), and vaccine acceptance after education was 31.5% (90/286) (% difference, 3.1% [95% CI 0.3%-5.9%], P=0.03). The most common hesitancy factors cited were concerns about side effects and safety. Results from the regression analysis indicated that increasing age and Black race were associated with an increased odds of vaccine acceptance. Focus groups revealed implementation barriers, including patient resistance and workflow issues, and facilitators, including student involvement and public health promotion.
Conclusion: Using medical and pharmacy student volunteers as COVID-19 vaccine screeners was successful, and brief education provided by the students led to a modest increase in vaccine acceptance, with overall acceptance of 31.5%. Numerous educational benefits are described.
[West J Emerg Med. 2023;24(3)436–446.]
Western Journal of Emergency Medicine 436 Volume 24, NO.3: May 2023
* † ‡ § || #
INTRODUCTION
Severe acute respiratory syndrome coronavirus, the virus that causes coronavirus 2019 (COVID-19), was first identified in 2019 but quickly spread globally, leading the World Health Organization to declare a worldwide pandemic in March 2020.1 Widespread vaccination has been a crucial aspect of the public health response to the COVID-19 pandemic, contributing to the generation of immunity in the general population.2 The available COVID-19 vaccines are highly effective—decreasing symptomatology, transmission, hospitalization, and death.3
A significant challenge to vaccination is vaccine hesitancy, defined as delay or refusal of vaccination despite availability,4 which has been increasing over the past two decades.5 Vaccine hesitancy is pervasive among emergency department (ED) patients and can diminish their trust in informational sources regarding vaccines.2,6 Among unvaccinated individuals, data suggests decreased trust in medical professionals and medical care. Studies in Arkansas, where the current study took place, demonstrated relatively low rates of vaccination and high rates of vaccine hesitancy.7,8
The ED serves as the primary healthcare resource for approximately one-fifth of the United States (US) population. These underserved patients have been disproportionately affected by the COVID-19 pandemic and are a prime target for a public health response.9 Studies suggest that ED-based COVID-19 vaccine interventions may be a way to reach these vulnerable populations, similar to other public health interventions (eg, HIV testing and influenza vaccination).9–11
The purpose of this quality improvement (QI) pilot study was to improve vaccine uptake among patients offered COVID-19 vaccination in the ED. While it can be difficult for the care team to have thoughtful conversations with vaccinehesitant patients due to time constraints, other resources such as students12,13 may be available. Therefore, in this study we examine COVID-19 vaccine acceptance using medical and pharmacy students as dedicated COVID-19 vaccine screeners for ED patients.
METHODS Study Design and Setting
We conducted a prospective, observational QI pilot in a single, adult, tertiary care, inner-city ED with an annual volume of approximately 60,000 patients. There were two phases: Phase 1 occurred May 21–June 6, 2021, and Phase 2 June 28–August 31, 2021. We chose these dates due to the availability of medical and pharmacy students during their summer break.
Based on a Plan-Do-Study-Act model, Phase 1 served as a needs assessment to measure potential vaccine acceptance.14 In this phase, ED patients were screened for their interest in COVID-19 vaccination. Once we identified sufficient interest in ED-administered vaccines, predefined as theoretical vaccine acceptance of ≥10%, we transitioned to Phase 2 by offering
Population Health Research Capsule
What do we already know about this issue? Vaccine hesitancy has been a growing public health concern exacerbated by the recent COVID-19 pandemic. As a result, vaccine uptake has been suboptimal.
What was the research question?
Can a student-led, ED-based COVID-19 vaccine program adequately address vaccine concerns and improve uptake?
What was the major finding of the study? Medical student education of patients in the ED increased vaccine acceptance rates from 28.3% to 31.5% (mean difference 3.1%, 95% CI 0.3%-5.9%, P=0.03).
How does this improve population health?
A student-led COVID-19 vaccination program can successfully provide patient education and facilitate vaccine uptake in the ED setting, potentially reducing the burden of this disease.
and administering both Janssen-Johnson & Johnson (stocked in the ED) and Pfizer-BioNTech COVID-19 vaccines (stocked in inpatient pharmacy) to ED patients. At the time, the Moderna COVID-19 vaccine was not on formulary. After two months of Phase 2, we conducted a qualitative study of the process through focus-group interviews of key stakeholders.
Because this vaccine initiative was part of a QI project, the university institutional review board determined that this was not human subjects research. We followed the Revised Standards for Quality Improvement Reporting Excellence (SQUIRE)15 reporting guidelines where appropriate.
Selection of Participants
Patients aged ≥12 years were included based on the Emergency Use Authorization (EUA) approval during the study period. Patients <18 years were required to have a guardian present. See Table 1 for details regarding included patients.
Medical and pharmacy students approached patients in four-hour shifts between 10 am and 10 pm daily, with weekdays prioritized. Shifts were shortened to two hours later in the study when the students’ fall classes started. In both phases, the screening process consisted of students assessing for eligibility using the ED trackboard. Early in the initiative, once a student found a patient meeting the age restrictions who was not dispositioned to be admitted, they
Volume 24, NO.3: May 2023 437 Western Journal of Emergency Medicine Eastin et al. Vaccine Acceptance During a Novel Student-led ED COVID-19 Vaccination Program
Table 1. Inclusion and exclusion criteria for patients offered a COVID-19 vaccination in the emergency department.
Inclusion Criteria
● ED patients ≥12 years old
Included but ineligible for vaccination
● Contraindication to COVID-19 vaccination (e.g., history of vaccine allergy)
● Already fully vaccinated by self-reporting
● Had COVID-19 test pending or active symptoms related to COVID-19
Exclusion Criteria
● <18 years old without a guardian
● Already fully vaccinated based on notification in electronic health record
● Dispositioned to be admitteda
● Undergoing active medical care (e.g., clinician in room, patient undergoing a procedure or test/imaging)
● In respiratory isolation
● Patient declined to participate
aAdmitted patients not included because they were offered vaccination at inpatient discharge. ED, emergency department; COVID-19, coronavirus 2019.
would approach the patient. In mid-June 2021, our electronic health record (EHR) update released a banner in every chart that alerted the treatment team to the patient’s COVID-19 vaccination status, which was synced with the health department’s statewide vaccine database. From this point forward, students would enter the chart and assess the vaccine status for patients who fit the age criteria who were not dispositioned to be admitted. If the patients were noted to be fully vaccinated, they were excluded. Partially vaccinated and unvaccinated patients were approached and further assessed for eligibility.
At the start of their shift, students would begin screening in the main ED and the ED clinical decision unit, an ED observation unit that holds observation patients or ED overflow patients. After they had screened and assessed all roomed ED patients, they would check for any new roomed patients before moving to the waiting room or triage area to approach patients waiting to be seen. Once a patient had been approached, patients were not questioned again during that ED visit unless the encounter had been interrupted and not yet completed or the patient asked for time to consider their response. Patients receiving active medical care could be reapproached later in the visit if that portion of their care had been completed and they were available for questioning, but they were excluded if still receiving active medical care or were critically ill.
Overall, 39 students participated, many working in pairs. Before approaching patients independently, students were required to review educational materials on the available
COVID-19 vaccines and complete an in-person orientation, which included supervised patient encounters. Students were also provided with a script to facilitate discussion (see Appendix 1).
Intervention
For vaccine-eligible patients, student volunteers offered the vaccine, recorded concerns, provided education, and then offered the vaccine again. Based on a previous study on vaccine hesitancy, patients’ concerns were categorized as follows: efficacy; safety; side effects; belief that it was unnecessary; belief it was not needed due to prior COVID-19 infection; cost or financial concerns; other, or no concerns.16 If the patient had questions or concerns that the student could not adequately address, the student notified the clinician(s) caring for the patient.
Before vaccines were available in the ED (Phase 1), accepting patients were scheduled at a COVID-19 vaccine clinic. In Phase 2, patients vaccinated in the ED received the required US Centers for Disease Control and Prevention (CDC) COVID-19 vaccine card and applicable Emergency Use Authorization (EUA) fact sheet, as well as information about when and where to obtain a second dose, if indicated. Scheduling in the vaccine clinic was still an option if patients were accepting but declined to be vaccinated in the ED. For patients needing to complete a two-shot series, the second dose was given based on the CDC guidelines. Booster shots were not in use at the time of this study. Due to EHR limitations and hospital policies, only the bedside nurse or a paramedic could physically administer the vaccine. During Phase 2, the ED care team could administer vaccines as part of routine care when student volunteers were not available; however, data on those patients was not collected.
Quantitative Data Collection
Data was recorded using a departmental iPad (Apple Inc, Cupertino, CA). For each patient interviewed, we recorded vaccination status, contraindications to COVID-19 vaccination, vaccine acceptance before and after education, and demographic information related to gender identity, race, and ethnicity. Age was recorded from the EHR. After the initiative, we used a pharmacy report of all patients who were vaccinated in the ED to confirm whether patients recorded in our study as accepting of the vaccine were vaccinated and to quantify the number of vaccines administered outside student volunteer hours.
Qualitative Data Collection
We used the Consolidated Framework for Implementation Research (CFIR)17 to guide qualitative data collection and analysis. We developed a semi-structured interview guide to explore CFIR constructs as potential influences on COVID-19 vaccine implementation in the ED. After two months of the administration phase, the study team (TE, CE, BM, and AM) conducted semi-structured focus group interviews with
Western Journal of Emergency Medicine 438 Volume 24, NO.3: May 2023 Vaccine Acceptance During a Novel Student-led ED COVID-19 Vaccination Program Eastin et al.
key stakeholders, which included 12 medical students, 15 emergency medicine (EM) resident physicians, and 10 EM faculty physicians. Due to difficulty with scheduling a focus group of nurses, we approached ED nurses at random for one-on-one interviews, resulting in 10 interviews with ED nurses. In total, 47 individuals participated in a qualitative interview or focus group. We used a core set of questions for all stakeholder groups, with the addition of specific questions tailored to each stakeholder group (see Appendix 2). All interviews were audio recorded and then transcribed.
Outcomes
For analysis, we combined both phases. The primary outcome was vaccine acceptance after education among vaccine-eligible patients. The secondary outcome was the change in vaccine acceptance after education was provided by the students. Common causes of COVID-19 vaccine hesitancy were reported. We performed a post-hoc analysis to compare the number of vaccines given per student hour vs nonstudent hour. Lastly, we describe implementation facilitators and barriers, educational impacts, and recommendations to improve future implementation processes identified from focus-group interviews.
Analysis
We used descriptive statistics for demographic data. Vaccine acceptance was defined as answering “Yes” when offered the vaccine; vaccine refusal was defined as either answering “No” or “Unsure.” Because we were comparing vaccine acceptance rates within the same population before and after education, a paired sample t-test was used to compare proportions of vaccine acceptance. We used chisquared testing to compare rates of vaccine administration between student-covered hours and uncovered hours. Logistic regression was performed to determine whether any factors were predictive of vaccine acceptance, such as age, gender, race, ethnicity, or category of vaccine-related concerns. All comparisons were made using a two-sided approach with ɑ = 0.05, and 95% confidence intervals are reported where appropriate. Cases that were eligible for vaccination but had missing outcome data were treated with case deletion. If only demographic responses were missing, these cases were included. Data were entered into REDCap, a research electronic data capture tool hosted at the University of Arkansas for Medical Sciences and analyzed in SPSS Statistics for Macintosh version 28.0 (IBM Corp, Armonk, NY) and SAS version 9.4 (SAS Institute, Inc, Cary, NC). The CFIR was used to guide qualitative analysis. Using an inductive approach, we performed thematic analysis of the transcribed interviews, starting with individual coding by authors (TE, CE, BM, and AM).17 After individual coding, the authors (TE, CE, BM, AM, and MS) met to compare and discuss individual coding. Based on group consensus, coding was revised and organized into major themes.
RESULTS
Quantitative Results
We transitioned to Phase 2 after 16 hours of Phase 1, as we met our predetermined threshold for theoretical acceptance of 10% (Phase 1 acceptance rate 29.2%). Combining both phases, we analyzed 406 patients. The average age was 43.5 years (SD 16.3), and the majority were female (55.3%) and reported being Black (50.8%). See Figure 1 for a detailed patient flow chart and Table 2 for demographic information. Of the 388 patients eligible for vaccine questioning, 26.2% were already fully vaccinated. Before education, 286 patients were offered the COVID-19 vaccine, with 81 accepting (28.3%), 164 declining (57.3%), and 41 (14.3%) unsure. After education, 90 agreed to be vaccinated (31.5%); 172 declined (60.1%), and 24 were unsure (8.4%). The change in vaccine acceptance after education was statistically significant (Table 3). The most common vaccine-related concerns were regarding side effects (26.9%), safety (22.4%), or other (11.9%), while many had no concerns (40.2%).
Regression analysis revealed that Black patients were associated with a near three-fold increase in the odds of vaccine acceptance when compared to White patients (OR 2.7, 95% CI 1.30-5.59; P=0.008). We also found that every year increase in age was associated with a 3% increase in the odds of vaccine acceptance (OR 1.03, 95% CI 1.00-1.05; P=0.005). Additionally, patients who stated they “did not believe the vaccine was necessary” or had “other concerns” were significantly less likely to be vaccinated (Table 4).
Based on pharmacy data during Phase 2, 68 of 78 patients (87.2%) who accepted the vaccine were vaccinated. Of the remaining 10 patients, one needed Moderna which was unavailable, two received their vaccinations within 30 days of the ED visit, and one patient had a vaccine ordered but then discontinued. Details on the remaining patients were not available.
The students covered 140 ED hours during Phase 2. This left 1,420 ED hours without coverage, during which an additional 85 patients were vaccinated as part of routine care. Based on these confirmed administrations, there were 0.49 vaccinations per student hour vs 0.06 vaccinations per nonstudent hour, indicating a significant difference in vaccination during times with student coverage (relative risk 8.1, 95% CI 6.2-10.6, P<0.001).
Qualitative Results
The medical students, EM nurses, residents, and faculty involved provided valuable insight into their experiences, revealing 1) barriers to implementation; 2) facilitators to implementation; 3) educational impacts; and 4) recommendations for process improvement (Table 5). We used the CFIR to analyze and describe barriers and facilitators to implementation.17
Volume 24, NO.3: May 2023 439 Western Journal of Emergency Medicine Eastin et al. Vaccine Acceptance During a Novel Student-led ED COVID-19 Vaccination Program
Barriers to Implementation Patients’ Needs and Resources
Many of those interviewed said that patients were resistant to the vaccine. They perceived that the patients’ established religious and political beliefs and opinions about the safety and efficacy of the vaccine contributed to this resistance. Some participants said that patients expressed various safety concerns, such as risk of thromboembolic events. One nurse cited instances where patients became angry and “political.” Similarly, a resident physician referred to vaccines as a “hot topic,” causing the patient to be “mad the rest of the visit,” while a faculty physician reported that mentioning the vaccine “made the patient upset.”
Compatibility with Existing Workflow
Participants described the screening and vaccine administration process and its incompatibility with ED
workflows as a barrier to implementation. Most patients preferred the Pfizer-BioNTech vaccine, which had to be retrieved in person by walking to the inpatient pharmacy; participants stated that obtaining this vaccine was “time consuming” and “cumbersome.” One nurse also reported that the screening questions (when student screeners were not available) were “another thing to tack on” to the existing triage process. Multiple faculty physicians referenced workflow interruptions and increased length of stay. Some students said that the vaccine screening impeded the nursing triage process. One student said, “I felt in the way in triage.”
Facilitators to Implementation Patients’ Needs and Resources
Participants described a common goal of improving the health of patients on an individual and population level, which facilitated implementation of this project. One faculty member said, “Sometimes it feels like it is the biggest thing I accomplish in a shift.” Another faculty member felt that they were doing their part to promote public health and “reduce burden of illness.” Participants, particularly nurses, expressed their belief that the project increased access to the vaccine among patients who might otherwise have significant barriers to receiving healthcare, such as lack of transportation. One nurse stated that “exposure is key, especially in people that wouldn’t have [access] otherwise.” Nearly all participants felt the project was “worthwhile” and should be continued.
Available Resources
Multiple nurses reported that it was far easier to implement the vaccine protocol when students were present. Physicians felt they did not have time to approach patients directly to offer the vaccine, but the students’ presence both reminded them and allowed them to delegate that timeconsuming task. Physicians also said that the students had “plenty of time” to do the screening.
Implementation Process
Similarly, participants noticed increased vaccine uptake when the screening process was started early in the ED visit and that workflow was improved when the process was initiated during triage. Participants felt that this gave the patient time to consider the vaccine and limited delays at discharge. Additionally, students felt that having a script facilitated implementation.
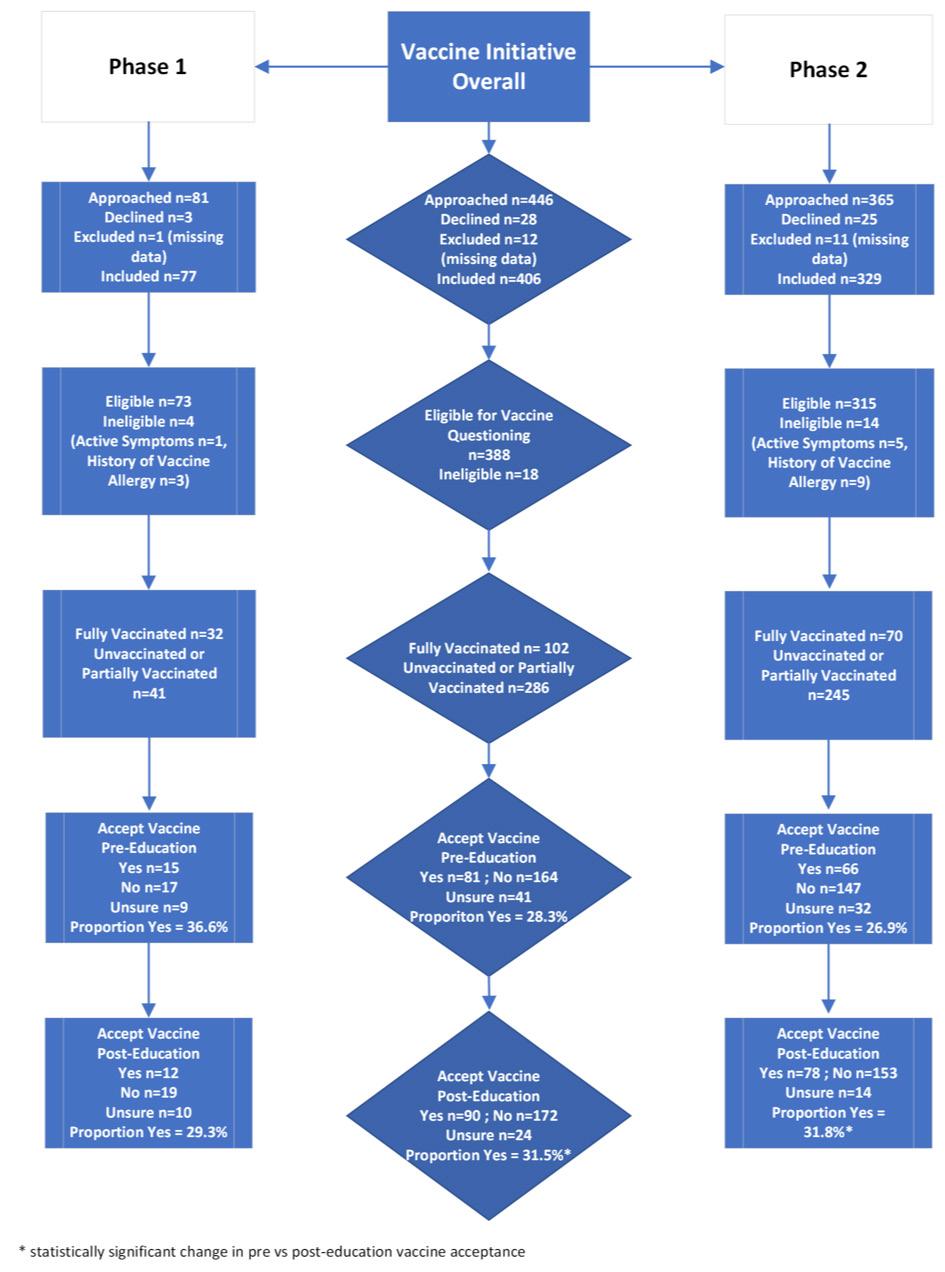
Educational Impacts
The perceived educational benefits to the students were clear across multiple interviews. One resident noted that they “seemed very excited” to be involved. Students cited patient interaction, experience having difficult conversations, exposure to the clinical environment, and EHR experience as educational benefits. One student said, “It was a good skill to learn how to react when talking to … patients who didn’t want
Western Journal of Emergency Medicine 440 Volume 24, NO.3: May 2023 Vaccine Acceptance During a Novel Student-led ED COVID-19 Vaccination Program Eastin et al.
Figure 1. Flowchart of all patients approached and enrolled in emergency department program of medical student education to promote COVID-19 vaccination.
Vaccine Acceptance During a Novel Student-led ED COVID-19 Vaccination Program
Data reported in n with proportions unless otherwise noted. aAge recorded from electronic health record; other demographic data self-reported at the end of interview; some demographic responses missing.
COVID-19, coronavirus disease 2019.
Volume 24, NO.3: May 2023 441 Western Journal of Emergency Medicine
Eastin et al.
All (N=406) Study Phase Phase 1 (N=77) Phase 2 (N=329) N % N % N % Age (years), mean, SD 43.5 16.3 48.4 17.1 42.45 15.9 Gendera Male 166 44.7% 19 37.3% 147 44.7% Female 205 55.3% 32 62.7 173 54.1% Racea Black 188 50.8% 30 58.8% 158 49.5% White 139 37.6% 20 39.2% 119 37.3% Hispanic 25 6.8% 1 2.0% 24 7.5% Asian 1 0.3% 0 0.0% 1 0.3% American Indian/Alaska Native 2 0.5% 0 0.0% 2 0.6% Native Hawaiian/Other Pacific Islander 0 0.0% 0 0.0% 0 0.0% Multiple races 15 4.1% 0 0.0% 15 4.7% Ethnicitya Hispanic or Latino 36 9.8% 3 5.9% 33 10.4% Not Hispanic or Latino 333 90.2% 48 94.1% 287 89.6% History of COVID-19 Vaccination (N=388) Yes with 2-shot series 83 21.4% 29 39.7% 54 17.1% Yes with single shot (Janssen–Johnson & Johnson) 19 4.9% 3 4.1% 16 5.1% Scheduled but not yet received 2 0.5% 1 1.4% 1 0.3% First dose received, second scheduled 8 2.1% 0 0.0% 8 2.5% First dose received, second not scheduled 12 3.1% 1 1.4% 11 3.5% No vaccine 264 68.0% 39 53.4% 225 71.4% Vaccine Concern (N=388) Efficacy 19 6.6% 0 0.0% 19 7.6% Safety 64 22.4% 7 17.1% 57 22.9% Side effects 77 26.9% 14 34.1% 63 25.3% Do not believe it is necessary 22 7.7% 4 9.8% 18 7.2% Already had Covid-19 3 1.0% 0 0.0% 3 1.2% Cost/financial concerns 1 0.3% 0 0.0% 1 0.4% Other 34 11.9% 6 14.6% 28 11.2% No concerns or questions 115 40.2% 19 46.3% 96 38.6% Preferred Vaccine Do not want one 2 2.3% 0 0.0% 2 2.6% Pfizer-BioNTech 52 59.1% 9 75.0% 43 56.6% Janssen–Johnson & Johnson 33 37.5% 2 16.7% 31 40.8% No preference 1 1.1% 1 8.3% 0 0.0%
Table 2. Patient demographics, history of vaccination, and and vaccine hesitancy characteristics.
Vaccine acceptance before education (N, % Yes) Vaccine acceptance after education (N, % Yes) Change in vaccine acceptance with education % difference (95% CI) 81/286 28.3% 90/286 31.5% 3.1% (0.3%-6.0%), P=0.03
Table 3. Change in vaccine acceptance after education: all vaccine-eligible patients.
CI, confidence interval.
aRacial categories were divided into Black, White, and other due to low prevalence of some races. bHesitancy categories of “already had COVID-19” and “cost/financial concerns” were removed from the regression model as they were rarely cited. OR, odds ratio.
the vaccine.”
Students appreciated the clinical experience in light of curricular changes due to the COVID-19 pandemic. One student said, “I haven’t gotten to spend a lot of time in the hospital because of the pandemic, so just getting to talk to patients one on one was really helpful.” Another student said, “I thought it was also helpful to interact with [the EHR] and learn to utilize it and put in an order.”
Most students reported positive experiences interacting with ED staff, describing residents as “helpful,” “excited,” and “complimentary.” Some students felt that similar projects should be offered permanently as elective courses. The educational value was not limited to students. One resident physician reported, “I know more information about the COVID-19 vaccines because of this. Reading more about the data and literature for the vaccines than I probably would have done.”
Recommendations for Process Improvement
Every group recommended ways to improve the implementation process. A common suggestion was to expand the role of students to include vaccine administration. Multiple nurses and students felt that allowing students to administer vaccines would have significantly improved the workflow. Participants also recommended that COVID-19 vaccination be discussed with the patient early in their ED stay to avoid delays. Participants recommended improving educational materials and resources related to vaccination, such as providing a handout of vaccine statistics or other background information for students to reference, as well as playing informative video messages or having an educational poster in the waiting room. A few staff reported that they did
not feel well trained in the COVID-19 vaccine screening and administration process and that additional instruction would have been helpful.
DISCUSSION
The COVID-19 pandemic presented unique challenges for ED patients, clinicians, and even students in clinical training. Because our ED reaches underserved groups, we had the opportunity to assist populations with less access to the COVID-19 vaccine. In an effort to increase vaccination rates within our patient population, we piloted a student-facilitated, ED-based COVID-19 vaccination campaign.
Overall, our pilot campaign was successful in increasing vaccine uptake through a novel student-learning experience. In addition to scheduling patients in our institution’s vaccine clinic, we vaccinated 68 patients in the ED in two months using student-led patient screening and education. Past studies have shown the value of involving medical and pharmacy students in influenza vaccination initiatives,12,13,18 but to our knowledge, studies about student-facilitated, ED-based COVID-19 vaccination programs are lacking. We found a higher vaccine acceptance rate after a brief educational intervention and that more vaccines were given when students were present.
Interestingly, in Phase 1 we saw a non-significant downward trend in vaccine acceptance after the educational intervention. Possible explanations for this include level of student experience and comfort in providing education early in the initiative, lack of effectiveness of the education, or simply the small sample size in Phase 1. Fortunately, we found a statistically significant increase in post-intervention
Western Journal of Emergency Medicine 442 Volume 24, NO.3: May 2023
Eastin et al. Variable Adjusted OR (95% CI) P-value Age per year 1.03 (1.00, 1.05) 0.005 Male (ref=Female) 1.53 (0.84, 2.79) 0.17 Racea Black (ref=White) 2.70 (1.30, 5.59) 0.008 Other (ref=White) 2.08 (0.54, 8.00) 0.29 Hispanic (ref=non-Hispanic) 1.85 (0.45, 7.56) 0.39 Hesitancyb Efficacy 0.39 (0.08, 1.97) 0.25 Safety 0.48 (0.18, 1.31) 0.15 Side effects 0.49 (0.19, 1.28) 0.14 Do not believe it is necessary 0.08 (0.01, 0.73) 0.02 Other 0.21 (0.05, 0.84) 0.03 No questions 1.01 (0.38, 2.73) 0.98
Vaccine Acceptance During a Novel Student-led ED COVID-19 Vaccination Program
Table 4. Logistic regression for primary outcome of vaccine acceptance
Theme CFIR construct
Barriers to implementation
Patients’ needs and resources
Compatibility with existing workflow
Theme description
Patients’ resistance to getting the vaccine
Patients’ concerns for safety and side effects of the vaccine
Workflow interruptions
Location of the preferred vaccines (PfizerBioNTech COVID-19 vaccines stored outside the ED at the hospital pharmacy)
Medical student: “[Hesitant patients] probably made up their mind beforehand.”
Medical student: “Sometimes I felt like [the nurses] were so busy, they wondered why we couldn’t [administer the vaccine] ourselves. Especially in triage. It felt like we were adding a burden to the nurses.”
Facilitators to implementation
Patients’ needs and resources
Available resources
Implementation process
Helping patients and promoting public health
Improved access to care for patients who may otherwise not have access to the vaccine
Involvement and availability of students to screen patients
Early timing of screening in ED visit
Scripting
Educational impacts
Clinical experience for students during COVID-19 pandemic
Improved student comfort with patient interactions, including having difficult conversations with patients
Nurse: “Helping people that don’t have access to healthcare.”
Physician: “Performing [our] civic duty”
Resident physician: “Having the students there was great because they had more time to sit down and go over questions.”
Medical student: “The script was really helpful, if you went blank, to lean back on for every conversation.”
Medical student: “I think it has helped me learn to talk to patients and talk to them about something difficult and teach them something that could actually help their health. …it will make me a better doctor in the future learning how to talk to all different kinds of people.”
Medical student: “I think we have all asked ourselves how we can help during the pandemic, and I think this is a really easy way to help, and you feel like you actually contributed something.”
Recommendations for process improvement
Expand the role of students (have students administer the vaccine)
Workflow/early timing of introducing vaccine
Improve education materials (eg, fact sheets, videos)
Train staff on the screening and vaccine administration process
acceptance in Phase 2 and in the pooled data. Even if this small overall increase based on education may not be clinically significant, we feel that given the reduction in morbidity and mortality risk associated with vaccination that every additional vaccinated patient is beneficial. Regardless of the educational intervention, having students available in the ED to offer vaccines considerably increased our chances of vaccination. We feel this adequately shows that medical and pharmacy students can effectively screen and educate patients about vaccine safety, efficacy, and concerns. While the typical nurse or physician in the ED may not have time to counsel patients on COVID-19 vaccine concerns, student volunteers
Medical student: “It would have been really nice if the students would have been able to give the shots because most of us are trained in that.”
Nurse: “[The provided Vaccine Card and EUA Fact Sheet] don’t have all the answers. We can’t answer all their questions and don’t have the time.”
can fill this role effectively.
Despite the successful vaccination of many patients, the COVID-19 vaccine campaign had multiple barriers to implementation in the ED, which our study identified. The most significant barrier was vaccine hesitancy, as only 31.5% of vaccine-eligible patients accepted the vaccine. Common hesitancy factors were concern for safety, side effects, efficacy, feeling it was not necessary, and several other specific concerns. These mirror barriers encountered in recent studies on influenza and COVID-19 vaccine hesitancy in the ED.2,9,19,20 The modest increase in vaccine acceptance after a brief educational intervention may
Volume 24, NO.3: May 2023 443 Western Journal of Emergency Medicine Eastin et al. Vaccine Acceptance During a Novel Student-led ED COVID-19 Vaccination Program
Table 5. Qualitative themes, CFIR* constructs, and theme descriptions
*CFIR, Consolidated Framework for Implementation Research; ED, emergency department; EUA, Emergency Use Authorization.
Vaccine Acceptance During a Novel Student-led ED COVID-19 Vaccination Program
suggest underlying unmet educational needs or the need for additional information, which is similar to findings by Rodriguez et al, who found lack of information was a common contributor to hesitancy.9
However, patients’ beliefs that vaccination was unnecessary predicted lower acceptance, indicating that overcoming preconceived sentiments about vaccine necessity may be difficult. Likewise, Willis et al found that low fear of COVID-19 predicted lower acceptance.8 We also found that patients with “other” concerns were less likely to be vaccinated, possibly because they had very specific concerns that we could not adequately address. We suspect that these factors most contributed to our difficulty in achieving a more robust change in post-education acceptance; some patients were open to the discussion, but most who declined felt it simply was not needed and were not interested in hearing about the risks of COVID-19 infection or the benefits of vaccination.
Other non-patient related barriers included interference with ED workflow and increased workload for ED staff. These barriers are congruent with studies on influenza vaccination, which found that nurses believed that an ED-based vaccination program was “too time consuming” and cited a “need to simplify documentation process.”19 We received similar feedback; having students serve as screeners helped to reduce these negative impacts.
Mitigating workflow barriers was an important part of facilitating the implementation of our program. This included introducing COVID-19 vaccination early in a patient’s ED visit (when possible), having dedicated individuals to screen, and providing training and a script to students. Cohen et al also found that having dedicated staff (pharmacists) providing the screening and counseling for influenza vaccinations improved the feasibility of EDbased vaccinations.21 Similar to other community-based vaccination programs,18 the desire of stakeholders to provide a worthwhile public health initiative was a strong motivator, as was helping to eliminate barriers for underserved patients, such as transportation.
Our study explored associations between vaccine acceptance and demographic characteristics. Prior literature reveals mixed findings on the association between age and COVID-19 vaccine acceptance.2,9,16,22 Similar to another study in Arkansas, we found that increased age correlated with vaccine acceptance, although this association was not particularly strong.8 In regard to race, recent studies have shown that Black Americans are less likely to accept the COVID-19 vaccine, more likely to delay vaccination, and more likely to report mistrust of the vaccine when compared to White Americans.8,23 However, our study found that Black patients were more likely to accept the COVID-19 vaccine. A recent qualitative study of 72 Black and Latinx individuals revealed the influence of distrust in COVID-19 acceptance, as well as the importance of providing consistent, fact-based information to inform trust and addressing structural barriers
to vaccination.24 Although this was not the focus of our study, it is possible that we saw higher vaccine acceptability among this group because the program made the vaccine more readily available and provided fact-based education.
The COVID-19 pandemic affected not only patients and frontline healthcare workers but also disrupted medical education. In-person clinical rotations were often replaced with virtual learning experiences, and many medical students perceived this lack of clinical experience as a lapse in their medical education.25 Fortunately, once our institution allowed students back into the clinical setting, our program provided a new opportunity for clinical experience while also reducing the burden of vaccination on clinical ED staff. While there have been student-led vaccine campaigns in other settings, to our knowledge this was the first ED-based, student-facilitated vaccination program. The students cited many positive educational impacts, including clinical exposure in the time of COVID-19 when such exposure was lacking, an introduction to having difficult conversations with patients, and the development of skills for educating their future patients about the importance of vaccines as part of preventive health. These clinical, knowledge, and communication benefits were similar to those found in other student-led influenza-vaccine initiatives, and we feel these educational benefits will continue even when clinical rotations are not restricted.18
While previous ED-based studies reported COVID-19 vaccine acceptance of 50-70%,2,9 acceptance in our study was only 31.5%, with 23.8% having confirmed inoculations. We have two potential explanations for this variance. First, our study occurred in summer 2021 after COVID-19 vaccines were widely available and only those eligible for vaccination were analyzed, missing those who had already received it. Second, we were giving vaccines for most of our study, while the prior studies examined hypothetical acceptance. Farrell et al (2022) and Ford et al’s (2022) preliminary data on automated, EHR-prompted, ED-based COVID-19 vaccination programs suggest a much lower true acceptance rate (2.6% in all unvaccinated patients,26 and 3.6% in homeless patients targeted,27 respectively). Our results are more consistent with Cohen et al who found an acceptance rate of 41% when initiating pharmacistdriven, ED influenza vaccinations, possibly due to both our programs having an approach based on personal interaction and education, rather than being computerized.21
Implications and Recommendations for Future Intervention
This program demonstrated that medical and pharmacy students can be an invaluable resource in spearheading ED vaccination campaigns while participating in a valuable educational experience. We believe that our framework could be used to develop other student-driven, preventive health
Western Journal of Emergency Medicine 444 Volume 24, NO.3: May 2023
Eastin et al.
programs implemented in EDs. Our next goal is to finalize a formal ED-based public health elective rotation, during which students can continue this important work, while receiving credit toward their degrees.
LIMITATIONS
There were several limitations. First, this work was performed at a single site. While many EDs likely share similar barriers or facilitators to an ED-based vaccination program, our findings may not be universally applicable and patient populations of other sites may differ. While we did survey patients on their opinions about potential hesitancy factors, our qualitative data does not include patient perspectives. Additionally, although both pharmacy and medical students were vaccine screeners in this project, we only interviewed medical students about their experiences; pharmacy students may have had different perspectives. We were also limited by the short pilot period and small sample size due to resumption of student classes. Response bias may have introduced a trend toward vaccine acceptance, which may be reflected in the findings that only 86% of patients in Phase 2 who accepted were vaccinated in the ED; some likely changed their mind when the vaccine was ready to be given. Finally, outside of quantifying vaccinations, we were not able to collect data on patients who were offered vaccination outside student volunteer hours and specifics on patients scheduled in the vaccine clinic were not available.
CONCLUSION
Emergency departments within academic health centers are ideal environments in which to disseminate the COVID-19 vaccine to underserved patients, as well as engage healthcare students in vaccine screening. Our pilot study found that nearly one-third of patients were willing to be vaccinated, and patients were slightly more likely to accept the vaccine after a brief educational intervention. This student-led model is unique as both healthcare students and patients benefited from the educational component of the vaccine campaign. Although patients’ concerns about the vaccine and workflow interruptions were implementation barriers, facilitators included the involvement of students, providing scripts for students, and clinicians’ perception that the initiative improves patients’ access to the vaccine. Our study suggests that a student-led, COVID-19 vaccine initiative is not only feasible in the ED but viewed as promoting public health and providing a valuable educational experience.
Address for Correspondence: Carly Eastin, MD, University of Arkansas for Medical Sciences, Department of Emergency Medicine, 4301 W. Markham Street, Slot 584, Little Rock, AR 72205. Email: cdeastin@uams.edu
Conflicts of Interest: By the WestJEM article submission agreement, all authors are required to disclose all affiliations, funding sources and financial or management relationships that could be perceived as potential sources of bias. No author has professional or financial relationships with any companies that are relevant to this study. There are no conflicts of interest or sources of funding to declare.
Copyright: © 2023 Eastin et al. This is an open access article distributed in accordance with the terms of the Creative Commons Attribution (CC BY 4.0) License. See: http://creativecommons.org/ licenses/by/4.0/
REFERENCES
1. Awadasseid A, Wu Y, Tanaka Y, et al. Current advances in the development of SARS-CoV-2 vaccines. Int J Biol Sci. 2021;17(1):819.
2. Fernández-Penny FE, Jolkovsky EL, Shofer FS, et al. COVID-19 vaccine hesitancy among patients in two urban emergency departments. Acad Emerg Med. 2021;28(10):1100-7.
3. Flanagan KL, MacIntyre CR, McIntyre PB, et al. SARS-CoV-2 vaccines: Where are we now? J Allergy Clin Immunol Pract 2021;9(10):3535-43.
4. MacDonald NE, SAGE Working Group on Vaccine Hesitancy. Vaccine hesitancy: definition, scope and determinants. Vaccine 2015;33(34):4161-4.
5. Phadke VK, Bednarczyk RA, Salmon DA, et al. Association between vaccine refusal and vaccine-preventable diseases in the United States: a review of measles and pertussis. JAMA 2016;315(11):1149-58.
6. Solomon SS, Hsieh YH, Rothman RE, et al. A targeted geospatial approach to COVID-19 vaccine delivery: findings from the Johns Hopkins Hospital Emergency Department. MedRxiv. Published online May 4, 2021.
7. Purvis RS, Willis DE, Moore R, et al. Perceptions of adult Arkansans regarding trusted sources of information about the COVID-19 pandemic. BMC Public Health. 2021;21(1).
8. Willis DE, Andersen JA, Bryant-Moore K, et al. COVID-19 vaccine hesitancy: race/ethnicity, trust, and fear. Clin Transl Sci 2021;14(6):2200-7.
9. Rodriguez RM, Torres JR, Chang AM, et al. The rapid evaluation of
Volume 24, NO.3: May 2023 445 Western Journal of Emergency Medicine Eastin et al. Vaccine Acceptance During a Novel Student-led ED COVID-19 Vaccination Program
Vaccine Acceptance During a Novel Student-led ED COVID-19 Vaccination Program
COVID-19 vaccination in emergency departments for underserved patients study. Ann Emerg Med. 2021;78(4):502-10.
10. Heinert SW, McCoy J, Eisenstein R, et al. Reaching the hard to reach: characteristics of patients who received a COVID-19 vaccine in the emergency department. Acad Emerg Med. 2021;28(9):1081-3.
11. Waxman MJ, Moschella P, Duber HC, et al. Emergency departmentbased COVID-19 vaccination: Where do we stand? Acad Emerg Med. 2021;28(6):707-9.
12. Church D, Johnson S, Raman-Wilms L, et al. A literature review of the impact of pharmacy students in immunization initiatives. Can Pharm J. 2016;149(3):153-65.
13. Carroll PR, Hanrahan J. Development and evaluation of an interprofessional student-led influenza vaccination clinic for medical, nursing and pharmacy students. Pharm Pract. 2021;19(4):2449.
14. Plan-Do-Study-Act (PDSA) Directions and Examples. Agency for Healthcare Research and Quality. 2020. Available at: https://www. ahrq.gov/health-literacy/improve/precautions/tool2b.html. Accessed May 1, 2021.
15. Ogrinc G, Davies L, Goodman D, et al. SQUIRE 2.0 (Standards for Quality Improvement Reporting Excellence): revised publication guidelines from a detailed consensus process. BMJ Qual Saf 2016;25(12):986-92.
16. Callaghan T, Moghtaderi A, Lueck JA, et al. Correlates and disparities of intention to vaccinate against COVID-19. Soc Sci Med 2021;272:113638.
17. Damschroder LJ, Aron DC, Keith RE, et al. Fostering implementation of health services research findings into practice: a consolidated framework for advancing implementation science. Implement Sci 2009;4:50.
18. Rizal RE, Mediratta RP, Xie J, et al. Galvanizing medical students in
the administration of influenza vaccines: the Stanford Flu Crew. Adv Med Educ Pract. 2015;6:471-7.
19. Venkat A, Hunter R, Hegde GG, et al. Perceptions of participating emergency nurses regarding an ED seasonal influenza vaccination program. J Emerg Nurs. 2012;38(1):22-9.
20. Ozog N, Steenbeek A, Curran J, et al. Attitudes toward influenza vaccination administration in the emergency department among patients: a cross-sectional survey. J Emerg Nurs. 2020;46(6):802-13.
21. Cohen V, Jellinek-Cohen SP, Likourezos A, et al. Feasibility of a pharmacy-based influenza immunization program in an academic emergency department. Ann Pharmacother. 2013;47(11):1440-7.
22. Kreps SE, Kriner DL. Factors influencing Covid-19 vaccine acceptance across subgroups in the United States: Evidence from a conjoint experiment. Vaccine. 2021;39(24):3250-8
23. Kricorian K, Turner K. COVID-19 Vaccine acceptance and beliefs among Black and Hispanic Americans. PLoS One 2021;16(8):e0256122.
24. Balasuriya L, Santilli A, Morone J, et al. COVID-19 vaccine acceptance and access among Black and Latinx communities. JAMA Netw Open. 2021;4(10):e2128575.
25. Sharma D, Bhaskar S. Addressing COVID-19 burden on medical education and training: the role of telemedicine and tele-education during and beyond pandemic. Front Public Health. 2020;8:589669.
26. Farrell NM, Roberts S, Kirk S, et al. Implementation of an emergency department COVID-19 vaccination program at an urban, safety-net hospital. Acad Emerg Med. 2022;SAEM Abstracts(29):S414.
27. Ford J, Rouleau S, Wagner J, et al. Assessment of a COVID-19 vaccination protocol in the emergency department for persons experiencing homelessness. Acad Emerg Med. 2022;SAEM Abstracts(29):S226.
Western Journal of Emergency Medicine 446 Volume 24, NO.3: May 2023
Eastin et al.
Association Between the Affordable Care Act and Emergency Department Visits for Psychiatric Disease
Afsaneh Asgharian, PhD
Jane B. Neese, PhD
M. Lori Thomas, PhD
A. Suzanne Boyd, PhD
Yvette M. Huet, PhD
Section Editor: Marc Martel, MD
College of Health and Human Services, University of North Carolina at Charlotte, Charlotte, North Carolina
Submission history: Submitted June 6, 2022; Revision received January 30, 2023; Accepted January 21, 2023
Electronically published May 5, 2023
Full text available through open access at http://escholarship.org/uc/uciem_westjem
DOI: 10.5811/westjem.57630
Introduction: Emergency department (ED) utilization for psychiatric disease is increasing, and a lack of health insurance has been identified as a potential ca use of preventable or avoidable ED use. Through the Affordable Care Act (ACA), more uninsured individuals gained health insurance; however, the effects of increased health insurance coverage on ED utilization for psychiatric disease have not been examined.
Methods: We performed a longitudinal, cross-sectional analysis of data from the Nationwide Emergency Department Sample, the largest all-payer ED database in the US, which contains data on over 25 million ED visits each year. We examined ED utilization for psychiatric disease as the primary reason for visit among adults aged 18-64. We compared the proportion of ED visits with a psychiatric diagnosis during post-ACA years (2011-2016) to pre-ACA (2009) using logistic regression adjusted for age, gender, payer, and hospital region.
Results: The proportion of ED visits with psychiatric diagnosis increased from pre-ACA (4.9%) to post-ACA years (ranging from 5.0-5.5%). There was a significant difference in the proportion of ED visits with a psychiatric diagnosis when comparing each post-ACA year with pre-ACA, with adjusted odds ratios ranging from 1.01-1.09. Among ED visits with a psychiatric diagnosis, the most common age group was 26-49 years, and patients were more likely to be male than female and to have visited urban rather than rural hospitals. During post-ACA years (2014-2016), private and uninsured payers decreased, Medicaid payers increased, and Medicare payers increased in 2014 and decreased in 2015-2016 compared to pre-ACA.
Conclusion: With the ACA more people gained health insurance, yet ED visits for psychiatric disease continued to increase. These results suggest that increasing access to health insurance alone is not sufficient to reduce ED utilization for patients wit h a psychiatric disease. [West J Emerg Med. 2023;24(3)447–453.]
INTRODUCTION
Mental disorders are common in the United States (US), with about 25% of adults with a mental disorder1,2 and 22.3% with serious mental disorders.1 However, 57.4% of adults with mental disorders and 33.3% of those with serious mental disorders did not receive mental health services in the past
year.3 Multiple studies have shown that psychiatric disorders account for a large and growing number of all emergency department (ED) visits in the US.2,4-7 From 1992 to 2000, psychiatric-related ED visits for adults increased by 15%.4 Visits to the ED increased by 8.6% from 2006 to 2011 for all adults aged 18-64, but they increased by 20.5% for primary
Volume 24, NO.3: May 2023 447 Western Journal of Emergency Medicine Original Research
psychiatric diagnoses and by 53.3% for ED visits with psychiatric comorbidity.6
The number of ED visits for patients with psychiatric disease continues to increase. With increasing numbers of psychiatric patients and limited availability or access to outpatient, mental healthcare facilities, psychiatric patients turn to EDs for their healthcare.8 The Affordable Care Act (ACA) improved access, affordability, and quality of healthcare and required benefits for mental health and substance use disorder through the essential health benefits (EHB). Among the EHBs included were ambulatory and emergency services, hospitalization, and mental health and substance use disorder services, including behavioral health treatment and prescription drugs.9
A lack of health insurance has been identified as a contributor to the utilization of emergency services for non-emergent psychiatric conditions,10 and a lack of mental healthcare resources is frequently cited as a reason for seeking emergency psychiatric care.11,12 With the enactment of the ACA, the number of uninsured individuals declined by 43%, from 48.6 million in 2010 to 28.6 million in 2015,13 and the percentage of uninsured nonelderly adults aged 18-64 declined by 41% from 2010 to 2018.14 If lack of health insurance was a primary reason for ED utilization for psychiatric disease, then an increase in health insurance coverage would be expected to reduce ED utilization for patients with psychiatric diagnosis. However, whether a reduction in the uninsured population in the US is correlated to changes in ED utilization for psychiatric disease is currently unknown.
The 2016 National Hospital Ambulatory Medical Care Survey (NHAMCS) showed that nearly 5.5 million (3.8%) ED visits had a primary diagnosis of mental disorder,7, and the proportion of ED visits with a psychiatric diagnosis increased from 4.1% to 5.4% between 2007– and 2016.15 However, that survey did not specifically examine the effect of the ACA on ED visits with psychiatric diagnosis from post-ACA compared to pre-ACA years. In our study, we used nationally representative ED discharge data from pre-ACA and postACA years to compare the proportion of ED visits for psychiatric disease in years before versus after implementation of the ACA. Our primary objective in this study was to evaluate the association between the ACA and ED visits for patients with psychiatric disease for post-ACA years 20112016 and pre-ACA year 2009.
METHODS
Standard Protocol Approvals, Registrations, and Patient Consents
This study was exempt from approval by the University of North Carolina at Charlotte Institutional Review Board due to the fully de-identified nature of the data, and informed consent was not required. The analysis was compliant with the Healthcare Cost and Utilization Project data use agreement policy.
Population Health Research Capsule
What do we already know about this issue?
A lack of mental health care resources is a contributor to ED use. The Affordable Care Act (ACA) improved benefits for mental health, yet ED use continues to increase.
What was the research question?
We evaluated the association of the ACA and ED visits for adults with psychiatric disease post-ACA, 2011-2016, and pre-ACA, 2009.
What was the major finding of the study?
The analysis of ED visits with primary psychiatric diagnosis for post-ACA 2016 vs pre-ACA year was significant with odds ratio (95% CI) of 1.040 (1.037, 1.043).
How does this improve population health?
Increasing access to health insurance alone is not sufficient to reduce ED use by patients with psychiatric disease.
Data
We used data from the Nationwide Emergency Department Sample (NEDS), which is the largest all-payer ED database in the US. The NEDS consists of all ED visits occurring at one of over 950 hospital-based EDs with more than 25 million unweighted observations per year.16 The NEDS database consists of ED visit-level discharge data. Diagnoses or disease conditions were coded and collected for each ED visit with up to 15 diagnoses for 2009-2013 and up to 30 diagnoses for 2014-2016. According to ambulatory coding guidelines, the diagnosis code in the first position indicates the primary reason for the healthcare encounter and is thus referred to as the “primary diagnosis”; all other diagnoses are placed in a secondary position. The diagnosis codes of NEDS were based on the International Classification of Diseases, 9th Clinical Modification (ICD-9-CM) for the years 20092014 and the first three-quarters of 2015 and the 10th Clinical Modification (ICD-10-CM) for the last quarter of 2015 and 2016. We used data from 2009 and 2011-2016 for analysis.
Population
We identified all ED visits for adults aged 18-64 with psychiatric diagnoses in the primary diagnosis position (ICD9-CM 290-319 and ICD-10-CM F01-F99). We excluded adults ≥65 years because Medicare is the primary insurer for older adults and was not affected or designed to be impacted
Western Journal of Emergency Medicine 448 Volume 24, NO.3: May 2023 Association Between the ACA and ED Visits for Psychiatric Disease Asgharian et al.
Asgharian et al.
Association Between the ACA and ED Visits for Psychiatric Disease
by the ACA. We categorized psychiatric diagnoses by ICD-9CM code into the following categories: Dementias/Delusional/ Transient/Persistent (290, 293, 294, 297); Drug and Alcohol Dependence (291, 292, 303, 304, 305); Schizophrenic and Other Psychoses (295, 298); Depressive and Episodic Mood (296, 311); Anxiety, dissociative and somatoform (300); Acute and Adjustment Reaction to Stress (308, 309); and Other (299, 301, 302, 306, 307, 310, 312-319). Since the last quarter of 2015 and the 2016 data had ICD-10 codes, all ICD-9 codes were mapped to ICD-10 detailed levels using the Agency for Healthcare Research and Quality MAPIT toolkit. The MAPIT tool takes a set of ICD-9 codes at each level, up to five digits, and maps them to equivalent ICD-10 codes at each level up to five digits using the Centers for Medicare & Medicaid Services equivalence mapping.17
Outcomes and Covariates
The primary endpoint was the proportion of ED visits with a psychiatric diagnosis in the primary diagnosis position. This endpoint was summarized for each pre-ACA and postACA year, and each post-ACA year was compared with the pre-ACA reference using logistic regression adjusting for the following covariates: age (18-25, 26-49, 50-64); gender; payer (Medicare, Medicaid, private, uninsured); and hospital region (urban, rural). Race is not recorded in the NEDS database. We performed adjusted and unadjusted analyses of the proportion of ED visits with primary psychiatric diagnosis for each postACA year compared to pre-ACA. For statistical analyses, all tests were two-sided, with significance interpreted at α = 0.05. The odds ratio (OR) and 95% confidence interval (CI) using Mantel-Haenszel chi-Square (χ2) statistics were reported. We used SAS statistical software version 9.4 (SAS Institute, Inc, Cary, NC) for all analyses. The study results are reported using the Strengthening the Reporting of Observational studies in Epidemiology (STROBE) guidelines.18
RESULTS
The number of observed annual ED visits for adults aged 18-64 was 17.6 million in 2009 and ranged from 17.8 million to 20.1 million for 2011-2016 (Table 1). The number of ED visits with primary psychiatric diagnosis was more than 866,000 in pre-ACA 2009 and increased to between 892,000 and 1.1 million in post-ACA years. The proportion of ED visits with primary psychiatric diagnosis for pre-ACA and post-ACA years increased from 4.9% in 2009 to ranging from 5.0% to 5.2% in 2011-2013, and between 5.3% to 5.5% in 2014-2016 (Table 1). The number of ED visits continued to increase in each post-ACA year compared to pre-ACA, with more than one million ED visits with primary psychiatric diagnosis each year from 2014-2016. In both adjusted and unadjusted analyses, there was a statistically significant difference in the proportion of ED visits with primary psychiatric diagnosis for each postACA year compared to pre-ACA 2009 with adjusted ORs
ranging from 1.01-1.09 and unadjusted ORs ranging from 1.02 to 1.12 (Table 2). All adjusted and unadjusted analyses of the proportion of ED visits with psychiatric diagnosis and all covariates (age, gender, payer, hospital region) were statistically significant (P<0.001).
The most common age group among ED visits with primary psychiatric diagnosis was 26-49 (54.2% to 57.5%) followed by 50-64 (22.6% to 26.1%), and 18-25 (19.5% to 20.6%). Males (55.3% to 57.9%) had more ED visits with primary psychiatric diagnosis than females (42.1% to 44.7%) (Table 3).
The proportion of ED visits with primary psychiatric diagnosis where Medicare was the primary expected payer increased from 14.5% in 2009 to 15.2% in 2014 and decreased to 14.2% in 2015 and 14.0% in 2016. For Medicaid, it increased from 25.7% in pre-ACA 2009 to 28.7% in 2013 and continued to increase in post-ACA 2014-2016 from 36.1% to 38.8%. There was a decrease in the proportion of ED visits with primary psychiatric diagnosis for the private payers from 25.9% in 2009 to 22.4% in 2013, and between 22.7% to 24.3% in 2014-2016. The same trend was observed for the uninsured payers with the proportion of ED visits of 33.8% in 2009, 32.2% to 33.7% in 2011-2013 with significant decrease from 26.1% in 2014 to 23.2% in 2016 (Table 4). There was a significant increase in the proportion of ED visits for Medicaid payers and a significant decrease for uninsured payers in postACA 2014-2016 compared to pre-ACA and the other postACA years.
The proportion of ED visits with primary psychiatric diagnosis for urban hospitals increased from 95.6% in preACA 2009 to post-ACA 2011 to 2015, ranging from 95.8% to 97.1%, and decreased to 95.7% in 2016. For rural hospitals, the proportion of ED visits decreased from 4.4% in pre-ACA 2009 to 2.9% in 2015 and 4.3% in 2016 (Table 4).
The most common primary psychiatric diagnoses were for Drug/Alcohol disorders (34.8% to 43.1%), followed by Depressive (19.4% to 25.8%) and Anxiety disorders (17.9% to 19.4%), and other psychiatric diagnoses, Schizophrenic disorders (11.3% to 13.5%), Dementia (0.7% to 1.0%), and Stress (3.0% to 3.6%) (Table 5).
DISCUSSION
The proportion of ED visits and ED visits with psychiatric diagnosis for adults aged 18-64 increased in the post-ACA years compared to pre-ACA. Even when accounting for the increase in ED volume over time, the proportion of ED visits with psychiatric diagnosis increased and was higher in postACA years 2014-2016 than pre-ACA year and other post-ACA years. These results suggest that increasing access to health insurance alone is not sufficient to reduce ED utilization for patients with a psychiatric disease.
We found that psychiatric diagnoses accounted for 4.9% in 2009 and 5.0-5.5% of ED visits in the US from 2011-2016. This is consistent with findings from the NHAMCS, where the
Volume 24, NO.3: May 2023 449 Western Journal of Emergency Medicine
Association Between the ACA and ED Visits for Psychiatric Disease
Percentages are based on total visits, N. ACA, Affordable Care Act; ED, emergency department.
a Adjusted analysis model adjusted for age, gender, payer and hospital region. b P-value using χ2 test. All statistical tests and covariates were significant (P<0.001). ACA, Affordable Care Act; ED, emergency department; CI, confidence interval.
Percentages are based on total visits, N. ACA, Affordable Care Act; ED, emergency department.
Western Journal of Emergency Medicine 450 Volume 24, NO.3: May 2023
Asgharian et al. Year All ED visits adults 18-64 n Primary or secondary psychiatric diagnosis adults 18-64 n (%) Primary psychiatric diagnosis adults 18-64 n (%) Pre-ACA 2009 17,645,539 4,253,110 (24.1) 866,810 (4.9) Post-ACA 2011 17,845,772 4,717,856 (26.4) 892,511 (5.0) 2012 19,325,068 5,267,941 (27.3) 984,964 (5.1) 2013 18,412,805 5,261,875 (28.6) 963,247 (5.2) 2014 19,498,007 5,832,444 (29.9) 1,066,007 (5.5) 2015 18,738,803 5,857,686 (31.3) 1,018,056 (5.4) 2016 20,073,238 5,986,274 (29.8) 1,054,731 (5.3)
Table 1. Summary of emergency department visits for adults aged 18-64.
Post-ACA vs Pre-ACA Analysis of ED visits with primary psychiatric diagnosis Adjusted analysis a Unadjusted analysis Odds ratio (95% CI) b Odds ratio (95% CI) b 2011 vs 2009 1.012 (1.008, 1.015) 1.019 (1.016, 1.022) 2012 vs 2009 1.031 (1.028, 1.034) 1.040 (1.036, 1.043) 2013 vs 2009 1.060 (1.057, 1.063) 1.069 (1.065, 1.072) 2014 vs 2009 1.086 (1.083, 1.089) 1.119 (1.116, 1.123) 2015 vs 2009 1.067 (1.064, 1.071) 1.112 (1.109, 1.115) 2016 vs 2009 1.040 (1.037, 1.043) 1.073 (1.070, 1.077)
Table 2. Analysis of emergency department visits with primary psychiatric diagnosis, post- vs pre-Affordable Care Act.
Age (Year) Gender Year N 18 - 25 26 - 49 50 - 64 Male Female Pre-ACA 2009 866,810 172,429 (19.9) 498,220 (57.5) 196,161 (22.6) 478,809 (55.3) 387,334 (44.7) Post-ACA 2011 892,511 183,478 (20.6) 493,806 (55.3) 215,227 (24.1) 498,973 (55.9) 393,473 (44.1) 2012 984,964 199,197 (20.2) 538,987 (54.7) 246,780 (25.1) 549,789 (55.8) 435,123 (44.2) 2013 963,247 193,247 (20.1) 524,007 (54.4) 245,993 (25.5) 543,271 (56.4) 419,915 (43.6) 2014 1,066,007 210,498 (19.8) 577,819 (54.2) 277,690 (26.1) 612,818 (57.5) 453,152 (42.5) 2015 1,018,056 198,452 (19.5) 555,257 (54.5) 264,347 (26.0) 589,326 (57.9) 428,642 (42.1) 2016 1,054,731 205,351 (19.5) 578,560 (54.8) 270,820 (25.7) 610,655 (57.9) 443,966 (42.1)
Table 3. Emergency department visits with primary psychiatric diagnosis by age and gender.
Asgharian et al.
Percentages are based on total visits, N. ACA, Affordable Care Act; ED, emergency department.
Association Between the ACA and ED Visits for Psychiatric Disease
Percentages are based on all psychiatric diagnoses, N.
proportion of ED visits with a psychiatric diagnosis for adults ≥19 years was 4.3-5.4% from 2009-2016.15
With the ACA, more people gained health insurance, and insurance plans were required to include mental health and substance use disorder treatment and services as part of the EHBs.19 Yet the number and proportion of all ED visits and ED visits for patients with psychiatric diseases continued to increase and was significantly higher for post-ACA than preACA years in our study. A lack of health insurance limits access to outpatient mental health services. If this was the primary driver of ED utilization for psychiatric disease, then increased insurance coverage should have led to greater outpatient mental
health services utilization, which would in turn have decreased ED utilization for psychiatric disease. However, we observed the opposite trend: ED visits for psychiatric disease increased despite greater insurance coverage.
There are several potential reasons for the paradoxical increase in ED visits for psychiatric disease despite greater insurance coverage. First, health insurance coverage is not a guarantee of outpatient healthcare access. For example, people with health insurance may not seek medical or psychiatric care due to access barriers, lack of a designated primary care or mental health physician, or high out-of-pocket costs. In addition, some mental health clinicians may not accept
Volume 24, NO.3: May 2023 451 Western Journal of Emergency Medicine
N Payer Hospital region Year Medicare Medicaid Private Uninsured Urban Rural Pre-ACA 2009 866,810 125,094 (14.5) 221,664 (25.7) 223,359 (25.9) 290,938 (33.8) 828,261 (95.6) 38,549 (4.4) Post-ACA 2011 892,511 134,890 (15.2) 262,006 (29.5) 205,794 (23.2) 286,005 (32.2) 855,365 (95.8) 37,146 (4.2) 2012 984,964 149,962 (15.3) 286,841 (29.2) 219,056 (22.3) 327,253 (33.3) 949,855 (96.4) 35,109 (3.6) 2013 963,247 146,099 (15.2) 276,061 (28.7) 215,432 (22.4) 323,488 (33.7) 927,678 (96.3) 35,569 (3.7) 2014 1,066,007 161,764 (15.2) 383,703 (36.1) 241,292 (22.7) 277,494 (26.1) 1,027,502 (96.4) 38,505 (3.6) 2015 1,018,056 144,011 (14.2) 393,715 (38.8) 237,632 (23.4) 240,764 (23.7) 988,728 (97.1) 29,328 (2.9) 2016 1,054,731 146,990 (14.0) 405,756 (38.5) 256,005 (24.3) 244,169 (23.2) 1,009,363 (95.7) 45,368 (4.3)
Table 4. Emergency department visits with primary psychiatric diagnosis by payer and by hospital region.
Year N Dementia Drug / alcohol Schizophrenic Depressive Anxiety Stress Other 2009 866,810 5,887 (0.7) 301,495 (34.8) 110,006 (12.7) 223,398 (25.8) 155,117 (17.90) 28,340 (3.3) 42,567 (4.9) 2011 892,511 5,982 (0.7) 331,756 (37.2) 106,734 (12.0) 207,067 (23.2) 165,474 (18.5) 31,968 (3.6) 43,530 (4.9) 2012 984,964 6,586 (0.7) 359,446 (36.5) 121,017 (12.3) 234,250 (23.8) 184,013 (18.7) 32,785 (3.3) 46,867 (4.8) 2013 963,247 6,900 (0.7) 357,571 (37.1) 119,226 (12.4) 224,840 (23.3) 175,901 (18.3) 32,716 (3.4) 46,093 (4.8) 2014 1,066,007 7,804 (0.7) 393,245 (36.9) 144,214 (13.5) 245,995 (23.1) 192,138 (18.0) 32,891 (3.1) 49,720 (4.7) 2015 1,018,056 8,577 (0.8) 420,313 (41.3) 117,213 (11.5) 208,329 (20.5) 188,095 (18.5) 30,677 (3.0) 44,852 (4.4) 2016 1,054,731 10,498 (1.0) 454,532 (43.1) 118,775 (11.3) 204,245 (19.4) 204,684 (19.4) 33,482 (3.2) 28,515 (2.7)
Table 5. Summary of primary psychiatric diagnoses.
Association Between the ACA and ED Visits for Psychiatric Disease
certain health insurance, such as Medicaid. Second, having mental healthcare access alone may not sufficiently prevent psychiatric emergencies from occurring. Although psychiatric diseases can be managed in an outpatient setting, some conditions may require emergency care, and not all ED visits for psychiatric diseases are preventable or avoidable.2,20
Psychiatric-related ED visits have continued to increase, both before and after the ACA. Much of the literature on preventable ED visits for psychiatric disease has focused on a lack of alternative healthcare resources for acute psychiatric disease. With the replacement of state mental hospitals by community mental health centers, there has been a shift from inpatient to outpatient care, which has left some patients with severe mental illness at risk for lapses in care and readmission. Furthermore, community mental health centers have declined over time due to a lack of state and local funding. As a result, in 2003 the Subcommittee on Acute Care to the President’s New Freedom Commission reported that since 1970, the total number of inpatient psychiatric beds per capita and the number of state and county psychiatric beds per capita declined by 62% and 89%, respectively.21
We observed that the most common psychiatric diagnosis was Drug and Alcohol disorders followed by Depressive, Anxiety and Schizophrenic disorders. We also observed a change in the payer mix for ED visits with primary psychiatric diagnosis before vs after passage of the ACA. The ACA aimed to increase access to health insurance through two different mechanisms: 1) enhanced access to private health insurance plans through the marketplace; and 2) an increase in Medicaid eligibility.19 In our study, a decrease in uninsured patients was offset by an increase in Medicaid-insured patients but not by private payers. This suggests that the effect of the ACA on uninsured ED visits with primary psychiatric diagnosis was mediated by Medicaid rather than private insurance.
LIMITATIONS
Our study had several limitations. First, while the ACA was passed in 2010, it was not fully implemented until January 1, 2014. Therefore, the classification of 2011-2013 as post-ACA years may have been incomplete. We were also limited to a single pre-ACA year. The sampling strategy of NEDS includes government, non-federal (public), private not-for-profit, and private investor hospitals but not federal hospitals such as Veteran’s Administration, Department of Defense, and Indian Health Service hospitals, which limits generalizability. The NEDS lacks data such as severity of mental illness and outpatient treatment history. While we were able to characterize changes in payer mix among ED patients with and without psychiatric disease, we lacked data on the prevalence and insurance status of patients who were not seen in the ED. Because of the logistical barriers involved in signing up for expanded access to Medicaid benefits, patients with serious mental illness may be less likely to benefit from ACA-related coverage
and are also more likely to require ED care. Furthermore, depending on the prevalence of psychiatric disease in the general population, an increasing number of ED visits could theoretically represent a relative decrease in ED utilization if the overall prevalence were increasing more rapidly
Future studies should re-evaluate the association between the ACA and psychiatric-related ED visits as more data becomes available and possibly use a national claims database with detailed information for the ED visits. Furthermore, because Medicaid expansion varies by state, future studies should also examine state-level variability in the association between the ACA and ED visits with psychiatric diagnosis.
CONCLUSION
We showed that with the Affordable Care Act, more people gained health insurance. However, we also showed that psychiatric-related visits to the ED increased both before and after the ACA. Even with health insurance, there are barriers to accessing outpatient mental healthcare, and even with outpatient treatment, some psychiatric emergencies are unavoidable. With the ACA, more people gained health insurance, yet ED visits for patients with primary psychiatric diagnosis continued to increase. These results suggest that increasing access to health insurance alone is not sufficient to reduce ED utilization for patients with a psychiatric disease.
Address for Correspondence: Afsaneh Asgharian, PhD, University of North Carolina at Charlotte, 201 University City Blvd., ADVANCE FADO, Colvard 3042, Wilmington, NC 28405. Email: afasgharian@gmail.com.
Conflicts of Interest: By the WestJEM article submission agreement, all authors are required to disclose all affiliations, funding sources and financial or management relationships that could be perceived as potential sources of bias. No author has professional or financial relationships with any companies that are relevant to this study. There are no conflicts of interest or sources of funding to declare.
Copyright: © 2023 Asgharian et al. This is an open access article distributed in accordance with the terms of the Creative Commons Attribution (CC BY 4.0) License. See: http://creativecommons.org/ licenses/by/4.0/
REFERENCES
1. Kessler RC, Berglund P, Demler O, et al. Lifetime prevalence and age-of-onset distributions of DSM-IV disorders in the National Comorbidity Survey Replication. Arch Gen Psychiatry. 2005;62(6):593-602.
2. Reeves WC, Strine TW, Pratt LA, et al. Mental illness surveillance among adults in the United States. MMWR Suppl. 2011;60(3):1-29.
3. National Institute of Mental Health. Mental Illness. 2019. Available at: https://www.nimh.nih.gov/health/statistics/mental-illness.shtml
Western Journal of Emergency Medicine 452 Volume 24, NO.3: May 2023
Asgharian et al.
Asgharian et al.
Accessed May 2020.
Association Between the ACA and ED Visits for Psychiatric Disease
4. Hazlett SB, McCarthy ML, Londner MS, et al. Epidemiology of adult psychiatric visits to US emergency departments. Acad Emerg Med. 2004;11(2):193-5.
5. Owens PL, Mutter R, Stocks C. (2010). Mental Health and Substance Abuse-Related Emergency Department Visits among Adults, 2007: Statistical Brief #92. In: Healthcare Cost and Utilization Project (HCUP) Statistical Briefs. Rockville (MD): Agency for Healthcare Research and Quality (US).
6. Capp R, Hardy R, Lindrooth R, et al. National trends in emergency department visits by adults with mental health disorders. J Emerg Med. 2016;51(2):131-5.e131.
7. Rui P, Kang K, Ashman J. National Hospital Ambulatory Medical Care Survey: 2016 emergency department summary tables. 2016. Available at: https://www.cdc.gov/nchs/data/nhamcs/web_ tables/2016_ed_web_tables.pdf Accessed May 2020.
8. Committee AEMP. Care of the psychiatric patient in the emergency department–a review of the literature. American College of Emergency Physicians. 2014. Available at: https://www.acep.org/ globalassets/uploads/uploaded-files/acep/clinical-and-practicemanagement/resources/mental-health-and-substance-abuse/ psychiatric-patient-care-in-the-ed-2014.pdf. Accessed May 2020.
9. Office of the Assistant Secretary for planning and Evaluation, Office of Health Policy. Essential Health Benefits: Individual Market Coverage. Department of Health and Human Services. 2011. Available at: Essential Health Benefits: Individual Market Coverage (hhs.gov). Access May 2020.
10. Chen W, Waters TM, Chang CF. Insurance impact on nonurgent and primary care-sensitive emergency department use. Am J Manag Care. 2015;21(3):210-7.
11. Allen MH, Carpenter D, Sheets JL, et al. What do consumers say they want and need during a psychiatric emergency? J Psychiatr Pract. 2003;9(1):39-58.
12. Nesper AC, Morris BA, Scher LM, et al. Effect of decreasing county mental health services on the emergency department. Ann Emerg Med. 2016;67(4):525-30.
13. Ward BW, Clarke TC, Nugent CN, Schiller JS. Early Release of Selected Estimates Based on Data From the 2015 National Health Interview Survey. National Center for Health Statistics. 2016. Available at: https://www.cdc.gov/nchs/data/nhis/earlyrelease/ earlyrelease201605.pdf . Accessed May 2020.
14. Terlizzi E, Cohen R. Health insurance coverage: early release of quarterly estimates from the National Health Interview Survey, January 2010–December 2018. 2019. Available at: https://www.cdc. gov/nchs/nhis/releases.htm. Accessed May 2020.
15. Theriault KM, Rosenheck RA, Rhee TG. Increasing emergency department visits for mental health conditions in the United States. J Clin Psychiatry. 2020;81(5):20m13241.
16. Healthcare Cost and Utilization Project (HCUP). Overview of the Nationwide Emergency Department Sample (NEDS). 2020. Available at: https://www.hcup-us.ahrq.gov/nedsoverview.jsp Accessed May 2020.
17. Agency for Healthcare Research and Quality. MapIT Mapping Tool. 2018. Available at: https://qualityindicators.ahrq.gov/resources/ toolkits. Accessed May 2020.
18. Cuschieri S. The STROBE guidelines. Saudi J Anaesth. 2019;13(Suppl 1):S31-4.
19. Obama B. United States health care reform: progress to date and next steps. JAMA. 2016;316(5):525-32.
20. Downey LVA, Zun LS, Burke T. Undiagnosed mental illness in the emergency department. J Emerg Med. 2012;43(5):876-82.
21. Bender D, Pande N, Ludwig M. A Literature Review: Psychiatric Boarding. Office of the Assistant Secretary for Planning and Evaluation, U.S. Department of Health and Human Services Report. 2008. Available at: https://aspe.hhs.gov/sites/default/files/private/ pdf/75751/PsyBdLR.pdf. Accessed May 2020.
Volume 24, NO.3: May 2023 453 Western Journal of Emergency Medicine
Agitation Management in
the Emergency Department with Physical Restraints: Where Do These Patients End Up?
Erin L. Simon, DO*
Courtney M. Smalley, MD†
McKinsey Muir, MHSA‡
Caroline Mangira Mangira, MPH*
Rylee Pence, MD*
Bhanu Wahi-Singh, MD*
Fernando Delgado, MSIE‡
Baruch S. Fertel, MD, MPA‡
Section Editor: Leslie Zun, MD
Cleveland Clinic Akron General, Department of Emergency Medicine, Akron, Ohio Cleveland Clinic Emergency Services Institute, Cleveland, Ohio Cleveland Clinic, Patient Quality and Safety, Cleveland, Ohio
Submission history: Submitted November 19, 2022; Revision received March 13, 2023; Accepted March 15, 2023
Electronically published May 5, 2023
Full text available through open access at http://escholarship.org/uc/uciem_westjem
DOI: 10.5811/westjem.59466
Introduction: Agitation is frequently encountered in the emergency department (ED) and can range from psychomotor restlessness to overt aggression and violent behavior. Among all ED patients, 2.6% present with agitation or become agitated during their ED visit. We aimed to determine ED disposition for patients requiring agitation management with physical restraints.
Methods: This was a retrospective cohort of all adult patients who presented to one of 19 EDs in a large integrated healthcare system and received agitation management with physical restraints between January 1, 2018–December 31, 2020. Categorical variables are presented as frequency and percentages, and continuous variables are presented as medians and interquartile range.
Results: There were 3,539 patients who had agitation management with physical restraints included in this study. In total 2,076 (58.8%) were admitted to the hospital (95% CI [confidence interval] 0.5720.605), and of those 81.4% were admitted to a primary medical floor and 18.6% were medically cleared and admitted to a psychiatric unit. Overall, 41.2% were able to be medically cleared and discharged from the ED. Mean age was 40.9 years, 2,140 were male (59.1%), 1,736 were White (50.3%), and 1,527 (43%) were Black. We found 26% had abnormal ethanol, (95% CI 0.245-0.274) and 54.6% had an abnormal toxicology screen (95% CI 0.529-0.562). A significant number were administered a benzodiazepine or antipsychotic in the ED (88.44%) (95% CI 0.874-0.895).
Conclusion: The majority of patients who had agitation management with physical restraints were admitted to the hospital; of those patients, 81.4% were admitted to a primary medical floor and 18.6% were admitted to a psychiatric unit. [West J Emerg Med. 2023;24(3)454–460.]
INTRODUCTION
Among all emergency department (ED) patients, 2.6% present with agitation or become agitated during their ED visit.1 Agitation describes a broad group of behaviors characterized by excessive motor or verbal activity manifesting as irritability, uncooperativeness, psychomotor
restlessness, aggression, and violent behavior.2,3 As behavioral complaints and agitation become increasingly common in the ED, emergency physicians are tasked with maintaining both the safety and care of the patient and the safety of the staff and healthcare team. It has been reported that up to 50% of healthcare workers have experienced violence in their
Western Journal of Emergency Medicine 454 Volume 24, NO.3: May 2023 * † ‡ Original Research
careers. A survey of emergency clinicians found that 78% had experienced violence in the workplace in the previous year.4-6
In the ED, the cause of agitation can be due to substance use disorder (SUD), psychiatric illness, or underlying medical illness. Therefore, early efforts in the ED should include identifying and treating reversible causes. However, in many cases of behavioral disturbance, intervention is indicated to reduce the risk of serious harm to patients and ED staff. Initial interventions to treat agitation may include noncoercive approaches such as verbal de-escalation;7,8 however, these techniques may be unsuccessful, and pharmacological sedation or restraint use may be necessary.
Despite the rate at which violence occurs in the ED, there is no standardized approach for managing agitation or objective measures for when agitation management with physical restraints is appropriate.9,10 Although the use of physical restraints has declined over the past several decades, they are still commonly used in the acute setting, with studies suggesting their use in over half of all acutely agitated patients.11-13 Non-medical physical restraints have been associated with significant morbidity and mortality with documented complications including restraint asphyxia, blunt trauma, catecholaminergic surge, and sudden death.14,15 Additionally, pharmacological management in an acutely agitated patient with comorbid medical conditions or SUD increases the risk of adverse respiratory events.16
Importance
Given the heightened regulatory scrutiny and potential adverse events, physical restraints should be approached carefully. Many studies have evaluated the use of physical restraints in specific populations and the risk factors leading to restraint use.17-19 Few studies have examined the disposition of agitated patients and whether those admitted went to a primary medical or psychiatric unit. For example, one prior study examined the use of restraints on elderly patients and found that all patients were admitted to the hospital.20 Another study evaluated the length of stay and disposition of restrained patients who received an ED psychiatric consultation and found that approximately 70% were admitted to the hospital or a psychiatric facility.21 To our knowledge, no study has evaluated the characteristics and disposition of agitated patients who require management with physical restraints in a large, integrated healthcare system.
Goals of the Investigation
We sought to determine patient disposition when the management of agitation with physical restraints is used in the ED.
METHODS Study Design and Setting
This was a retrospective cohort of all adult patients who required agitation management with physical restraints across
Population Health Research Capsule
What do we already know about this issue?
While use of physical restraints has declined, they are still used in the acute setting, with studies suggesting use in >50% of all acutely agitated patients.
What was the research question?
We sought to determine patient disposition when agitation is managed with physical restraints in the emergency department.
What was the major finding of the study?
We found that 58.8% of patients were admitted to the hospital (95% CI 0.572-0.605), with 81.4% of these admitted to a medical floor and 18.6% to psychiatry. Almost half (41.2%) were discharged from the ED after medical/psychiatric care.
How does this improve population health?
Consider a workup to assess for underlying medical conditions in patients requiring physical restraints and be cautious of anchoring on substance use as the cause of agitation.
19 EDs in a large, integrated healthcare system. All the EDs are located in northeast Ohio, except for one in southeast Florida, and include academic, community, freestanding, and critical access settings. Our study timeframe was January 1, 2018–December 31, 2020. The institutional review board approved this study.
Whenever there is an escalating, potentially violent patient or situation in our healthcare system, caregivers may activate a “code violet.” Our healthcare system defines a “code violet” as a “violent or combative patient.” Once a “code violet” is initiated, an overhead page is sent out via the hospital-wide intercom system. This assembles a team with a Non-Abusive Psychological and Physical Intervention-trained team leader. This key communicator, who is typically the patient’s nurse, a hospital security officer, or a hospital police officer, first attempts to verbally de-escalate the patient in which no physical touch is used. If de-escalation fails, using reasonable physical force to protect caregivers, patients, and visitors from injury may be used. Next, pharmacological management or management with physical restraints may be used if deemed necessary to protect the safety of caregivers, patients, or visitors.
Selection of Participants
Patients were included if they were ≥18 years of age and presented to one of 19 EDs within the healthcare system. In addition, to be included in the study participants must have had agitation management with physical restraints during their ED encounter.
Volume 24, NO.3: May 2023 455 Western Journal of Emergency Medicine Simon et al. Agitation Management in the Emergency Department with Physical Restraints
Data Collection
Study data were abstracted from the electronic health record (EHR) (Epic Systems Corporation, Verona, WI) via an automated query performed by one data analyst for the healthcare system. The data analyst was blinded to the study hypothesis. All patients who had management with physical restraints in the ED were required to have an order within the EHR. This was routinely audited by nursing and hospital quality leadership. We used Epic’s Clarity internal data warehouse to identify any ED encounters for which the “Restraint for Violent or Self-Destructive Behavior Management” order was applied. For all ED encounters with the “Violent Restraint” order, the original query was then expanded to collect additional data from the EHR. This included demographics, primary diagnosis of mental health condition, duration of restraint use, ED medications administered, ED lab toxicology screen results, ED medical clearance, ED disposition, and whether an ED psychiatric intake encounter occurred.
Outcomes
The primary outcome was ED disposition for patients requiring agitation management with physical restraints. Secondary outcomes included duration of physical restraint use, use of pharmacological management (antipsychotics or benzodiazepines) in the ED, primary diagnosis of behavioral
health disorder in the ED, history of dementia, abnormal ED ethanol results, abnormal ED toxicology results, ED length of stay (LOS), and whether an ED psychiatric intake encounter occurred. Behavioral health disorders were determined using the International Classification of Diseases, 10th Ed, codes from the “Meaningful Use” recommendation and are included in the appendix.
Statistical Analysis
Categorical variables are presented as frequency and percentages, and continuous variables are presented as medians and interquartile ranges (IQR).
RESULTS
There were 3,539 patients who had management with physical restraints during the study timeframe. Overall, the mean age was 40.9 years; 2,140 59.1% were male (59.1%), 1,736 (49.1%) were White, and 1,522 (43%) were Black. Overall, 22.2% had Medicare, 53.7% had Medicaid, 12.3% had private insurance, and 10.7% were self-pay (Table 1).
For our primary outcome, we found that 2,076 patients (58.7%) were admitted to the hospital (95% confidence interval [CI] 0.572-0.605). Of those patients, 1,172 (56.5%) were admitted to a primary medical unit, 518 (25.0%) were admitted to an intensive care unit, and 386 (18.6%) were medically cleared and admitted to a psychiatric unit. Three
Western Journal of Emergency Medicine 456 Volume 24, NO.3: May 2023
et al.
Agitation Management in the Emergency Department with Physical Restraints Simon
Demographics ED encounters Admitted Discharged Gender Male 2,093 (59.1%) 1,142 (32.3%) 951 (26.9%) Female 1,445 (40.8%) 948 (26.8%) 497 (14.0%) Unknown 1 1 (0%) 0 Total 3,539 2,091 (59.1%) 1,448 (40.9%) Insurance Medicaid HMO 1,901 (53.7%) 1,041(29.4%) 860 (24.3%) Medicare HMO 784 (22.2%) 597 (16.9%) 187 (5.3%) Self-pay 381 (10.8%) 154 (4.4%) 227 (6.4%) Private 437 (12.3%) 280 (7.9%) 157 (4.4%) Left blank 36 (1.0%) 19 (0.5%) 17 (0.5%) Total 3,539 2,091 (59.1%) 1,448 (40.9%) Race White 1,736 (49.1%) 1,130 (31.9%) 606 (17.1%) Black 1,522 (43.0%) 790 (22.3%) 732 (20.7%) Multiracial 93 (2.6%) 51 (1.4%) 42 (1.2%) Other 178 (5.0%) 112 (3.2%) 66 (1.9%) Asian 7 (0.2%) 5 (0.1%) 2 (0.1%) American Indian/Alaskan Native 3 (0.1%) 3 (0.1%) 0 Grand total 3,539 2,091 (59.1%) 1,448 (40.9%) ED, emergency department; HMO, health maintenance organization.
Table 1. Demographics of patients in study of use of physical restraints in the emergency department.
Simon et al.
Agitation Management in the Emergency Department with Physical Restraints
patients expired in the ED, two of them due to critical illness and unrelated to restraint use. One death was due to cardiac arrest of unclear etiology while in restraints. Overall, 41.2% were medically cleared and discharged from the ED. Table 2 shows characteristics of patients based on ED disposition (admitted vs discharged).
We also found that most patients had a primary mental health diagnosis (54.5%) in the ED, while only 7.9% had a prior history of dementia. We found that 29.6% had elevated ethanol levels (≥11 milligrams per deciliter), and 59.7% had an abnormal toxicology screen. A significant number were administered a benzodiazepine (80.2%) or antipsychotic (71.2%) while in the ED, and 42.2% had an evaluation by the ED psychiatric intake team (Table 2).
The overall median ED LOS was 495 minutes; ED LOS was 463 minutes for admitted patients and 526 minutes for discharged patients. Overall median minutes in restraints was 99 minutes: 98 minutes for admitted patients and 100 minutes for discharged patients (Table 3). We then tested the association of the characteristics from Table 3 in Table 4.
DISCUSSION
There is limited information characterizing agitated patients managed with physical restraints in the ED and their disposition. Agitation can be multifactorial, and its causes include underlying medical issues, SUD, psychotic episodes, and non-psychotic psychiatric illness. Understanding this
patient population allows for more informed use of restraints in the ED.17
When evaluating the primary outcome of our study, the ED disposition of patients managed with physical restraints varied. Only 18.6% of admitted patients were admitted to a psychiatric unit, showing that agitation is a multifactorial process and is often not solely psychiatric. Additionally, 41% of patients managed with physical restraints were successfully de-escalated, medically cleared, and discharged home after ED evaluation. This supports prior literature that management with physical restraints is often temporary, and many patients can be discharged from the ED.21
Patients who are agitated are often assumed to be under the influence of a behavior-modifying substance. This can lead clinicians to chemically sedate and physically restrain them for safety, allowing time for the behavior-modifying substance to wear off, with no additional workup being undertaken. We found that of patients admitted, 81.4% required admission to a primary medical unit for an underlying medical condition. Just under half of all patients evaluated did not have a primary mental health diagnosis in the ED. These numbers help illustrate that a substantial portion of agitated patients managed with physical restraints do not have a psychiatric etiology for their agitation, and a medical workup for other causes should be undertaken.
Our secondary outcomes help to define characteristics of agitated patients managed with physical restraints. Substance use was present in a substantial number of those restrained,
Volume 24, NO.3: May 2023 457 Western Journal of Emergency Medicine
Overall( N=3,539) Admitted (n=2,076) Discharged (n=1,452) Variable N (column %) 95% CI n (column %) 95% CI n (column %) 95% CI Primary diagnosis of behavioral health 1,928 (54) 53 - 56 847 (44.14) 39 -43 1,072 (74) 72 - 76 Dementia present in the problem list 278 (8) 7 - 9 248 (12) 11 -13 30 (2) 1 - 3 Psychiatry intake encounter 1,493 (42) 41 - 44 1,028 (50) 47 -52 455(31) 29 - 33 Antipsychotics administered in ED 2,521 (71) 70 -73 1,461(70) 68 -72 1,050 (72) 70 -75 Benzodiazepines administered in ED 2,838 (80) 79 - 82 1,687(81) 80 -83 1,141(79) 76 -81 Both benzodiazepines and antipsychotics administered in ED 2,230 (63) 61 - 65 1,306 (63) 61 - 65 915 (63) 61 - 66 Results positive for opioids 162 (5) 4 - 6 110 (5) 4 - 6 52 (4) 3 - 5 Results positive for benzodiazepines 268 (8) 7 - 9 192 (9) 8 - 10 76 (5) 4 - 6 Results positive for ethanol 1,046 (30) 28 - 31 368(18) 16 -19 676(47) 43 - 49 Positive toxicology screen 2,113 (60) 58 - 61 1,127 (54) 52 -56 982 (68) 65 -70 ED chief complaint of suicidal ideation or suicide attempt 370 (10) 9 -11 236 (11) 10 - 13 133 (9) 8 - 11 ED chief complaint of ethanol problem 378 (11) 10 - 12 103 (5) 4 - 6 275 (19) 17 -21 ED chief complaint of Intoxication 295 (8) 7 - 9 53 (3) 2 - 3 242 (16.67) 15 -19 Median (IQR) 95% CI Median (IQR) 95% CI Median (IQR) 95% CI ED LOS (min.) 495 (443) 478 - 509 463 (529) 441 - 478 526 (349) 511 – 539 Total minutes in restraints 99 (150) 94 - 105 98 (170) 90 - 105 100 (129) 91- 105 ED, emergency department; LOS, length of stay; CI, confidence interval; IQR, interquartile range.
Table 2. Characteristics of participants based on whether they were admitted or discharged, N=3,539.
Agitation Management in the Emergency Department with Physical Restraints
Results presented as median (IQR) or n (row %). IM, interval midpoint; RD, risk difference; CI, confidence interval; ED, emergency department; LOS, length of stay.
with many having either abnormal ethanol levels or an abnormal toxicology screen. The ED often manages and observes patients whose agitation is thought to be primarily due to an underlying SUD. Emergency clinicians typically
wait until the substance has cleared from a patient’s system and the patient has the capacity to make decisions, which may explain why patients discharged had a longer ED LOS. We found that time in restraints was similar whether patients were
Western Journal of Emergency Medicine 458 Volume 24, NO.3: May 2023
Simon et al.
Overall Admitted Discharged Variable N (%) or Median (IQR) 95% CI N (%) or Median (IQR) 95% CI N (%) or Median (IQR) 95% CI ED LOS (min.) 495 (443) 478 - 509 463 (529) 441 - 478 526 (349) 511 - 539 Total minutes in restraints 99 (150) 94 - 105 98 (170) 90 - 105 100 (129) 91- 105 Psychiatry consults 1,493 (42%) 41 - 44 1,028 (50%) 47 -52 455 (31%) 29 - 33 Results (+) for opioids 162 (5%) 4 - 6 110 (5%) 4 - 6 52 (4%) 3 - 5 Results (+) for benzodiazepines 268 (8%) 7 - 9 192 (9%) 8 - 10 76 (5%) 4 - 6 Results (+) for ethanol 1,046 (30%) 28 - 31 368(18%) 16 -19 676 (47%) 43 - 49 Medicated with benzodiazepines 2,838 (80%) 79 - 82 1,687 (81%) 80 -83 1,141 (79%) 76 -81 Medicated with antipsychotics 2521 (71%) 70 -73 1,461 (70%) 68 -72 1,050 (72%) 70 -75 ED,
Table 3. Characteristics of participants based on disposition [for results (+) benzodiazepines, unable to determine whether taken prior to emergency department (ED) visit or given in the ED].
emergency department; IQR, interquartile range; CI, confidence interval; LOS, length of stay.
Variable Admitted Discharged IM or RD (95% CI) P-value ED LOS (minutes) 463 (529) 526 (349) -19.00 (-39.00, 2.00) 0.081 Total minutes with restraints 98 (170) 100 (129) 1.00 (-5.00, 6.00) 0.860 Psychiatry consults Yes 1,028 (69.32) 455 (30.68) 18.07 (14.88, 21.27) <0.0001 No 1,048( 51.25) 997 (48.75) Results positive for opioids Yes 110 (67.90) 52 (32.10) 7.91 (0.49, 15.32) 0.045 No 1,669 (59.99) 1,113 (40.01) Results positive for benzodiazepines Yes 192 (71.64) 76 (28.36) 12.34 (6.63, 18.05) <0.0001 No 1,587 (59.30) 1,089 (40.70) Results positive for ethanol Yes 368 (35.25) 676 (64.75) -39.01 (-42.52, -35.51) <0.0001 No 1,411 (74.26) 489 (25.74) Positive toxicology screen Yes 1,127 (53.44) 982 (46.56) -13.44(-16.69, -10.20) <0.0001 No 949 (66.88) 470 (33.12) Used benzodiazepines Yes 1,687 (59.65) 1,141 (40.35) 4.08 (-0.02, 8.18) 0.054 No 389(55.57) 311 (44.43) Used antipsychotics Yes 1,461 (58.18) 1,050 (41.82) -2.29 (-5.86, 1.28) 0.211 No 615 (60.47) 402 (39.53)
Table 4. Associations of different characteristics by admission status (admitted vs discharged).
Simon et al.
Agitation Management in the Emergency Department with Physical Restraints
admitted or discharged regardless of the underlying cause. This may be due to an overall goal of our healthcare system to minimize the time agitated patients are managed with physical restraints. Despite pharmacological management for agitation being used in most cases, we found physical restraints were additionally needed to maintain safety in the ED setting. We found that the frequency with which pharmacological management occurred was similar for admitted or discharged patients. Pharmacological management of agitation is done with the goal to help to calm the patient. It can be a valuable adjunct to management with physical restraints in maintaining safety while determining how to evaluate best and manage the underlying cause.18
LIMITATIONS
This study has several limitations. First, this was a retrospective study based on EHR data; therefore, it depends on proper documentation for the data points assessed. It is unlikely that restraint use was not documented, or that patients were missed in our cohort. A physical restraint order is required for restraints to be placed on all violent or agitated patients throughout the healthcare system. Also, our population represents data from a single, large, integrated healthcare system. Since the healthcare system is primarily located in one region of the United States, our results may not be generalizable to other regions. Finally, we could not differentiate whether a patient who was positive on the toxicology screen for benzodiazepines had taken them prior to arrival or whether they were administered in the ED for agitation.
CONCLUSION
Most patients with agitation management with physical restraints were admitted to the hospital to a primary medical floor due to an underlying medical condition. This emphasizes the importance of a thorough workup to assess for underlying medical conditions and to be cautious of anchoring on substance use disorder as the cause of their agitation.
REFERENCES
1. Miner JR, Klein LR, Cole JB, et al. The characteristics and prevalence of agitation in an urban county emergency department. Ann Emerg Med. 2018;72(4):361-70.
2. Siddiqui W, Gupta V, Huecker MR. Agitation. 2020. Available at: http://www.ncbi.nlm.nih.gov/books/NBK493153/. Accessed January 13, 2021.
3. Lindenmayer JP. The pathophysiology of agitation. J Clin Psychiatry 2000;61 Suppl 14:5-10.
4. Schulte JM, Nolt BJ, Williams RL, et al. Violence and threats of violence experienced by public health field-workers. JAMA 1998;280(5):439-42.
5. Al-Sahlawi KS, Zahid MA, Shahid AA, et al. Violence against doctors: 1. A study of violence against doctors in accident and emergency departments. Eur J Emerg Med. 1999;6(4):301-4.
6. Behnam M, Tillotson RD, Davis SM, et al. Violence in the emergency department: a national survey of emergency medicine residents and attending physicians. J Emerg Med. 2011;40(5):565-79.
7. Richmond JS, Berlin JS, Fishkind AB, et al. Verbal de-escalation of the agitated patient: consensus statement of the American Association for Emergency Psychiatry Project Beta De-Escalation Workgroup. West J Emerg Med. 2012;13(1):17-25.
8. Allen MH, Carpenter D, Sheets JL, et al. What do consumers say they want and need during a psychiatric emergency? J Psychiatr Pract. 2003;9(1):39-58.
9. de Vries OJ, Ligthart GJ, Nikolaus T, [On behalf of the participants of the European Academy of Medicine of Ageing-Course III]. Differences in period prevalence of the use of physical restraints in elderly inpatients of European hospitals and nursing homes. J Gerontol A Biol Sci Med Sci. 2004;59(9):M922-3.
10. Chiba Y, Yamamoto-Mitani N, Kawasaki M. A national survey of the use of physical restraint in long-term care hospitals in Japan. J Clin Nurs. 2012;21(9-10):1314-26.
11. Cleary KK, Prescott K. The use of physical restraints in acute and long-term care: an updated review of the evidence, regulations, ethics, and legality. J Acute Care Phys Ther. 2015;6(1):8-15.
12. Zun LS, Downey L. The use of seclusion in emergency medicine. Gen Hosp Psychiatry. 2005;27(5):365-71.
Address for Correspondence: Erin Simon, DO, Cleveland Clinic Akron General, Department of Emergency Medicine Research, 1 Akron General Ave, Akron, OH 44307. Email: simone@ccf.org.
Conflicts of Interest: By the WestJEM article submission agreement, all authors are required to disclose all affiliations, funding sources and financial or management relationships that could be perceived as potential sources of bias. No author has professional or financial relationships with any companies that are relevant to this study. There are no conflicts of interest or sources of funding to declare.
Copyright: © 2023 Simon et al. This is an open access article distributed in accordance with the terms of the Creative Commons Attribution (CC BY 4.0) License. See: http://creativecommons.org/ licenses/by/4.0/
13. Downey LVA, Zun LS, Gonzales SJ. Frequency of alternative to restraints and seclusion and uses of agitation reduction techniques in the emergency department. Gen Hosp Psychiatry. 2007;29(6):470-4.
14. Rakhmatullina M, Taub A, Jacob T. Morbidity and mortality associated with the utilization of restraints : a review of literature. Psychiatr Q 2013;84(4):499-512.
15. Mohr WK, Petti TA, Mohr BD. Adverse effects associated with physical restraint. Can J Psychiatry. 2003;48(5):330-7.
16. Yap CYL, Taylor DM, Kong DCM, et al. Sedation for acute agitation in emergency department patients: Targeting Adverse Events (SIESTA) Collaborative Study Group. Risk factors for sedation-related events during acute agitation management in the emergency department. Acad Emerg Med. 2019;26(10):1135-43.
Volume 24, NO.3: May 2023 459 Western Journal of Emergency Medicine
Agitation Management in the Emergency Department with Physical Restraints
17. Wong AH, Crispino L, Parker JB, et al. Characteristics and severity of agitation associated with use of sedatives and restraints in the emergency department. J Emerg Med. 2019;57(5):611-9.
18. Khalid Z, Fana M, Payea R, et al. Disparities and variables associated with physical restraint for acute agitation in a nonpsychiatric emergency department. Prim Care Companion CNS Disord. 2019;21(6).
19. Wong AH, Crispino L, Parker J, et al. Use of sedatives and restraints
for treatment of agitation in the emergency department. Am J Emerg Med. 2019;37(7):1376-9.
20. Swickhamer C, Colvig C, Chan SB. Restraint use in the elderly emergency department patient. J Emerg Med. 2013;44(4):869-74.
21. Chang G, Weiss AP, Orav EJ, et al. Hospital variability in emergency department length of stay for adult patients receiving psychiatric consultation: a prospective study. Ann Emerg Med 2011;58(2):127-36.e1.
Western Journal of Emergency Medicine 460 Volume 24, NO.3: May 2023
Simon et al.
Corey S. Hazekamp, MD, MS* Ryan N. Barnicle, MD, MSEd†
Section Editor: Rama Salhi, MD
Winter Walk
NYC H+H/Lincoln, Department of Emergency Medicine, Bronx, New York
The Warren Alpert Medical School of Brown University, Department of Emergency Critical Care, Providence, Rhode Island
Submission history: Submitted August 12, 2022; Revision received August 12, 2022; Accepted January 13, 2023
Electronically published March 22, 2023
Full text available through open access at http://escholarship.org/uc/uciem_westjem
DOI: 10.5811/westjem.58365
Winter Walk is a photo essay meant to be an inspirational commentary on emergency medicine’s role in meeting the needs of our most vulnerable patients. Oftentimes, the social determinants of health, now well reviewed in the modern medical school curriculum, become intangible concepts that get lost amongst the busy environment of the emergency department. The photos within this commentary are striking and will move readers in various ways. The authors hope that these powerful images generate a mix of emotion that ultimately motivates emergency physicians to embrace the emerging role in addressing the social needs of our patients both inside and outside the emergency department. [West J Emerg Med. 2023;24(3)461–462.]
We are emergency physicians. We resuscitate the dead and dying, and then we keep them alive. We work up, clear, and discharge patients. We tidy up the board, sign out, and then go home. Right?
Historically, our scope of practice has been confined to the hustle and bustle of the emergency department (ED), and the appeal for many is the ability to walk away at the end of the shift. Things have changed though, and our specialty is evolving. The pandemic has codified our place on the frontline of population health. For many individual patients, as well as the greater public good, the ED is all that stands against the growing number of societal harms. This obligation does not end with infectious diseases but encompasses all the worsening public health crises: firearm deaths; homelessness; unmanaged mental health; and more. Embracing our role in addressing the needs of our local communities, such as the worsening opioid use disorder crisis, is now an essential part of our job. This truth may be no more evident than during a walk right outside the ED’s front door. As the saying goes, a picture speaks a thousand words…
On a frigid winter day with just a few minutes to spare, the opportunity to step outside during a busy shift presented itself. After turning the corner onto a familiar street, the sidewalk was found to be obstructed by piles of used syringes. There were unfolded cardboard boxes, empty food containers, and dirty clothes spilled across the sidewalk among the syringes. Community members, excluded from the photo, were actively using intravenous (IV) drugs as they huddled in

a doorway within the brick wall of the hospital as visible to the public as the sun’s light.
These photos were taken in a neighborhood within the poorest congressional district of the United States. On one side of the street was a school, and on the other, the hospital. Here was a nearly impassable mess of used syringes and the remnants of a frozen winter campsite, juxtaposed between the two pillars of society meant to empower individuals to lead fuller lives. The painful irony
Volume 24, NO.3: May 2023 461 Western Journal of Emergency Medicine * † Perspectives
Medicine
Health
in Emergency
and Population
Figure 1. A photograph of a sidewalk just around the corner from an emergency department, strewn with empty boxes and used syringes.
of these images is demoralizing. There were emergency physicians working tirelessly to save the lives of patients inside, while just on the other side of the wall other patients were struggling to get by.
Truthfully, most of us have probably never used IV drugs or even seen someone actively using them. We will probably never truly understand what life is like for our patients between injections. But we have all written “IVDU” (intravenous drug use) in a chart or formed a differential diagnosis after considering a patient’s drug use history. Then, we drain the soft tissue abscesses and schedule wound checks. We treat endocarditis with broad-spectrum antibiotics and admit for sepsis. We revive victims of accidental overdoses from a drug supply tainted with fentanyl, and we monitor for clinical sobriety. We know these complications well, but it is hard to gain true insight into the day-to-day lives of some of our most vulnerable patients. Perhaps these photos may represent a glimpse into these hardships.
After it is safe for a patient to leave the hospital, what are we doing next for them? What is the environment we are sending them to live in? Here, while visualizing what life looks like for some of our most vulnerable patients, ask yourself how these photos make you feel as a physician. Understandably, some will feel the despair of defeat as if the care we provide matters little if this is the inevitable result just outside our doors. Others will feel invigorated to redouble their efforts to ensure adequate follow-up for the patients they induce on buprenorphine during an upcoming shift.
Pause. Take a moment and look closely. The details matter.
These needles are discarded after a clean single use, the empty boxes left behind as proof. There are filters and sterile saline. They have come from a local harm reduction program meant to mitigate the infectious mortality and morbidity associated with opioid use disorder. There are discarded fentanyl test strips and empty naloxone atomizers among the debris, too, likely given just on the other side of those brick walls meant to prevent the next lethal overdose. These are hopeful details, partially hidden within the instilling dread of this social blight but keenly evident to an observant eye.


This is not a battle lost, but a fight that has just begun. Physicians in all specialties are feeling the burden of new social imperatives, and the field of medicine as a whole is on its own so-called winter walk right now. Despite the current biting cold of a dysfunctional healthcare system, the embers of hope must be kindled. As emergency medicine evolves, it must continue to embrace the imperative needs of the most vulnerable. Our patients need us inside and outside the ED, and our specialty continues to rise to the occasion.
Address for Correspondence: Corey S. Hazekamp, MD, MS, NYC H+H/Lincoln, Department of Emergency Medicine, 234 E. 149th St., Bronx, NY 10451. Email: corey.hazekamp@gmail.com.
Conflicts of Interest: By the WestJEM article submission agreement, all authors are required to disclose all affiliations, funding sources and financial or management relationships that could be perceived as potential sources of bias. No author has professional or financial relationships with any companies that are relevant to this study. There are no conflicts of interest or sources of funding to declare.
Copyright: © 2023 Hazekamp et al. This is an open access article distributed in accordance with the terms of the Creative Commons Attribution (CC BY 4.0) License. See: http://creativecommons.org/ licenses/by/4.0/
Western Journal of Emergency Medicine 462 Volume 24, NO.3: May 2023 Winter Walk Hazekamp et al.
Figure 2. This seeming image of despair in fact reveals a roadmap toward hope, evidenced in needles discarded after a clean single use, used fentanyl test strips, and empty naloxone atomizers meant to prevent the next lethal overdose.
Figure 3. A snapshot of the hardships that some our most vulnerable patients face after discharge from the emergency department.
A Case of Human Trafficking in Appalachia and What Emergency Physicians Can Learn from It
Kelli L. Jarrell, MD, MPH*
Christa Pulvino, MD,
Alexis Kimmel, MD*
Bailee Stark, MD*
MPH*
Harmanjit Khokhar, DO†
Laura Janneck, MD, MPH‡
Sally A. Santen, MD, PhD*
Section Editor: Mark Faul, MD
University of Cincinnati, Department of Emergency Medicine, Cincinnati, Ohio HCA St. Lucie Medical Center, Department of Emergency Medicine, Port St. Lucie, Florida
University of Oklahoma School of Community Medicine, Department of Emergency Medicine, Tulsa, Oklahoma
Submission history: Submitted August 15, 2022; Revision received March 14, 2023; Accepted February 24, 2023
Electronically published May 5, 2023
Full text available through open access at http://escholarship.org/uc/uciem_westjem
DOI: 10.5811/westjem.58400
Human trafficking is an ongoing, global human rights crisis and one of the largest illicit industries worldwide. Although there are thousands of victims identified each year within the United States, the true extent of this problem remains unknown due to the paucity of data. Many victims seek care in the emergency department (ED) while being trafficked but are often not identified by clinicians due to lack of knowledge or misconceptions about trafficking. We present a case of an ED patient being trafficked in Appalachia as an educational stimulus and discuss several unique aspects of trafficking in rural communities, including lack of awareness, prevalence of familial trafficking, high rates of poverty and substance use, cultural differences, and a complex highway network system. The lack of data, appropriate resources, and training for healthcare professionals also poses distinct issues. We propose an approach to identify and treat victims of human trafficking in the ED, with a focus on rural EDs. This approach includes improving data collection and availability on local patterns of trafficking, improving clinician training in identification, and care of victims using trauma-informed techniques. While this case illustrates unique features of human trafficking in the Appalachian region, many of these themes are common to rural areas across the US. Our recommendations emphasize strategies to adapt evidencebased protocols, largely designed in and for urban EDs, to rural settings where clinicians may be less familiar with human trafficking. [West J Emerg Med. 2023;24(3)463–468.]
INTRODUCTION
Victims of human trafficking are likely to interact with the healthcare system at some point while they are being trafficked, particularly in the emergency department (ED). One study noted that up to 60-88% of trafficked persons surveyed had visited an ED while actively being trafficked.1,2 The frequency of ED visits by victims places emergency physicians in a unique position to intervene. Unfortunately, many clinicians lack familiarity and confidence with identifying and caring for victims of trafficking.3 In fact, one study showed that less than 5% of emergency physicians felt confident identifying trafficked persons who present to the ED.4
This uncertainty may be especially prevalent in rural areas where clinicians perceive trafficking as an urban problem and may lack dedicated training in screening and emergency care of victims of human trafficking. In this article we sought to examine human trafficking in Appalachia to highlight common themes in the emergency care of victims of trafficking, spotlight important issues in rural trafficking including familial trafficking, and explore the vulnerability of the region and marginalized groups living in Appalachia, a region made up of 423 counties across 13 states that spans 205,000 square miles from southern New York to northern Mississippi (Figure). We begin by presenting a real ED case as a stimulus for learning about human trafficking. Then we present realities
Volume 24, NO.3: May 2023 463 Western Journal of Emergency Medicine * † ‡ Social Emergency Medicine
Figure. “Appalachia” most commonly refers to the 423-county region designated by the Appalachian Regional Commission (ARC) in 1965, which is divided into 5 subregions. It is important to note that the counties designated by the ARC were included for a variety of reasons, some geographic, some economic, and some political. However, given that lines were not drawn by social ethnographers, there may be persons in areas near the region who identify as Appalachian and whose lived experiences mirror those within the region.14,21 Map produced by the Appalachian Regional Commission. Used with permission from the ARC.
of Appalachian human trafficking as opposed to common misperceptions. Finally, we conclude with an approach to identifying and treating victims of human trafficking in the ED.
Case:
A 30-year-old female presented to the ED accompanied by police for altered mental status. Per police report, the patient was running in the woods. Her behavior was erratic, and she was unable to provide a succinct history. She endorsed visual hallucinations and lacked focus during the interview. Her vital signs were within normal limits. She appeared anxious but did not have any focal physical exam abnormalities. The patient revealed that she was forced to perform commercial sex acts by her dealer after a recent relapse, had been forced to take illicit drugs, and alluded to physical and sexual assault.
“You’ll meet somebody who will act like some kind of Prince Charming, and they wind up selling you.”
― “Marie,” former sex worker, Charleston, WV.5
Human trafficking is defined as the “the act of compelling or coercing a person’s labor, services, or commercial sex acts.”6 There are more victims today than at any other time in history, with an estimated 40.3 million victims of human trafficking globally and 24.9 million people trapped in forced labor.2 While 16,658 victims were identified in the United States in 2020, it is estimated that 199,000 incidents of trafficking occur in the US every year.7,8 The US Department of Justice (DOJ) estimates that trafficking generates nearly $150 billion in profits annually.9 It is the second largest and fastest growing organized crime trade in the world, recently surpassing the illegal arms trade, and is anticipated to surpass the illegal sale of drugs in the next few years.10 Human trafficking occurs in all 50 states and the District of Columbia. There is no typical victim, although marginalized individuals such as homeless youth and those in extreme poverty are at especially high risk.11,12 Traffickers exploit vulnerabilities such as poverty, addiction, or lack of agency to compel victims into forced labor, commercial sex work, or other activities against their will.13,14
Appalachia is home to over 26 million residents.15 Appalachia’s history is characterized by economic depression, generational poverty, geographic isolation and, more recently, by the devastating impact of the opioid epidemic, all of which are risk factors for human trafficking5,16 (Table 1). Contrary

Lack of awareness among the community
Lack of training among healthcare and law enforcement personnel
Lack of resources, including lack of transportation and inadequate funding
Familial trafficking
Poverty
Substance abuse and the opioid epidemic
Cultural differences including traditional gender roles
Truck stop proximity and large network of highways
to common perception among Appalachian residents, human trafficking is not only an urban issue.16,17 Appalachian states comprise three of the top 10 states for human trafficking with Mississippi, Georgia, and Ohio ranking second, fourth, and fifth, respectively.8 Since Appalachia became a battleground for the “war on poverty” in 1965, the region has seen economic gains, although it still lags behind other areas of the country. Between 2015–2019, the median income in Appalachia was 85% the national median. In the same period, the overall poverty rate in Appalachia was 15.2% compared to 13.4% for the US overall; however, the poverty rate in the central subregion was 23.5%.16,18 Amidst the opioid crisis, which has been responsible for the greatest loss of life of any
Western Journal of Emergency Medicine 464 Volume 24, NO.3: May 2023 Human Trafficking in Appalachia and What EPs Can Learn from It Jarrell et al.
Table 1. Intersectional challenges in Appalachia.
overdose epidemic, the Appalachian region stands above all others. In this highly rural 13-state region, overdose deaths among those aged 25-44 are over 70% higher than the rest of the US.19,20
Trafficking in Appalachia
A common misperception in the region is that human trafficking occurs only in urban areas and is perpetuated by strangers. In contrast, much of the trafficking in Appalachia is familial, meaning that victims are trafficked by family members, often in exchange for drugs or money.22,23 In 2013, a survey was conducted to assess professionals who work with minors who were victims of sex trafficking in Kentucky. Most professionals surveyed found that at least one of the victims they had worked with were recruited or lived in Kentucky while being trafficked.21 Furthermore, victims who are recruited in Appalachian states may be transported and trafficked in larger, urban areas outside the region. In the same study, two in five professionals stated that at least one of the victims with whom they had worked had been trafficked in states other than Kentucky.24 In the case presented above, the victim was both recruited and trafficked within Appalachia prior to her ED presentation.
Based on these studies, it is important for emergency clinicians to stay vigilant and maintain a high suspicion for human trafficking regardless of the patient’s place of origin or current location. Law enforcement personnel in Appalachia note that much of the trafficking is familial and that the practice is very likely severely under-reported.24 In one study, up to 44% of data samples included survivors who had been sex trafficked by family members, mainly parents, and most often mothers. Younger girls in rural areas are more likely to be sex trafficked by their parents than those in urban areas, and at younger ages.25 From the limited existing data, familial trafficking is more common in rural areas. In a study of 40 adjudicated juvenile females in a southern, rural state, of those trafficked all the rural victims were trafficked by family members; in urban areas, none were trafficked by family members.25 In the study from Kentucky, the most mentioned trafficker-victim relationship was family (61.9%).24 [It is unknown whether the victim in this case was ever trafficked by family members.] Therefore, a patient who presents with their family should not be assumed to be safe from trafficking and should be screened privately and offered intervention if there is concern for trafficking.26
The geography of Appalachia makes it particularly vulnerable to trafficking as well as movement of victims across long distances in a short time. In addition to its rurality, major interstate highways connecting large cities crisscross the region. These highways, thoroughfares of cross-national shipping, bring drugs and buyers into the region and ship men and women out into the commercial sex and labor market. Victims are trafficked along the nation’s highways at truck stops, gas stations, and rest areas.27,28 In the case we discuss,
the victim presented to an ED over 90 miles from her most recent known address within days of being trafficked. Marginalization and discrimination compound existing vulnerabilities, and those who identify with multiple vulnerable groups are subject to higher risk. Sexual and gender minorities are especially vulnerable in Appalachia where there is an overall lack of LGBTQIA+ specific resources. This is especially true for transgender individuals who are particularly vulnerable to exploitation.29 Persons from these groups often struggle to maintain stable employment due to discrimination in the workplace and rely almost exclusively on family and community networks for support.30 Unfortunately, as noted above, familial trafficking may compound this exploitation risk. Housing insecurity is also often exploited by traffickers, making homeless persons even more vulnerable. Transgender individuals are more likely to be homeless than their cisgender counterparts. Transgender individuals in the commercial sex industry also face higher rates of violence, with trans women of color facing the highest rates of any group.29,30 Children who have experienced trauma are also more likely to be trafficked, making those in the foster care system particularly vulnerable. Furthermore, children in foster care may have unmet basic needs.31 The opioid epidemic has increased the number of children in foster care nationwide and especially in Appalachia, a problem further exacerbated by the COVID-19 pandemic.32,33
The overall paucity of data is one of the primary challenges in combating human trafficking worldwide. The data from Appalachia is even less robust than from other areas of the country. In Appalachia, the lack of data means that perhaps even fewer victims than is typical are being identified.14 Overall, the DOJ reports that fewer than 1% of victims of human trafficking are identified because of the frequent movement of victims, victims’ inability to escape, and knowledge deficit among healthcare professionals related to the red flags of trafficking.6 Up to 88% of victims report accessing healthcare at some point during their trafficking situation, with many presenting to the ED.2 Given this, emergency physicians should be extensively trained in identification and intervention for victims of human trafficking (Table 2). Below, we propose recommendations on these practices with particular emphasis on rural settings where clinicians may be less familiar with human trafficking.
Case (continued):
In our case, the clinicians were familiar with the signs and symptoms of human trafficking and recognized how these played a significant role in our patient’s clinical presentation. They were able to gain the patient’s trust and reconnect her with resources and a safe house. Unfortunately, despite all efforts from healthcare professionals and ancillary staff, our patient still did not get fully connected to the resources she needed. On chart review, it appears that she presented to another local hospital three days after discharge for medical clearance for jail
Volume 24, NO.3: May 2023 465 Western Journal of Emergency Medicine Jarrell et al.
in
and What EPs Can Learn from It
Human Trafficking
Appalachia
Table 2. Recommendations for emergency clinicians.
1. Emergency physicians should become familiar with patterns of human trafficking in their area.34
2. Clinicians should recognize that victims may present after being trafficked from a different geographical area and may face unique challenges related to the area from which they were trafficked.
3. Healthcare professionals should advocate for the collection of quantitative data on human trafficking to advance research efforts. This may include multidisciplinary approaches with involvement of health departments, law enforcement, government officials, and other community advocates to add to the fund of available knowledge.
4. Despite the paucity of available data, emergency physicians should strive to create standardized protocols to identify and treat victims of human trafficking in the emergency department. These protocols should be tailored to account for regional differences in trafficking patterns.
5. Clinicians should employ the principles of trauma-informed care when caring for victims of trafficking.37 Considerations for care include 1) not having the victim repeat the story so many times; 2) establishing a code word if they feel uncomfortable and want to stop at any point of the exam; and 3) not undressing the patient unless absolutely necessary.37 See NHATTC website for further recommendations and suggestions.39
6. Special considerations for rural emergency clinicians are to become familiar with mandatory reporting laws in their area40 and consider transfer if a safe discharge plan cannot be established (i.e., resources unavailable).
NHATTC, National Human Trafficking and Technical Assistance Center.
for methamphetamine use and “engaging in prostitution.” The patient was seen again one month later for medical clearance for a human trafficking program; however, it does not appear that she was directly reconnected with the program and was ultimately discharged and told to follow up as an outpatient. This was her last known encounter with the healthcare system to date.
RECOMMENDATIONS
A recently published article aptly noted that emergency physicians must educate themselves on the unique aspects of human trafficking in their local area and the resources available to victims.34 This is especially pertinent in the Appalachian region given the prevalence of familial trafficking, which is more common than in other regions of the US. Tools such as the HEAL Trafficking Toolkit and Rapid Appraisal for Trafficking (RAFT) screening tool are excellent starting points for developing an ED screening and response protocol; however, protocols must be adjusted to accommodate regional differences35,26 (Table 3). Ideally, protocols would be evidence-based, but as we have seen with the COVID-19 pandemic, it is not always possible to wait to develop a response until more information becomes available, especially given the overall dearth of data in Appalachia. Furthermore, much of the existing evidence and
National Human Trafficking Hotline Awareness materials
HEAL: Legal requirements for reporting40
RAFT screening tool26
38
National Human Trafficking Resource Center: Framework for a human trafficking protocol in healthcare settings36
recommendations come from large urban EDs and are not tailored for rural emergency clinicians. Therefore, improving national and regional data collection on human trafficking must occur in tandem with developing locally tailored systems and protocols for screening and response.
Clinicians looking to create a screening and response protocol in their ED would benefit from collaboration with social work to identify community partners working to combat human trafficking. These partners can help to build a local database of relevant resources for patient referrals and linkage to care. Use of the National Human Trafficking Hotline’s “Framework for a Human Trafficking Protocol in Healthcare Settings” is a useful resource when creating a protocol.36 Their website can also be a helpful resource in identifying relevant federal and local laws, as well as potential community partners. Additionally, their website provides educational materials regarding recognition of human trafficking, which can be used for clinician training. While the toolkits mentioned above provide evidence-based screening questions, clinicians implementing these toolkits will still want to ensure that their colleagues have been provided with the education to recognize common signs of human trafficking, such as patients being accompanied by someone who does not let them speak for themselves, patients not being in control of their own legal and financial documents, or tattoos that the patient does not wish to discuss, among others.
Rural clinicians may encounter pediatric and adult victims of human trafficking but have fewer resources to support care of these patients. Mandatory reporting laws for human trafficking vary by state; therefore, clinicians should familiarize themselves with their local policy.37 Social workers can assist in providing appropriate care and resources to these patients. In rural areas where resources, including social work, may not be available, clinicians should have a low threshold to discuss with and potentially transfer patients to the nearest referral center where forensic nursing and/ or social work support are available. This is especially true for pediatric patients, as dedicated pediatric hospitals may offer significantly more resources for follow-up and ongoing support than rural or critical access hospitals.
Healthcare professionals should be educated on traumainformed care, as well as on trafficking patterns in their region.38 While training ideally begins in undergraduate medical education, it is important that it be consistently accessible to clinicians in
Western Journal of Emergency Medicine 466 Volume 24, NO.3: May 2023 Human Trafficking in Appalachia and What EPs Can Learn from It Jarrell et al.
Table 3. Resources for clinicians in the emergency department. HEAL protocol toolkit35
various practice environments and throughout the spectrum of practice. The National Human Trafficking Training and Technical Assistance Center (NHTTAC) offers resources for continuing education in trauma-informed care for healthcare professionals.39 Furthermore, there is significant variability in the background and training among clinicians, particularly among those working in rural EDs, and those who trained in the era before human trafficking was regularly incorporated in medical education curricula. Therefore, there are likely differences in the degree of formal training regarding identification and care of victims of human trafficking. Additionally, clinicians should have an awareness that due to the fluid nature of human trafficking, they may encounter a patient who does not fit the typical or expected pattern of trafficking within their local community. All clinicians should be educated on resources that are available at their facilities and in their communities, as well as how to connect patients to these services.
CONCLUSION
Human trafficking victims in Appalachia remain a particularly vulnerable population for which there is little accurate data. Educational strategies can dispel myths and help accurately identify victims. Leveraging and strengthening networks of existing community resources is paramount to combating human trafficking. Finally, improving the availability of data about trafficking from the Appalachian region is crucial to understanding the extent of the problem. Understanding is the first step to identifying, supporting, and protecting the victims and potential victims of trafficking in the Appalachian region.
Address for Correspondence: Kelli Jarrell, MD, MPH, University of Cincinnati, Department of Emergency Medicine, 231 Albert Sabin Way, Suite 1654 | PO Box 670768, Cincinnati, OH, 45267-0769. Email: jarrelki@ucmail.uc.edu.
Conflicts of Interest: By the WestJEM article submission agreement, all authors are required to disclose all affiliations, funding sources and financial or management relationships that could be perceived as potential sources of bias. No author has professional or financial relationships with any companies that are relevant to this study. There are no conflicts of interest or sources of funding to declare.
Copyright: © 2023 Jarrell et al. This is an open access article distributed in accordance with the terms of the Creative Commons Attribution (CC BY 4.0) License. See: http://creativecommons.org/ licenses/by/4.0/
Human Trafficking in Appalachia and What EPs Can Learn from
2. International Labour Organization. Global Estimates of Modern Slavery: Forced Labour and Forced Marriage (Report). International Labor Organization; 2017. Available at: http://www.ilo.org/global/ publications/books/WCMS_575479/lang--en/index.htm. Accessed February, 16, 2023.
3. Viergever RF, West H, Borland R, et al. Health care providers and human trafficking: What do they know, what do they need to know? Findings from the Middle East, the Caribbean, and Central America. Front Pubic Health. 2015;3:6.
4. Chisolm-Straker M, Richardson LD, Cossio T. Combating slavery in the 21st century: the role of emergency medicine. J Health Care Poor Underserved. 2012;23(3):980-7.
5. Siemaszko C. Women addicted to opioids turn to sex work in West Virginia. NBC News: One Nation Overdosed. Published 2018, April 30. Avsilsblr syz; https://www.nbcnews.com/news/us-news/womenaddicted-opioids-turn-sex-work-west-virginia-n868591. Accessed February, 16, 2023.
6. Department of Justice. Human Trafficking Prosecution Unit (HTPU). 2020. Available at: https://www.justice.gov/crt/human-traffickingprosecution-unit-htpu. Accessed February, 16, 2023.
7. Human Trafficking and the Health Care Industry. Polaris. 2022. Available at: https://polarisproject.org/human-trafficking-and-the-healthcare-industry/. Accessed February, 16, 2023.
8. Human Trafficking Statistics by State 2021. World Population Review. 2021. Available at: https://worldpopulationreview.com/state-rankings/ human-trafficking-statistics-by-state. Accessed February, 16, 2023.
9. International Labour Organization (ILO). Profits and Poverty: The Economics of Forced Labour. 2014. Available at: https://www.ilo. org/global/topics/forced-labour/publications/WCMS_243391/lang-en/index.htm#:~:text=This%20report%20highlights%20how%20 forced,literacy%2C%20migration%20and%20other%20factors Accessed August, 15, 2022.
10. Jarrell K. Annals of B-Pod: Human Trafficking. Taming the SRU. 2019. Available at: https://www.tamingthesru.com/blog/annals-of-b-pod/bpod-cases/human-trafficking. Accessed February, 16, 2023.
11. UN Protocol to Prevent, Suppress, and Punish Trafficking in Persons, Especially Women and Children. United Nations Convention against Transnational Organized Crime and the Protocols Thereto. United Nations. 2003. Available at: http://www.unodc.org/unodc/en/treaties/ CTOC/index.html. Accessed February, 16, 2023.
12. United States Department of State. Trafficking in persons report 2013. U.S. Department of State. 2013. Available at: https://2009-2017.state. gov/j/tip/rls/tiprpt/2013/index.htm. Accessed February, 16, 2023.
REFERENCES
1. Lederer LJ, Wetzel CA. The health consequences of sex trafficking and their implications for identifying victims in healthcare facilities. Ann Health Law. 2014. Available at: https://heinonline.org/HOL/ Page?handle=hein.journals/anohl23&div=8&g_sent=1&casa_token=R 6GPGygsidoAAAAA:wD20lcbY56j_gjYFH5VZuCXb9hvztknCrXSSknQ 0fyAapqm-&collection=journals. Accessed February, 16, 2023.
13. Becker HJ, Bechtel K. Recognizing victims of human trafficking in the pediatric emergency department. Pediatr Emerg Care. 2015;31(2):1447; quiz 148-150.
14. Sanyon L. How and why human trafficking is a prevalent problem in West Virginia. 12WBOY. 2019. Available at: https://www.wboy.com/ news/how-and-why-human-trafficking-is-a-prevalent-problem-inwestvirginia/. Accessed February, 16, 2023.
15. Appalachian Regional Commission. About the Appalachian Region. Appalachian Regional Commission. Available at: https://www.arc.gov/
Volume 24, NO.3: May 2023 467 Western Journal of Emergency Medicine
Jarrell et al.
It
Human Trafficking in Appalachia and What EPs Can Learn from It
about-the-appalachian-region/. Accessed February, 16, 2023.
16. Partridge M, Betz M, Lobao L. Natural Resource Curse and Poverty in Appalachian America. 2012. Available at; https://mpra.ub.unimuenchen.de/38290/. Accessed February 13, 2023.
17. Hendrix S. Anti-human-trafficking initiative aims to serve, bridge gaps in Ohio Appalachian counties. The Columbus Dispatch. 2021. Available at: https://www.dispatch.com/story/news/2021/01/02/eyes-upappalachia-aims-educate-rural-ohioans-human-trafficking/3956763001
Accessed February, 16, 2023.
18. Appalachian Regional Commission. Income and Poverty in Appalachia. Appalachian Regional Commission. 2022. Available at: https://www.arc.gov/income-and-poverty-in-appalachia/. Accessed February, 16, 2023.
19. Marshall JL, Thomas L, Lane ML, et al. Health Disparities in Appalachia. Appalachian Regional Commission; 2017. Available at: https://www.arc.gov/wp-content/uploads/2020/06/Health_Disparities_ in_Appalachia_August_2017.pdf. Accessed February, 16, 2023.
20. Thompson JR, Creasy SL, Mair CF, et al. Drivers of opioid use in Appalachian Pennsylvania: cross-cutting social and community-level factors. Int J Drug Policy. 2020;78:102706.
21. Corra C, Issner B. What Is Appalachia? (No. 114). In Appodlachia. 18 Husky. Available at: https://appodlachia.com/. Accessed February, 16, 2023.
22. Robinson R. HRS Presents Special Report: Human Trafficking in Appalachian Ohio. HRS Presents; 2020. Available at: https://www. youtube.com/watch?v=Qp3EPX4sn24. Accessed February, 16, 2023.
23. Lofton K. West Virginia sees increase in “family” sex trafficking related to opioid epidemic. 100 Days in Appalachia. 2018. Available at: https:// www.100daysinappalachia.com/2018/01/west-virginia-sees-increasefamily-sex-trafficking-related-opioid-epidemic/. Accessed February, 16, 2023.
24. Cole J And Anderson. Sex trafficking of minors in Kentucky. University of Kentucky: Center on Trauma and Children Reports. 2013. Available at: https://uknowledge.uky.edu/ctac_reports/2/. Accessed February, 16, 2023.
25. Raphael J. Parents as pimps: survivor accounts of trafficking of children in the United States. Dignity J Anal Exploit Violence. 2020;4(4):7.
26. Chisolm-Straker M, Singer E, Rothman EF, et al. Building RAFT: trafficking screening tool derivation and validation methods. Acad Emerg Med. 2020;27(4):297-304.
27. Capitol Broadcasting Company. NC among top 10 states for human trafficking. Spotlight WRAL.com. 2017. Available at: https://www. wral.com/nc-among-top-10-states-for-human-trafficking/16515034/ Accessed February, 16, 2023.
28. Frolik C. Sex traffickers thrive on Ohio’s interstates. Dayton Daily News. 2013. Available at: https://www.daytondailynews.com/news/ sex-traffickers-thrive-ohio-interstates/k9UgXeMozuvXhM2jqyoBhI/ Accessed February, 16, 2023.
29. Polaris Project. Unique Obstacles Put Transgender People at Risk of Trafficking. Polaris Project Blog. 2017. Available at: https:// polarisproject.org/blog/2017/03/unique-obstacles-put-transgenderpeople-at-risk-of-trafficking. Accessed February, 16, 2023.
30. Nichols JM. Grassroots groups help LGBTQ people survive - and thrive - in Appalachia. NBC News. 2020. Available at: https://www. nbcnews.com/feature/nbc-out/grassroots-groups-help-lgbtq-peoplesurvive-thrive-appalachia-n1144881. Accessed February, 16, 2023.
31. Smith M. The foster care system and human trafficking. Freedom Network. 2021. Available at: https://freedomnetworkusa. org/2021/05/20/the-foster-care-system-and-human-trafficking/ Accessed February, 16, 2023.
32. The opioid epidemic, foster care, and human trafficking. Human Trafficking Search. Published May 8, 2018. Available at: https:// humantraffickingsearch.org/opioid-epidemic-foster-care-humantrafficking/. Accessed February, 16, 2023.
33. Radel L, Baldwin M, Crouse G, et al. Substance use, the opioid epidemic, and the child welfare system: key findings from a mixed methods study. Office of the Assistant Secretary for Planning and Evaluation. 2018. Available at: https://bettercarenetwork.org/sites/ default/files/SubstanceUseChildWelfareOverview.pdf. Accessed February, 16, 2023.
34. Tiller J, Reynolds S. Human trafficking in the emergency department: improving our response to a vulnerable population. West J Emerg Med. 2020;21(3):549-54.
35. Baldwin SB, Barrows J, Stoklosa H. HEAL Trafficking and Hope for Justice. Protocol toolkit for developing a response to victims of human trafficking. Available at: https://healtrafficking.org/2017/06/protocoltoolkit/. Accessed February, 16, 2023.
36. Framework for a Human Trafficking Protocol in Healthcare Settings. National Human Trafficking Resource Center. 2010. Available at: https://humantraffickinghotline.org/sites/default/files/Framework%20 for%20a%20Human%20Trafficking%20Protocol%20in%20 Healthcare%20Settings.pdf. Accessed February, 16, 2023.
37. Brown T, Ashworth H, Bass M, et al. Trauma-informed care interventions in emergency medicine: a systematic review. West J Emerg Med. 2022;23(3):334-44.
38. Downloadable awareness materials. National Human Trafficking Hotline. 2022. Available at: https://humantraffickinghotline.org/getinvolved/downloadable-resources. Accessed August, 15, 2022.
39. Trauma-Informed Approach. National Human Trafficking Training and Technical Assistance Center. Available at: https://nhttac.acf.hhs.gov/ soar/eguide/respond/Trauma_Informed_Care. Accessed February, 16, 2023.
40. Kirschner F, Goodspeed T, Baker D, et al. Human trafficking and health care providers: legal requirements for reporting and education. Jones Day & HEAL Trafficking. Available at: https://healtrafficking. org/2021/01/legal-requirements-for-reporting-and-education/. Accessed February, 16, 2023.
Western Journal of Emergency Medicine 468 Volume 24, NO.3: May 2023
Jarrell et al.
Political Priorities, Voting, and Political Action Committee Engagement of Emergency Medicine Trainees: A National Survey
Rachel E. Solnick, MD, MSc*,||
Zach K. Jarou, MD, MBA†
Cheryl K Zogg, PhD, MSPH, MHS, MD-PhD Candidate‡
Dowin Boatright, MD, MBA, MHS§,||
Icahn School of Medicine at Mount Sinai, Department of Emergency Medicine, New York, New York (Current)
Michigan State University, East Lansing, Michigan
Yale School of Medicine, New Haven, Connecticut
NYU Grossman School of Medicine, Department of Emergency Medicine, New York
Yale School of Medicine, Department of Emergency Medicine, New Haven Connecticut (Previously at)
Section Editor: Andrew W Phillips, MD, MEd
Submission history: Submitted November 4, 2022; Revision received February 1, 2023; Accepted February 12, 2023
Electronically published May 5, 2023
Full text available through open access at http://escholarship.org/uc/uciem_westjem
DOI: 10.5811/westjem.59351
Introduction: Medicine is increasingly influenced by politics, but physicians have historically had lower voter turnout than the general public. Turnout is even lower for younger voters. Little is known about the political interests, voting activity, or political action committee (PAC) involvement of emergency physicians in training. We evaluated EM trainees’ political priorities, use of and barriers to voting, and engagement with an emergency medicine (EM) PAC.
Methods: Resident/medical student Emergency Medicine Residents’ Association members were emailed a survey between October–November 2018. Questions involved political priorities, perspective on singlepayer healthcare, voting knowledge/behavior, and EM PACs participation. We analyzed data using descriptive statistics.
Results: Survey participants included 1,241 fully responding medical students and residents, with a calculated response rate of 20%. The top three healthcare priorities were as follows: 1) high cost of healthcare/price transparency; 2) decreasing the number of uninsured; and 3) quality of health insurance. The top EM-specific issue was ED crowding and boarding. Most trainees (70%) were supportive of singlepayer healthcare: “somewhat favor” (36%) and “strongly favor” (34%). Trainees had high rates of voting in presidential elections (89%) but less frequent use of other voting options: 54% absentee ballots; 56% voting in state primary races; and 38% early voting. Over half (66%) missed voting in prior elections, with work cited as the most frequent (70%) barrier. While overall, half of respondents (62%) reported awareness of EM PACs, only 4% of respondents had contributed.
Conclusion: The high cost of healthcare was the top concern among EM trainees. Survey respondents had a high level of knowledge of absentee and early voting but less frequently used these options. Encouragement of early and absentee voting can improve voter turnout of EM trainees. Concerning EM PACs, there is significant room for membership growth. With improved knowledge of the political priorities of EM trainees, physician organizations and PACs can better engage future physicians. [West J Emerg Med. 2023;24(3)469–478.]
INTRODUCTION
The practice of medicine is increasingly influenced by politics. In the United States, tax-financed expenditures were
estimated to fund 66% of all national health expenditures in 2020.1 Emergency medicine (EM) is particularly exposed to the effects of political changes because emergency
Volume 24, NO.3: May 2023 469 Western Journal of Emergency Medicine * † ‡ § || Original Research
departments see a disproportionately higher share of patients insured by Medicaid, a state- and federal government-funded program.2 Despite the important influence of elected officials on US healthcare, adjusted physician voter turnout rates have historically been lower than that of the general population.3,4 Recently, turnout has increased for physicians and is now similar to or slightly higher than the general population in the 2018 and 2020 elections.5 Voter turnout is still lower for millennials (the generation born 1981-1996), which includes most EM trainees, even though this demographic is quickly approaching the “baby boom” cohort (born 1946-1964) as the largest share of the electorate.6 While there are speculated reasons for low physician-voter turnout,4,5,7 less is known about trainees’ voting behaviors or barriers to voting.
Understanding the political priorities of future physicians is of critical importance for physician organizations and political action committees (PAC) in a time of partisan division. Health professional PACs have a significant monetary impact in election cycles; PACs contributed $24.9 million in the 2018 election cycle, surpassing the total amount from health insurers or hospital groups.8 However, EM trainees have low participation rates in the National Emergency Medicine PAC (NEMPAC),9 one of the largest EM PACS and the fourth largest contributor of all physician PACS, spending over $2 million in the 2018 election cycle.10 Despite high EM PAC contributions, EM trainee participation in an EM PAC is lower than other specialty physician trainees’ participation rates in their PACS.11-13 Little is currently known about the political interests of EM trainees, and highly engaged trainees in particular. Also less understood is the EM trainee’s perspective on specific key-item political topics such as single-payer health coverage, an issue of recurring interest to EM physician organizations.14
In this study our goal was to characterize EM trainees’ political priorities, knowledge, and experiences with voting as well as their participation and interest in EM PACs. We secondarily explored how political priorities vary by political party and voter registration varies by training level. We present data from EM residents and medical students who, as respondents to a survey from a trainee organization, are more likely to represent socially engaged individuals.15 As such, their political interests and PAC involvement have particular value to the institution of EM, as actively involved medical trainees are more likely to join physician organizations16 and make political campaign donations.17
METHODS
Study Design and Participants
This was a cross-sectional online survey emailed as an anonymous link to medical students and resident members of the Emergency Medicine Residents Association (EMRA) three times between October 1– November 16, 2018. The EMRA email list at the time of the survey comprised approximately 69% residents and 31% medical students. To recruit
Population Health Research Capsule
What do we already know about this issue?
US politics influence medical practice, but physicians have lower voter turnout than the public. Less is known about EM trainees’ political priorities and behavior.
What was the research question?
We surveyed EM trainees on political priorities, voting behavior/barriers, and EM political action committee (PAC) use.
What was the major finding of the study?
Their top priority was the high cost of healthcare; 54% reported absentee ballots use and 38% reported early voting; just 4%, donated to EM PACs.
How does this improve population health?
Physician organizations can better engage trainees on their top issues of patient access. Early voting and absentee ballots will improve voter turnout for trainees.
participants, we stratified trainees by training level (medical student vs resident); as part of a separate, unrelated study on survey incentives.18 The trainees were randomized to one of four incentive levels: one Amazon gift card worth $5, $25, $100, or none. Email subject lines were non-partisan as follows: “Planning to vote?”; “Make your voice heard”; and “Last call to participate!” The study was approved by the Yale institutional review board and is reported following the Strengthening the Reporting of Observational Studies in Epidemiology (STROBE) guidelines (see Appendix 3).19
Survey Outcomes
The survey was composed of three primary outcomes to describe EM trainee political priorities, voting, and PAC involvement (survey instrument in Appendix 2). The survey questions were informed by prior literature regarding medical trainees and their political interests and PAC involvement.11,12,20,21 In the first part of the survey, respondents were asked to rank their top three political priorities from the following subjects: 1) general healthcare; 2) emergency physician issues; and 3) US politics. We created this list of topics based on the current year’s National EMPAC 2018 candidate questionnaire, on Gallup Poll’s top issues for voters,22,23 the American College of Emergency Physicians’ Legislative & Regulatory Priorities, and this survey’s pilot feedback. As part of the political priorities section we also assessed opinions on single-payer healthcare, based on language
Western Journal of Emergency Medicine 470 Volume 24, NO.3: May 2023 Political Priorities of Emergency Medicine Trainees Solnick et al
used by the non-partisan Kaiser Family Foundation.24 In the second part of the survey, we assessed voting behavior and voting knowledge—registration, primaries, absentee, and early voting— based on questions from the US Census Voting and Registration Supplement.25 Lastly, we assessed participants’ awareness and engagement in any EM PAC.
Survey Development
A 36-item survey covering political priorities, voting, and PACS was informed by published guidelines for questionnaire development.26 The survey was designed to take fewer than 10 minutes to complete. The authors who developed the survey included a health services researcher experienced in qualitative evaluations and two EM national representatives versed in EM trainee advocacy and health policy. To begin the survey development process, we searched relevant literature to assemble questions from existing surveys11,12,20–25 and, where necessary, developed new questions for the preliminary survey instrument. Using this initial survey, we conducted cognitive interviews with three EM residents to assess response process validity and ensure survey instrument comprehension. Interviewees verbalized their interpretation of the questions while taking the survey using the “think-aloud” approach. We then iteratively updated the survey following interviews if there was confusion on any questions. Next, pilot surveys were distributed to a convenience sample of eight trainees of different training levels and at institutions with geographical variety. The eight participants who completed the pilot survey provided written feedback on short forms following the survey. The survey was then edited in an iterative process to correct comprehension and technical issues based on the written pilot feedback and assessed to ensure outcomes were complete and appropriate.
Survey Validity Approach
Validity evidence for our survey instrument is described following Messick’s sources of evidence framework adapted for medical education:27 1) content: the wording of questions was derived from literature or developed with cognitive interviews and pilot feedback; 2) response process: respondents’ self-report of voting activity—an approach employed by the U.S. Census for national data on voting—and political beliefs was conducted anonymously and thus less likely to be influenced by social desirability bias; 3) internal structure: where appropriate, variables were analyzed for reliability via Cronbach’s alpha, and theoretically related variables were assessed for correlations using Spearman’s correlation; and 4) relationships with other variables: comparing data to national data where possible.
Data Analysis
We calculated response rates according to the American Association for Public Opinion Research (AAPOR) response rate 4 (RR4) definition.28 This calculation includes partial
survey responses (AAPOR-defined as 50-80%) and completed surveys (AAPOR-defined as more than 80% complete), and considers a variable to estimate what proportion of cases of unknown eligibility are eligible. Because we did not know how many of the email addresses we included in the survey were active and, thus, what percentage was non-respondents vs potentially inactive email addresses, we estimated this eligibility variable by the maximum open rates of any previous email sent from the EMRA email list that year. We identified an open rate of 87% for students and 48% for residents and used these percentages for our eligibility variable. We evaluated non-response bias according to Halbesleben et al’s decision framework:29 a) wave analysis comparing the first to last respondents; b) comparing respondents to nonrespondents based on available characteristics of gender, training year, and US Census Division; and c) comparing respondents to national benchmark data. We used frequency weighting to address differences between respondents and non-respondents on known characteristics from the whole population: gender; training year; and ZIP code.30
To determine aggregate ranking for political priorities, we scored choices following a Borda count approach31: 1st = 3 points; 2nd = 2 points, and 3rd = 1 point. Standard descriptive statistics were used to report the primary outcome variables. We used chi-square tests to compare how demographics, political priorities, and single-payer perspective varied by political party, as well as how voter registration varied by training level with p<0.05 as the threshold for statistical significance. Data were included if at least 50% of the survey was completed and responses were dropped as missing if less than 50% was completed. We used Qualtrics LLC (Provo, UT) for survey management and Stata v16.1 (StataCorp LLC, College Station, TX) for analysis.
RESULTS
Participant Characteristics
Of 8,493 potential participants, the response rate calculated using the AAPOR RR4 definition was 20% including 1,241 individuals who completed 100% of the survey, 13 who completed over 80%, and 56 who partially completed between 50-80% of the survey. (See Appendix 1 for details.) Unless otherwise specified, proportions are reported below as unweighted for simplicity, given the similarities between weighted and unweighted results. Of the sample of 1,241 individuals, 500 were female (40%), and almost half were medical students (570/1271, 45% observed, 24% weighted) (Table 1). Most respondents of the observed sample were socially liberal (682/1241, 55%) and fiscally liberal (444/1232, 36%). Regarding political parties, weighted proportions were as follows: 47% Democrat, 29% Independent, and 11% Republican. Females, compared to males, were more likely to be Democrat (P<0.001), with 288/490 females (59%) reporting Democratic Party affiliation vs 348/741 males (47%) identifying as Democrats. The
Volume 24, NO.3: May 2023 471 Western Journal of Emergency Medicine Solnick et al Political Priorities of Emergency Medicine Trainees
FISCAL political ideology
Note: Two-sided P-values taken from chi-squared tests of non-response weighted values. Non-response weights based on gender, training year, and geographic location. PGY, postgraduate year.
Western Journal of Emergency Medicine 472 Volume 24, NO.3: May 2023
Solnick et al Overall Non-response weighted % Observed N (1,241) Observed % Non-response weighted % Republican (11.3%) Democrat (46.9%) Independent (28.5%) No preference (13.3%) P-value Gender Female 500 40.3% 40.1% 11.3% 54.5% 27.8% 6.4% <0.001 Male 741 59.7% 59.9% 11.3% 41.8% 29.1% 17.9% Training year M1-2 82 6.1% 4.3% 13.7% 45.5% 32.2% 8.3% <0.001 M3 106 8.5% 5.0% 6.7% 50.2% 31.2% 11.7% M4 382 30.8% 14.9% 12.7% 53.5% 27.5% 6.3% PGY1 231 18.6% 26.3% 14.0% 56.2% 25.2% 4.6% PGY2 189 15.2% 20.7% 4.6% 38.8% 31.8% 24.7% PGY3 155 12.5% 18.6% 9.3% 37.5% 29.2% 24.1% PGY4 86 6.9% 10.0% 20.6% 46.6% 27.9% 4.8% Missing 10 0.8% 0.2% 12.5% 6.3% 25.0% 56.3% Race White 956 77.0% 75.6% 12.0% 45.6% 29.7% 12.7% <0.001 Black 57 4.6% 3.0% 1.2% 66.4% 22.4% 10.0% Asian 201 16.2% 18.2% 11.0% 44.7% 26.2% 15.6% American Indian 9 0.7% 0.3% 31.0% 27.6% 27.6% 13.8% Native Hawaiian/ Pacific Islander 4 0.3% 0.1% 45.4% 0.0% 0.0% 54.6% Missing 14 1.1% 2.8% 0.0% 64.2% 20.6% 15.2% Ethnicity Hispanic/Latino 99 8.0% 6.3% 20.0% 55.7% 7.6% 16.7% <0.001 Not Hispanic/Latino 1122 90.1% 92.2% 10.7% 44.7% 29.3% 13.1% Missing 20 1.6% 1.5% 10.9% 14.7% 68.2% 6.2% SOCIAL political ideology Extremely liberal 171 13.8% 11.0% 0.8% 92.8% 4.5% 1.9% <0.001 Liberal 682 55.0% 57.9% 5.6% 50.6% 37.6% 6.2% Neutral 152 12.3% 11.5% 22.3% 9.1% 26.7% 41.5% Conservative 144 11.6% 11.4% 42.8% 6.7% 17.0% 33.5% Extremely conservative 16 1.3% 0.7% 77.2% 10.5% 12.3% 0.0% Missing 76 6.1% 7.5% 0.2% 73.1% 16.2% 10.5%
Political Priorities of Emergency Medicine Trainees
Extremely liberal 38 3.1% 2.4% 0.0% 91.8% 8.2% 0.0% <0.001 Liberal 444 35.8% 32.5% 0.1% 76.2% 19.2% 4.5% Neutral 275 22.2% 22.6% 10.5% 55.3% 25.2% 9.0% Conservative 382 30.8% 33.0% 16.9% 10.1% 46.2% 26.9% Extremely conservative 59 4.8% 4.4% 75.4% 7.9% 9.7% 7.1% Missing 34 3.5% 5.1% 0.0% 74.0% 14.8% 11.2%
Table 1. Characteristics of emergency medicine trainee respondents.
distribution of respondents was similar to the locations of EM residencies (eFigure 1), with the top areas being Middle Atlantic (22%) and East North Central (20%) (eTable 1) Respondents’ locations are displayed geographically by their reported political party in Figure 1.

involving a wave analysis and comparison of respondents to non-respondents. We conducted a wave analysis comparing the first 200 respondents to the last 200 respondents based on their demographics and answers to survey questions on single-payer health insurance and PAC awareness (eTable 3). Late respondents had slightly lower rates of females (56% vs 66%, respectively), lower rates of medical students (30% vs 37%), were less likely to be from the South Atlantic region (12% vs 19%), more likely to be from the Pacific region (14% vs 8%). Late and early respondents were similar in political party, ideology, perspective on the issue of single-payer health insurance, and awareness of PACS. Next, we compared data between respondents and nonrespondents based on known characteristics from the EMRA email list. Non-respondents compared to respondents had lower rates of medical students (27% vs 45%, respectively), and slightly lower rates of females (37% vs 40%) but similar geographic distribution (eTable 1). Lastly, compared to national data on emergency physician race and resident gender from the Association of American Medical Colleges in 2018, 34–36 (eTable 4) our study is similar to national data for female proportion (40% vs 36%, respectively), and representation of Black (5% vs 5%), and Hispanic (8% vs 5%).
Political Priorities
General Healthcare Priorities
Survey Validity Assessment
In assessing the survey instrument’s reliability, Cronbach’s alpha comparing social and fiscal ideology scales (two items measuring conceptually similar outcomes) had acceptable internal consistency with α = 0.76. Supporting the survey’s construct validity, Spearman’s correlation indicated a significant association between theoretically similar groupings of being more liberal and Democrat and favoring single-payer healthcare coverage. Additionally, there was a significant correlation between awareness of absentee voting, early voting, and primaries (correlational matrix in eTable 2). While to our knowledge there is no national polling on political party identification for medical trainees, in comparing our survey findings to other published Gallup Poll national data, we found similarities between the increase in numbers of the Millennial generation identifying less frequently as Republicans and more frequently as Independents compared to older age categories.32 Compared to previously reported voting rates of residents from other specialties, 90% of plastic surgery trainees reported voting in the 2016 election compared to the 89% of EM trainees who reported in this survey as having voting in the 2016 election, although this is lower than national data for physicians (63%) in the 2018 election.33
Non-response Bias Analysis
In addition to calculating frequency weighting for the responses based on gender, training year, and geographic location, we additionally conducted analyses to assess non-response bias. For this analysis, we followed a decision framework29
Overall, trainees ranked their top three healthcare priorities as follows: 1) high cost of healthcare/price transparency, 2) decreasing the number of uninsured, and 3) the quality of health insurance (Figure 2, tabular form in eTable 5) .The rest of the priorities were ranked in the following order: mental health services availability: family planning/women’s reproductive health; Medicare/Medicaid solvency for the future; high cost of prescriptions; the opioid epidemic; drug shortages; and disaster preparedness. The
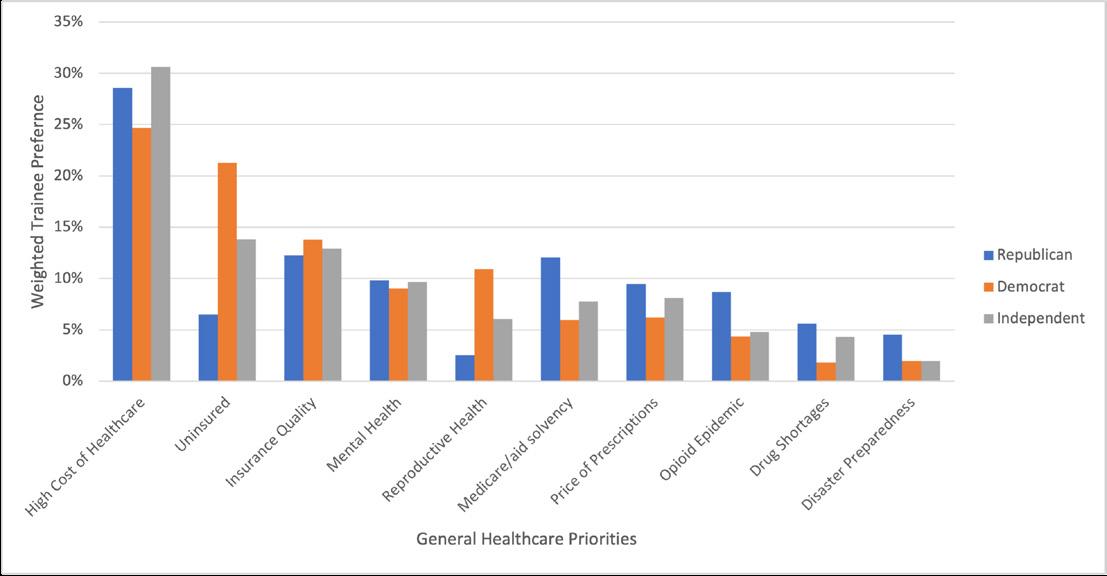
Volume 24, NO.3: May 2023 473 Western Journal of Emergency Medicine Solnick et al Political
of Emergency Medicine
Priorities
Trainees
Figure 1. Geographic location in the United States of survey respondents based on ZIP code location. Location is displayed by the respondent’s stated political party.
Figure 2. Weighted distribution of general healthcare priorities of trainees in emergency medicine. Participants ranked 1,2,3 level priority where 1 was highest concern and given 3 weighted points; level 3 priority was 1 point. The total points for each category were divided by total points per trainee grouping by party identification.
ranking of priorities differed significantly by political party affiliation across all three sets of issues: general healthcare; emergency physician issues; and general politics (P<0.05). The most considerable differences in rank were as follows: a) decreasing the uninsured was ranked second by both Independents and Democrats compared to seventh by Republicans; b) reproductive healthcare was ranked fourth for Democrats compared to seventh for Independents and 10th for Republicans; and c) solvency for Medicare and Medicaid was ranked third for Republicans compared to seventh for Democrats, and sixth for Independents.
Emergency Physician Priorities
For emergency physician-specific issues, the top concerns were as follows: 1) ED crowding and boarding; 2) regulatory burden on physicians; and 3) malpractice reform. (Figure 3, tabular form in eTable 6). The rest of the priorities were ranked in the following order: emergency services as a covered insurance benefit; physician reimbursement; federal
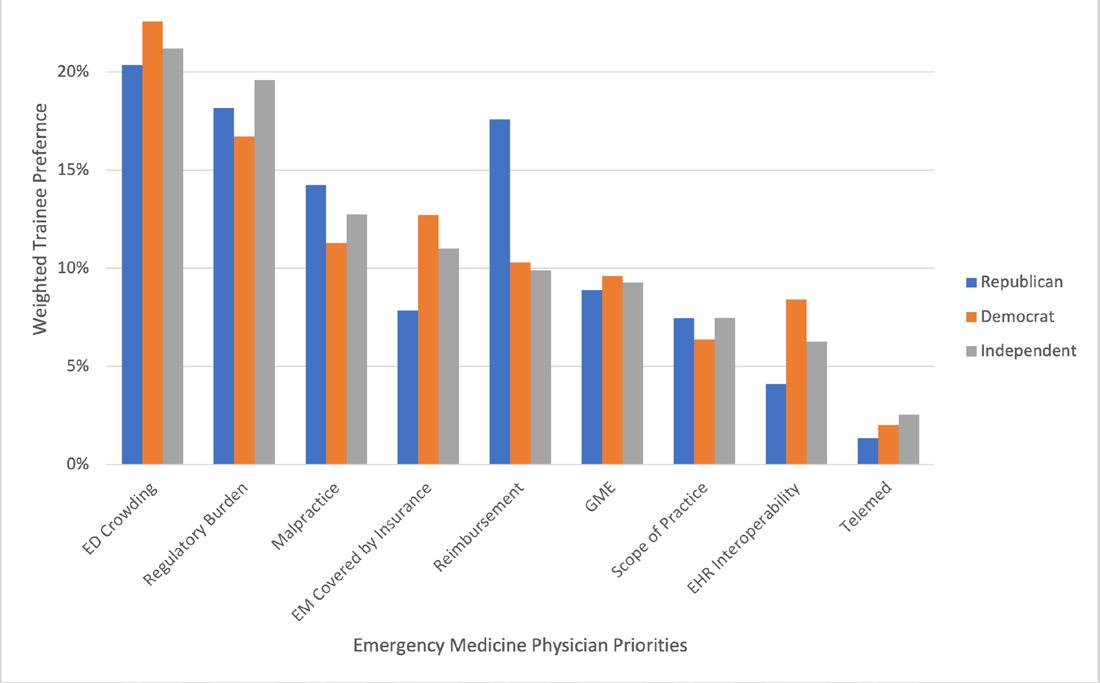
American Political Priorities
For general American political issues, the priorities were as follows: 1) healthcare; 2) wealth inequality; and 3) education (eFigure 2, tabular form in eTable 7). The rest of the priorities were ranked in the following order: political corruption; racial disparities; federal budget deficit/ spending/ taxes; environment/pollution; gun safety/ control; economy/unemployment/ jobs; immigration; foreign policy; national security; criminal justice reform; and drug policy. Although healthcare was a top issue for all political parties responding, priorities varied widely by political party. The most considerable differences by top priorities were a) wealth inequality was second for Democrats, third for Independents, and 12th for Republicans; b) racial disparities were third for Democrats, sixth for Independents, and 11th for Republicans; and c) the budget deficit was first for Republicans, fifth for Independents, and eighth for Democrats.
Regarding opinions on single-payer insurance, overall, trainees were highly supportive (869/1239, 70%: “somewhat” (36%), and “strongly favor” (34%) (Figure 4) Opinions on single-payer insurance differed significantly by party lines (P<0.05), with most Democrats (564/637, 89%) in favor of it
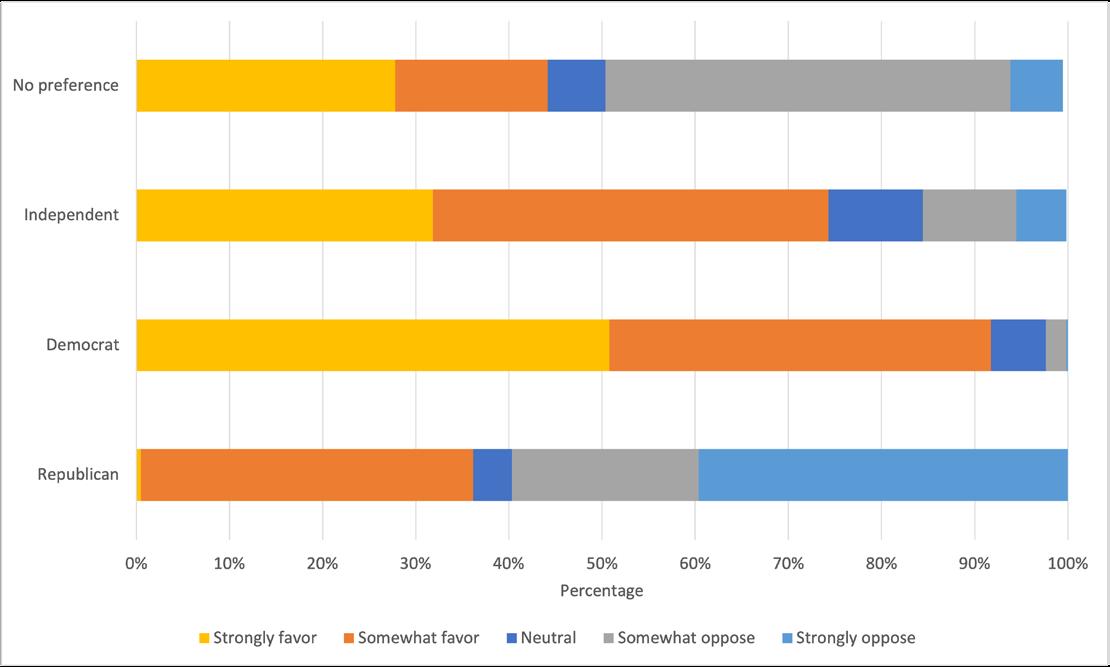
funds for graduate medical education residency slots; the scope of practice (physician supervision of advanced practice practitioners), health information exchange interoperability; and telemedicine and other modern delivery systems. There were similarities in ranking across political party affiliation among the top three issues for this category. There were differences by political party affiliation for some lower rated matters: a) reimbursement was third for Republicans and fifth for Democrats and Republicans; and b) EM services covered by insurance was third and fourth for Democrats and Independents, respectively, but was sixth for Republicans.
and the majority of Republicans (126/176, 72%) against.
Voting
Trainees reported high rates of Election Day voting but lower use of early voting opportunities or absentee ballot (Figure 5). Most respondents (89% (1043/1170)) reported voting in the last presidential election. While most respondents reported awareness of absentee voting, early voting, and primary elections (96%, 84%, and 90%, respectively), of those who were aware, far fewer reported previously using absentee ballots (644/1192, 54%), early voting (399/1038, 38%), and voting in state primaries (619/1104, 56%). Of those who had not previously voted early, absentee, or in the primaries, approximately one-third to half would want to
Western Journal of Emergency Medicine 474 Volume 24, NO.3: May 2023
of
Medicine
Solnick et al
Political Priorities
Emergency
Trainees
Figure 3. Weighted distribution of emergency physician priorities of EM trainees in emergency medicine. Participants ranked 1,2,3 level priority where 1 was the highest concern and given three weighted points, level 3 priority was 1 point. The total points for each category were divided by total points per trainee grouping by party identification.
Figure 4. Weighted distribution of emergency medicine trainees’ opinions on single-payer healthcare by political party identification EM, emergency medicine.
learn more or consider future use of these voting options.
Many trainees did not vote due to commonly cited barriers (eFigure 3). More than half (66%, 771/1169) of EM trainees had missed voting in prior elections. Among those who missed voting or had never voted, common reasons were working (525/752, 70%); personal life (374/737, 51%); didn’t feel voting made a difference (304/ 738, 41%); forgot to vote (294/723, 41%); and failed to register (182/711, 26%). Free-text responses also cited travel, being out of their home district, forgetting to request or send in absentee ballots, or not knowing enough about the candidates.
Approximately a quarter of trainees had voter registration at a previous address (300/1169, 26%). Registration at an earlier address varied significantly (P<0.01) by training level such that medical students (MS) and residents in their first postgraduate year (PGY) had almost double the rate of still being registered at a previous address compared to those in their fourth year: medical students’ previous address registrations were MS1 (43%, 6/14) vs MS4 (21%, 76/285); resident previous address registrations were PGY1 (40%, 86/214) vs PGY4 (17 %, 13/77).
Political Action Committee
Engagement in the PAC was low, but many respondents were interested in learning more (eFigure 4). Just over half (767/1238, 62%) of trainees knew there was an EM PAC. Only 7% (52/767) of those who were aware had contributed (4% of 1,238 respondents to the PAC awareness question). Equal proportions of EM trainees who reported they were aware of the PAC would consider donating (50%) 380/767 or were not interested (44%) 335/767. Many free-text respondents who wanted to avoid contributing to the PAC reported financial difficulties as a barrier.
DISCUSSION
To our knowledge, this is the first national study to investigate EM trainees’ political awareness, interests, and behavior. Importantly, their main general healthcare priorities centered around the affordability of healthcare and insurance
coverage. Regarding EM-specific priorities, ED crowding and boarding were top concerns, while reimbursement was a lower priority.
These rankings differ substantially from that of other specialty physicians’ prioritization: In a 2014 study of 397 young plastic surgery physicians, the scope of practice and Medicare reimbursement were first and second highest priority concerns by 277 and 202 respondents, respectively, while the patient access issue, the “Patient Protection/Affordable Care Act,” was ranked as seventh level priority. 20 In a 2009 study of 2,689 young surgeons, reimbursement was the top concern.21 These differences may reflect the older age groups surveyed in those studies—most were between the ages 30-40—or may reflect the differences in preferences between surgeons, who have higher proportions of physicians who contribute to Republican candidates,37 and emergency physicians.
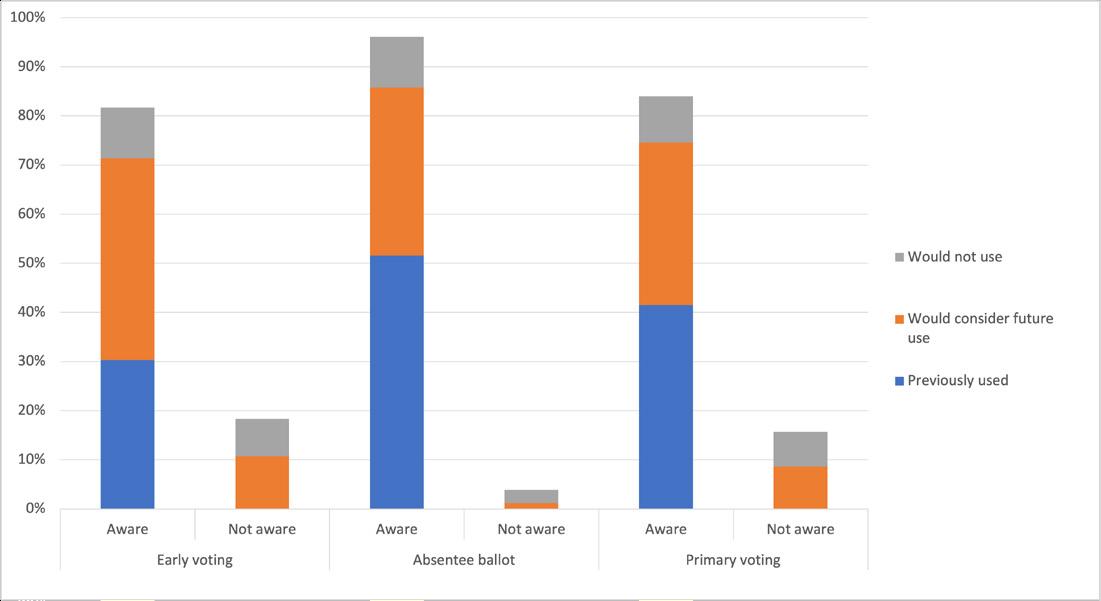
Recent national surveys of medical students have also reflected their high concerns for patients’ ability to afford care.38 These concerns about the cost of healthcare and access issues may explain our survey’s demonstration of the strong support for single-payer health coverage. Our finding that 70% of trainees support single-payer coverage aligns with a 2007 national poll that reported a similar level of support by practicing emergency physicians.39
Additionally, recent events of medical student mobilization for single-payer advocacy within the American Medical Association further reflect the importance of this issue to medical trainees.40 Moreover, the preponderance of EM trainees identifying as Democratic/Independent mirrors the trend in medicine of a shift from the previous conservative base.37,41 This liberalization may be due partly to generational shifts,32 the increasing number of females in medicine37 and EM,42 employee status vs independent practice,37 and the influence of student debt.
Concerning voting, many trainees cited work commitments as a barrier. This finding is consistent with previous national surveys of US citizens, which have shown that practicing physicians are more likely than the general public to cite not voting due to being “too busy, conflicting work or school.”4 However, in contrast to practicing physicians who showed an increased likelihood to vote early,4 EM trainees had low early voting use (38%) but high interest in early voting in future elections (47%). Additional barriers trainees in our study included forgetting to vote or not having a current registration, issues which may be amenable to institutional support and initiatives. These initiatives include flexible Election Day scheduling to allow trainees to vote, reminders to vote early or register for an absentee ballot, and voter registration campaigns, which should be targeted to trainees upon relocating to a new institution, such as Citizen Physicians and TurboVote. Increased visibility and recognition of the importance of voting by medical trainee governing bodies such as the Association of American Medical Colleges and the Accreditation Council for Graduate Medical Education could legitimize Election Day scheduling adjustments
Volume 24, NO.3: May 2023 475 Western Journal of Emergency Medicine Solnick et al Political Priorities of Emergency Medicine Trainees
Figure 5. Weighted distribution of emergency medicine trainees’ voting knowledge and use of voting options.
for trainees to get to the polls.
Additionally, this is the first publicly reported survey of EM trainees’ interest and participation in an EM PAC. Despite high election voting rates and reasonable awareness of the EM PAC (62%), respondents had low rates of contributing (4%). Notably, half of all trainees already aware of the PAC (50%) would “consider donating” if given more information, indicating room for potential growth in PAC awareness and membership with proper outreach and messaging. As consolidation in hospitals rises both hospital prices43 and costs to patients44 without a commensurate rise in physician prices,45 it will become increasingly crucial for PACs to champion causes that matter to individual physicians, especially as physicians increasingly become employees of large practice groups.46,47 To fortify the pipeline of contributors, PACs should focus on membership development of trainees and articulating ways in which PAC goals align with trainees’ top political priorities.
LIMITATIONS
This study has limitations. First, the 20% response rate can be interpreted to limit the generalizability of the findings to non-respondent EM trainees. However, studies of response rates have found that lower responses are less inherently a sign of nonrepresentative data than previously assumed.48,49 Additionally, wave analysis revealed only slight differences between early to late responders, and national demographics were similar to survey demographics. Moreover, survey respondents’ geographical distributions were similar to national EM residency programs, and respondents were of similar race/ethnicity and gender proportions compared to national data. While these analyses and literature are reassuring, we acknowledge that this survey’s findings are likely representative of a trainee who is more likely to be civically engaged than a non-respondent, as suggested by higher-than-expected voting rates.
Although this possible response bias may limit assumptions on the whole of EM trainees, we feel knowledge of this group’s interests are especially important because EM trainees who are engaged now are more likely to be involved in physician organizations and advocacy in the future. Secondly, the reliance on self-report of political activity may limit the internal validity and could contribute to why trainees had high voting rates. Lastly, as a quantitative study, we could not gain a more detailed understanding of political priorities than ranking from prespecified lists, which limits knowledge of alternative preferences. Future research could use qualitative methods to explain political priorities further.
CONCLUSION
Physicians’ participation in the political conversation is even more critical as the US continues to face challenges at the intersection of politics and healthcare. Trainees in EM prioritized healthcare access issues, including the cost of care, health insurance quality, and ED boarding. Single-payer health insurance was favored by most respondents. Many EM trainees
reported high voting levels but lower use of early or absentee voting and lower financial contributions to EM political action committees. With more at stake in the political process, it is even more urgent that the house of medicine prioritizes efforts to recruit, train, and retain future healthcare advocates.
Address for Correspondence: Rachel E. Solnick, MD, Icahn School of Medicine at Mount Sinai, Department of Emergency Medicine, Research Division. 555 West 57th Street, 5th Floor Suite 5-25, New York, New York 10019. Email: Rachel.solnick@ mountsinai.org
Conflicts of Interest: By the WestJEM article submission agreement, all authors are required to disclose all affiliations, funding sources and financial or management relationships that could be perceived as potential sources of bias. The Emergency Medicine Residents Association provided financial support for survey incentives of this survey. There are no conflicts of interest or sources of funding to declare.
Copyright: © 2023 Solnick et al. This is an open access article distributed in accordance with the terms of the Creative Commons Attribution (CC BY 4.0) License. See: http://creativecommons.org/ licenses/by/4.0/
REFERENCES
1. Himmelstein DU, Woolhandler S. The current and projected taxpayer shares of US health costs. Am J Public Health. 2016;106(3):449-52.
2. Gillis KD. Policy Research Perspectives: Physicians’ Patient Mix – A Snapshot from the 2016 Benchmark Survey and Changes Associated with the ACA. 2017. Available at: https://www.ama-assn. org/sites/ama-assn.org/files/corp/media-browser/public/health-policy/ PRP-2017-physician-benchmark-survey-patient-mix.pdf. Accessed December 18, 2018.
3. Grande D, Asch DA, Armstrong K. Do doctors vote? J Gen Intern Med. 2007;22(5):585-9.
4. Solnick RE, Choi H, Kocher KE. Voting behavior of physicians and healthcare professionals. J Gen Intern Med. 2021;36(4):1169-71.
5. Ahmed A, Chouairi F, Li X. Analysis of reported voting behaviors of US physicians, 2000-2020. JAMA Netw Open. 2022;5(1):e2142527.
6. Millennials approach baby boomers as America’s largest generation in electorate. 2018. Available at: https://www.pewresearch.org/ fact-tank/2018/04/03/millennials-approach-baby-boomers-as-largestgeneration-in-u-s-electorate/. Accessed September 22, 2020.
7. Grande D, Armstrong K. Will physicians vote? Ann Intern Med 2016;165(11):814-5.
8. Open Secrets. Health Sector. 2018. Available at: https://www. opensecrets.org/pacs/sector.php?txt=H&cycle=2018. Accessed September 22, 2020.
9. National Emergency Medicine Political Action Committee. 2018 Election Cycle Report.; 2018. https://media.gractions.com/584FC79C
Western Journal of Emergency Medicine 476 Volume 24, NO.3: May 2023 Political Priorities of Emergency Medicine Trainees Solnick et al
2692AEF8BC5DCD38B16B6C2CB8D8259A/b0d2c03c-7542-476b9cbd-d3843ebe4766.pdf
10. Agarwal N, Agarwal P, Taylor TM, et al. Contributions to the Neurosurgery Political Action Committee (NeurosurgeryPAC): a historical perspective. World Neurosurg. 2020;135:273-9.
11. Patel TY. Radiology residents’ attitudes toward recurrent RADPAC political contributions: current data and implications for the future. J Am Coll Radiol. 2014;11(3):33234.
12. Kozusko SD, Lopez J, Sheck CG, et al. Political advocacy from plastic surgery trainees in the United States. Plast Reconstr Surg Glob Open. 2021;9(5):e3590.
13. Calcei JG, Delanois RE, Lajam CM, et al. The Orthopaedic Political Action Committee: growth and influence over 20 years. J Am Acad Orthop Surg. 2020;28(14):563-9.
14. ACEP Health Care Finance Task Force. Considerations for Universal Health Care Systems in the United States. 2018. Available at: https:// www.acep.org/globalassets/sites/acep/media/reimbursement/ health-care-financing-task-force-final-report-to-acep-bod-9.2018.pdf. Accessed September 22, 2020.
15. Porter SR, Whitcomb ME. Non-response in student surveys: the role of demographics, engagement and personality. Res High Educ 2005;46(2):127-52.
16. Brady R, McMenomy B, Chauhan A, et al. Introducing first-year radiology residents to the ACR at the AMCLC from 2009-2011: the potential impact for ACR and state radiological society memberships. J Am Coll Radiol. 2013;10(5):373-5.
17. Tsai JC, Lee PP, Chasteen S, et al. Resident physician mentoring program in ophthalmology: the Tennessee experience. Arch Ophthalmol. 2006;124(2):264-7.
18. Solnick RE, Nogee DP, Jarou Z, et al. 492 The effect of monetary incentives on survey completion by emergency medicine trainees: a randomized trial. AEM. 2020;27(S1):S198-S199.
19. von Elm E, Altman DG, Egger M, et al. The Strengthening the Reporting of Observational Studies in Epidemiology (STROBE) statement: guidelines for reporting observational studies. PLoS Med 2007;4(10):e296.
20. Ver Halen JP, Chen A, Jeffers L, et al. Young Plastic Surgeons Forum member survey: Part II. Advocacy in plastic surgery: opinions toward the ASPS and PlastyPAC. Plast Reconstr Surg. 2014;134(2):353-60.
21. Cherr GS, Moalem J, Dayton MT, et al. Young surgeons’ attitudes regarding surgery and professional organizations. Am J Surg 2009;198(1):142-9.
22. Gallup, Inc. Top Issues for Voters: Healthcare, Economy, Immigration. 2018. Available at: https://news.gallup.com/poll/244367/top-issuesvoters-healthcare-economy-immigration.aspx. Accessed December 18, 2018.
23. Gallup, Inc. Healthcare, immigration down as most important problem. 2018. Available at: https://news.gallup.com/poll/245513/ healthcare-immigration-down-important-problem.aspx. Accessed December 18, 2018.
24. Hamel L, Wu B, Brodie M. Data Note: Modestly strong but malleable support for single-payer health care. KFF Polling. 2017. Available
at: https://www.kff.org/health-reform/poll-finding/data-note-modestlystrong-but-malleable-support-for-single-payer-health-care/. Accessed September 29, 2018.
25. US Census Bureau. Voting and Registration Publications. 2022. Available at: https://www.census.gov/topics/public-sector/voting/ library/publications.html. Accessed November 1, 2022.
26. Artino AR Jr, La Rochelle JS, Dezee KJ, et al. Developing questionnaires for educational research: AMEE Guide No. 87. Med Teach. 2014;36(6):463-74.
27. Cook DA, Kuper A, Hatala R, et al. When assessment data are words: validity evidence for qualitative educational assessments. Acad Med. 2016;91(10):1359-69.
28. American Association for Public Opinion Research (AAPOR). Response Rates - An Overview. Available at: https://www.aapor.org/ Education-Resources/For-Researchers/Poll-Survey-FAQ/ResponseRates-An-Overview.aspx. Accessed February 1, 2021.
29. Halbesleben JRB, Whitman MV. Evaluating survey quality in health services research: a decision framework for assessing nonresponse bias. Health Serv Res. 2013;48(3):913-30.
30. Stata. Stata Journal. Available at: https://www.stata-journal.com/ article.html?article=st0118. Accessed November 1, 2022.
31. Borda JC. Mémoire sur les élections au scrutin: Histoire de l’Académie Royale des Sciences. Paris, France. Published online 1781.
32. Gallup, Inc. Party identification varies widely across the age spectrum. 2014. Available at: https://news.gallup.com/poll/172439/ party-identification-varies-widely-across-age-spectrum.aspx. Accessed November 3, 2022.
33. Flood S, King M, Rodgers R, et al. Integrated Public Use Microdata Series, Current Population Survey: Version 7.0 [dataset]. Published online 2020.
34. AAMC. Practice Specialty, Females by Race/Ethnicity, 2018. 2018. Available at: https://www.aamc.org/data-reports/workforce/data/table12-practice-specialty-females-race/ethnicity-2018. Accessed March 15, 2020.
35. AAMC. Practice Specialty, Males by Race/Ethnicity, 2018. 2018. Available at: https://www.aamc.org/data-reports/workforce/data/table13-practice-specialty-males-race/ethnicity-2018. Accessed November 2, 2022.
36. AAMC. ACGME Residents and Fellows by Sex and Specialty, 2017. 2017. Available at: https://www.aamc.org/data-reports/ workforce/interactive-data/acgme-residents-and-fellows-sex-andspecialty-2017. Accessed March 15, 2020.
37. Bonica A, Rosenthal H, Rothman DJ. The political polarization of physicians in the United States: an analysis of campaign contributions to federal elections, 1991 through 2012. JAMA Intern Med. 2014;174(8):1308-17.
38. Chimonas S, Mamoor M, Kaltenboeck A, et al. The future of physician advocacy: a survey of U.S. medical students. BMC Med Educ. 2021;21(1):399.
39. Carroll AE, Ackerman RT. Support for national health insurance among U.S. physicians: 5 years later. Ann Intern Med 2008;148(7):566-7.
Volume 24, NO.3: May 2023 477 Western Journal of Emergency Medicine Solnick et al Political
of Emergency Medicine Trainees
Priorities
40. Marks C. Inside the American Medical Association’s fight over singlepayer health care. The New Yorker. 2022. Available at: https://www. newyorker.com/science/annals-of-medicine/the-fight-within-theamerican-medical-association. Accessed November 4, 2022.
41. Adamy J, Overberg P. Doctors, once GOP stalwarts, now more likely to be Democrats. WSJ Online. 2019. Available at: https://www.wsj. com/articles/doctors-once-gop-stalwarts-now-more-likely-to-bedemocrats-11570383523. Accessed September 23, 2020.
42. Webb J, Cambron J, Xu KT, et al. First and last authorship by gender in emergency medicine publications- a comparison of 2008 vs. 2018. Am J Emerg Med. 2021;46:445-8.
43. Dauda S. Hospital and health insurance markets concentration and inpatient hospital transaction prices in the U.S. health care market. Health Serv Res. 2018;53(2):1203-26.
44. Rabbani M. Non-profit hospital mergers: the effect on healthcare costs and utilization. Int J Health Econ Manag. 2021;21(4):427-55.
45. Cooper Z, Craig S, Gaynor M, et al. Hospital prices grew substantially faster than physician prices for hospital-based care In 2007-14.
Health Aff. 2019;38(2):184-9.
46. Morgenson G, Saliba E. Private equity firms now control many hospitals, ERs and nursing homes. Is it good for health care? NBC News. 2020. Available at: https://www.nbcnews.com/health/healthcare/private-equity-firms-now-control-many-hospitals-ers-nursinghomes-n1203161. Accessed November 3, 2022.
47. Kane C. Policy Research Perspectives Updated Data on Physician Practice Arrangements: For the First Time, Fewer Physicians Are Owners Than Employees. Available at: https://www.ama-assn.org/ system/files/2019-07/prp-fewer-owners-benchmark-survey-2018.pdf. Accessed November 3, 2022.
48. Groves RM, Peytcheva E. The Impact of nonresponse rates on nonresponse bias: a meta-analysis. Public Opin Q. 2008;72(2):16789.
49. Davern M. Nonresponse rates are a problematic indicator of nonresponse bias in survey research. Health Serv Res 2013;48(3):905-12.
Western Journal of Emergency Medicine 478 Volume 24, NO.3: May 2023 Political Priorities of Emergency Medicine Trainees Solnick et al
Feedback in Medical Education: An Evidence-based Guide to Best Practices from the Council of Residency Directors in Emergency Medicine
Sreeja Natesan, MD*
Jaime Jordan, MD†
Alexander Sheng, MD‡
Guy Carmelli, MD§
Brian Barbas, MD||
Andrew King, MD#
Kataryza Gore, MD¶
Molly Estes, MD**
Michael Gottlieb, MD¶
Duke University, Department of Emergency Medicine, Durham, North Carolina
David Geffen School of Medicine at UCLA, Department of Emergency Medicine, Los Angeles, California
Boston Medical Center, Department of Emergency Medicine, Boston, Massachusetts
University of Massachusetts, Department of Emergency Medicine, Worcester, Massachusetts
Loyola University Chicago, Stritch School of Medicine, Loyola University Medical Center, Department of Emergency Medicine, Maywood, Illinois
The Ohio State University Wexner Medical Center, Department of Emergency Medicine, Columbus, Ohio
Rush University Medical Center, Department of Emergency Medicine, Chicago, Illinois
Loma Linda University, Department of Emergency Medicine, Loma Linda, California
Section Editor: Mark I. Langdorf, MD, MHPE
Submission history: Submitted February 25, 2022; Revision received August 18, 2022; Accepted September 3, 2022
Electronically published May 5, 2023
Full text available through open access at http://escholarship.org/uc/uciem_westjem
DOI: 10.5811/westjem.56544
Within medical education, feedback is an invaluable tool to facilitate learning and growth throughout a physician’s training and beyond. Despite the importance of feedback, variations in practice indicate the need for evidence-based guidelines to inform best practices. Additionally, time constraints, variable acuity, and workflow in the emergency department (ED) pose unique challenges to providing effective feedback. This paper outlines expert guidelines for feedback in the ED setting from members of the Council of Residency Directors in Emergency Medicine Best Practices Subcommittee, based on the best evidence available through a critical review of the literature. We provide guidance on the use of feedback in medical education, with a focus on instructor strategies for giving feedback and learner strategies for receiving feedback, and we offer suggestions for fostering a culture of feedback. [West J Emerg Med. 2023;24(3)479–494.]
BACKGROUND
Feedback is an important tool within medical education for the improvement of clinical skills and professional development.1 However, the emergency department (ED) presents a uniquely complex environment for feedback due to the rapid pace and workflow for patient care, relative lack of privacy, and need for constant task-switching.1 Incorporating feedback into this environment can negatively impact an emergency medicine (EM) resident’s training, with consistent reports of dissatisfaction regarding the quality of feedback received from faculty.2
The Accreditation Council for Graduate Medical Education
(ACGME) Milestones stipulate that important domains for highquality feedback should include timeliness, specificity, balance, recipient feedback/reflection, and an action plan.1,3-30
Despite the importance of feedback, evidence to inform best practices in the ED is limited, and there is a need for evidence-based guidelines to optimize feedback within the ED setting.2,31,32 Based on the best available evidence through a critical review of the literature, we offer expert guidelines on feedback from members of the Council of Residency Directors in Emergency Medicine (CORD) Best Practices Subcommittee. This paper provides readers with recommendations on the use
Volume 24, NO.3: May 2023 479 Western Journal of Emergency Medicine * † ‡ § || # ¶ ** Educational Advances
Feedback in Medical Education: Evidence-based Guide to Best Practices from CORD
of feedback, with a focus on giving and receiving feedback, and suggestions for fostering a positive culture of feedback.
CRITICAL APPRAISAL
This is the tenth article in a series of evidence-based best practice reviews from the CORD Best Practices Subcommittee.33-41 Created for medical educators, these bestpractice reviews cover a wide breadth of topics from clinical teaching, didactics, and journal club to guidance for increasing diversity, equity, and inclusion (DEI) initiatives for faculty and resident recruitment. We conducted a literature search in conjunction with a medical librarian using MEDLINE with a combination of medical subject heading (MeSH) terms and keywords focused on feedback searching for articles published from inception to March 15, 2021 (Appendix). We also reviewed the bibliographies of all included articles. Two authors (SN, MG) independently screened and included articles that addressed delivering feedback, receiving feedback, or feedback culture. We included articles based on discussion and negotiated consensus. Articles were excluded if they were not related to the three domains of feedback. The search yielded 2,402 articles, of which 207 were deemed to be directly relevant to this review. The level and grade of evidence were provided for each best-practice statement implementing the Oxford Centre for Evidence-Based Medicine criteria (Tables 1 and 2).42 When supporting data was not available, we made recommendations based upon our combined experience and consensus opinion drawn from expertise in research and scholarship regarding feedback and medical education. Prior to submission, our manuscript was peer reviewed by the CORD Best Practices Subcommittee and posted to the CORD website for two weeks for review by the entire CORD medical education community. We reviewed the comments and feedback prior to incorporating them into the final manuscript.
Grade of evidence Definition
A Consistent level 1 studies
B Consistent level 2 or 3 studies or extrapolations* from level 1 studies
C Level 4 studies or extrapolations* from level 2 or 3 studies
D Level 5 evidence or troublingly inconsistent or inconclusive studies of any level
*Extrapolation refers to data used in a situation that has potentially clinically important differences than the original study situation.
GIVING FEEDBACK Components and Characteristics of High-quality Feedback
Delivering feedback is a complex process with many influencing factors. Prior literature has demonstrated that feedback practices by faculty vary.31,44 Educational experts, learners, and regulatory bodies agree on several key components and characteristics of high-quality feedback. They recommend that feedback should be clear, specific, timely, and actionable.1,3-22,24-30,45
Clarity in feedback is essential; lack of learner understanding leads to an inability to incorporate feedback into an action plan for improved performance.45 For feedback to be effective and valued by learners, it should be specific and based on directly observed behaviors and encounters.1,9,13,14,24,46–55 In today’s era of competencybased medical education, it is important that feedback be targeted toward learner goals and a shared mental model of competencies and expectations.4,6,11,22,29,47,56–59 Feedback should be given using descriptive, non-judgmental language.14,15,22,48,60 It is important to target feedback toward actions and behaviors rather than judgment of the individual.17,29,61,62 Doing so has the benefit of mitigating the shame response in learners, which can worsen performance and feedback efficacy.10,57,60
Level of evidence Definition
1a Systematic review of homogenous RCTs
1b Individual RCT
2a Systematic review of homogenous cohort studies
2b Individual cohort study or a low-quality RCT*
3a Systematic review of homogenous casecontrol studies
3b Individual case-control study**
4 Case series/Qualitative studies or lowquality cohort or case-control study***
5 Expert/consensus opinion
*Defined as <80% follow up; **includes survey studies and crosssectional studies; ***defined as studies without clearly defined study groups.
RCT, randomized controlled trial.
Experts and learners advocate for feedback to be timely, which increases the likelihood that the feedback will be used for improvement.3–7,20,26,28,30,52,54,63 While finding time to provide feedback during clinical work can be a challenge,46,64–67 realtime feedback has been shown to improve performance.68,69 Additionally, there is literature to support that real-time, workplace-based assessments provide more specific and effective feedback than end-of-rotation evaluations.70 The optimal volume and frequency of feedback are unknown. Multiple observations are likely required to achieve reliable assessments.71 Regular feedback is important to improve performance,72,73 and learners appreciate receiving frequent feedback.6,21 Some experts recommend that more feedback is necessary for the current generation of learners.61 It is important to note, however, that many learners may value quality over quantity in feedback.8
Constructive feedback is important and can lead to motivational learning and enhanced future performance.74
Western Journal of Emergency Medicine 480 Volume 24, NO.3: May 2023
Natesan et al.
Table 1. Oxford Centre for Evidence-Based Medicine Levels of Evidence.42
Table 2. Oxford Centre for Evidence-Based Medicine Grades of Recommendation.42
While some learners may value constructive feedback over reinforcing or encouraging feedback, both have been shown to be valuable.10,18,29,30,75–78 It may not be necessary or helpful to include both constructive and reinforcing feedback during the same conversation.79 Giving constructive feedback may be particularly challenging due to fear of retaliation (especially in systems where learner feedback is tied to summative evaluations, linked to author, pay or promotion).80,81 However, limited literature suggests that the fear of retaliation may be unwarranted.82,83 Other potential concerns surrounding constructive feedback include damaging rapport with learners or triggering an emotional response from trainees; however, these can be reduced by ensuring the feedback is clear, focused on actions or behaviors (as opposed to the individual), and supported by specific examples.2,84
As a step toward improved performance, incorporating co-creation of goals58,85–87 and the formation of learning or action plans into feedback can increase the benefit to trainees.1,6,12,17,21–23,60,78,87,88 Additionally, encouraging collaborative discussion and learner reflection during the feedback conversation may be beneficial.7,12,48,60,74,89 Faculty should be attentive and dedicated to providing feedback, as faculty effort and engagement have been shown to improve feedback.7,90
The setting in which feedback is given is also important.5,26 Feedback should be given in a non-threatening and supportive environment.15,17,25,29,48,74,91 It may be prudent to use different types of settings for different feedback activities.4 For example, constructive feedback may best be given in a one-on-one setting after a clinical encounter, whereas positive feedback on physical exams, procedural skills, or clinical decision-making may be more effective if given during or immediately after the patient encounter.4,92 The optimal method used to provide feedback is unknown, and strengths and weaknesses of various forms of feedback have been highlighted.19,90 Verbal feedback may be more helpful for engaging in collaborative discussion, but written feedback is more easily recognized and can serve as a reference for future reflection.19,90 It is important to note that inconsistencies exist between verbal and written feedback. An example is when learners receive positive laudatory feedback verbally, only to find disparaging or negative critiques in the written review. This inconsistency can lead to distrust and frustration among the learner and should be avoided.47
Sources of Feedback and Personnel Involved
The source of feedback and the individuals involved can also impact feedback quality.88,93 It is important that feedback be from a credible source.94 Learners consider feedback more valuable and credible when given by those they consider experts in that specific domain.8,21,94,95 However, the reliability of assessment may vary with assessor groups for different skills assessed; so, it can be valuable to deliberately align assessment and feedback areas with rater domains of expertise when possible.71 The relationship between the individuals
involved in the feedback discussion is also important. Having a good relationship based on mutual respect and trust can enhance the quality and accuracy of feedback.3,12,57,62,77,87,90,96–100
Training individuals on how to give feedback can also improve the quality and specificity of feedback delivered.32,48,56,91,101–107 Training can lead to improved comfort with providing feedback and increase the likelihood of the learner incorporating reflection and goal-setting into feedback discussions.108,109 This is important, as lack of training in those providing feedback has been highlighted as a barrier to giving meaningful feedback.20
Feedback may come from multiple sources, and prior literature has demonstrated that both learners and supervisors value multisource feedback (MSF) as described in Table 1.49,52,63,110–119 Limited literature supports that MSF may be more helpful for identifying strengths and weaknesses compared to standard assessment methods and may be more likely to result in behavior change.52,63 Multisource feedback may also be effective in distinguishing between high, intermediate, and low performance in learners.113 Additionally, data on the correlations of assessments between assessor groups is mixed, and different assessor groups may provide distinct feedback.63,71,110,120–128 Variations in assessments between assessor groups could suggest that assessments may be different but not necessarily less valuable, lending support to the importance of having multiple perspectives in feedback systems to provide learners with more comprehensive data about their skills.63,120,122 Moreover, learners may value feedback from various groups differently51; so, care should be taken to align assessor qualifications with the assessments they will be performing.
Barriers to MSF do exist and include lack of training in those providing feedback, time and resources required to gather MSF, and the ability of learners to incorporate this type of feedback.20,112,124,129 Multisource feedback can be gathered synchronously or asynchronously,121 but regardless of route, it should be timely and ideally incorporate multiple settings.20,63 The incorporation of learner self-assessment into feedback can also have a positive impact.17,22,23,128,130,131
Techniques and Tools for Providing Feedback
Currently, there is no consensus regarding the best methods for feedback and no formal endorsement by educational bodies of a single strategy.18 When providing feedback, it is important to use a variety of techniques and tools tailored to the individual learner and situation. We summarize several feedback techniques including direct observation, real-time feedback, self-assessment, multiple sources, and other specialized techniques in Table 3.
Each of these techniques has strengths and weaknesses. Direct observation has been shown to be highly valued and can increase clinical knowledge, skills, and attitudes; however, there is limited data to suggest a behavioral change.132
Strengths of direct observation include the emphasis on timely, learner-centered feedback.107 Challenges to direct
Volume 24, NO.3: May 2023 481 Western Journal of Emergency Medicine Natesan et al. Feedback in Medical Education: Evidence-based Guide to Best Practices from CORD
Feedback in Medical Education: Evidence-based Guide to Best Practices from CORD
Table 3. Feedback techniques.
Direct observation
Real-time feedback
Self-assessment
Evaluative models
Feedback techniques
Description Types
Real-time, one-on-one observation and feedback of a learner for both clinical and non-clinical skills, either in the clinical setting, simulation, or nonclinical environment
Getting feedback to the learner at the moment, whether verbal, written or using an app or virtual form
Objective Structured Clinical Examination (OSCE)95
Observed Structured Teaching Exercises (OSTE)115,119,144
Pearls & pitfalls
Formative and timely but time- and resource-intensive
Learner-centered
Specialized feedback techniques
Learners reflect on, diagnose, and critique their own progress; often informs learning goals to mark intended outcomes
Framework for assessing learners based on established categories such as competencies or entrustable professional activities
Various techniques for in-themoment feedback, sometimes combining acquiring clinical information along with giving feedback
Structured clinical observation
Beware of the “Hawthorne effect” shadowing
Online survey (eg, Google Forms, Qualtrics, SurveyMonkey)
EMR based68
One minute mentor145
Minute feedback system27,138
Johari window99,100
Reflective feedback conversation74
CanMEDS140
Evaluation and feedback for effective clinical teaching instrument (EFFECT) tool146
Entrustable professional activities (EPA)141,147
ACGME milestones18,148
Inviting co-workers to evaluate Physicians tool (INCEPT)124
Mini peer assessment tool (MiniPAT)
Team assessment of behavior (TAB)112
Emergency medicine humanism scale (EM-HS)121,122
Time intensive
Learner-centered, Improves quantity of feedback
May be challenging to give corrective feedback
Feedback can be focused on intended goals
Caution on only focusing on selfassessed topics, as self-assessment may not identify all learner needs
Focused feedback
Snapshot in time
Blurs line between assessment and feedback
Limits narrative feedback
Formative feedback
Through a survey with similar questions to different respondents (ie, groups of peers, coworkers, and residents)
Needs many encounters to be reliable
TAB is primarily a free-text tool
EM-HS MSF tool from nursing and faculty
Communication assessment tool (CAT)129
Relationship, Reaction, Content, Change (R2C2) model86,152,153
Ask-Tell-Ask154
One minute preceptor39,143
Summarize the history and physical, narrow differential, analyze options, probe, plan management, self-directed learning (SNAPPS)39,143
Feedback sandwich1,74
Often surface-level feedback only
Quick/efficient for a variety of learners
Built-in mechanism for feedback
Promotes learner accountability
Feedback sandwich falls short of a reflective conversation as recipients learn to ignore positive statements because they know a “but” is coming.
ACGME, Accreditation Council for Graduate Medical Education; CANMeds, Royal College of Physicians and Surgeons of Canada competency framework; EMR, electronic medical record.
Western Journal of Emergency Medicine 482 Volume 24, NO.3: May 2023
Natesan et al.
Description
Feedback techniques
Types
Setting, Probe, Inquire, Knowledge, Empathy, Summary (SPIKES)104
Professionalism & Procedural Skills, Reporter, Interpreter, Manager, Educator, Procedural skills (PRIMES)22,23
Pearls & pitfalls
Concise framework that allows gentle probing of the learner to commit, while then allowing timely, specific, actionable feedback to be given.
Process is facilitated with an iPad app called PRIMES with residents’ self-assessment and goal setting. The faculty then assesses the resident blindly. The app compares assessment with results visually highlighting areas of agreement and disagreement.
Creating an environment, observing/preparing for feedback, assembling the learner and providing feedback, check/followup afterwards (COACH)91
Can be applicable across a variety of medical disciplines and learning environments, simultaneously teaches both the giving and eliciting of feedback
Pendleton’s Model of Feedback74 Techniques must be learned
observation include resources required, competing time demands of faculty and learners, perceived loss of credibility with patients by learners, and the Hawthorne effect.46,132–135 These barriers may be overcome by creating a structured, longitudinal direct observation and feedback program.136 Realtime feedback is highly learner-centered, has been shown to improve the quantity of feedback given, and is generally well liked by users.137 However, it doesn’t necessarily improve feedback quality; studies have shown that less than 20% of the feedback given in real time is specific or corrective, often only focusing on positive and encouraging aspects of care.27,138 While learner self-assessment may not correlate well with external assessments,122,127,128 it can contribute positively to feedback discussions by encouraging reflection and establishing a shared understanding and mental model for feedback.17,22,23,74,85,128,130,131,139 Combining self-assessment with feedback can positively impact improvement behaviors.130,131 Importantly, while evaluative models for feedback have been shown to improve the number of feedback evaluations, they may not improve the quality of corrective feedback.140,141 Multisource feedback tools are generally well liked and have good efficacy for competencies such as inter-professional communication and professionalism; however, they may be limited in their ability to identify struggling learners.142 Overall these techniques are quick and efficient and can work for a wide variety of learners to provide formative feedback.143
Tools for Giving Feedback
Much like the variety of techniques for giving feedback, many tools have been developed to assist in providing feedback. Feedback tools have been demonstrated to increase the number
of feedback encounters and improve learner satisfaction with feedback.7,32,59,155–157 However, it is important to note that feedback tools are not a replacement for verbal feedback or preceptor experience.7,19 We provide a summary of physical and electronic feedback tools including feedback cards, minicards, field note tool, MSF tools, web-based platforms, apps, crowdsourcing, and video recording in Table 4.
Like the techniques described above, each tool has its own strengths and weaknesses. Feedback encounter cards have repeatedly been shown to increase the perceived number of feedback encounters and, typically, improve learner satisfaction of quality, amount, and timeliness of feedback.2,32,155,156,158 However, some studies have reported that feedback may not be specific enough.156,159 This challenge can be mitigated by pairing encounter cards with a curriculum for educators and learners regarding giving and receiving feedback.2,32 Mini-cards and the Mini-Clinical Examination Exercise can identify the struggling learner and provide formative assessments to support their growth.88,148,160–162 Both tools can be integrated into routine clinical work while providing reliable assessments if at least 6-8 such encounters are used.162 A limitation noted for these card-based observation tools is that they may be perceived as a one-way evaluation and less likely to result in a learner-driven action plan.148,161 As MSF has become more incorporated into feedback approaches, several tools have been developed and studied as listed in Table 3.112,121,122,124,129,142
With the increased availability of smartphones and portable devices, an array of new electronic-based feedback tools have been created and implemented with the hope of making the administration of feedback more convenient, accessible, and timely for educators and learners.18 Studies have shown that
Volume 24, NO.3: May 2023 483 Western Journal of Emergency Medicine Natesan et al. Feedback in Medical Education: Evidence-based Guide to Best Practices from CORD
Table 3. Continued.
Table 4. Feedback tools.
Physical
Name Description Examples
Feedback Cards32,155,156,158,159,173
Direct Observation Cards88,102,160–162
Field note tool174
This tool is typically handed out by the learner and often designed to identify areas the learner desires feedback on.
This tool uses direct observation and performance assessment with written narrative feedback.
This written tool with open-ended questions for both the learner and the assessor to facilitate a two-way discussion and real-time workplacebased assessment with the development of action plans.
Encounter cards, debrief cards, “Prescription pads” feedback cards, pocket feedback
Mini Direct Observation (Mini-Card)
Mini Clinical Evaluation Exercise (MiniCEX)
Field note tool
E-tools
Multisource feedback tools112,121,122,124,129,142
Web-based27,138,145,163–165,175
Techniques aimed at gathering feedback from various assessors to give a more comprehensive view of the learner.
Designed to take a minute to complete in order to facilitate same-day, timely responses in brief narrative comments, these systems were felt to be easy to institute and feasible approach to assessing students, particularly regarding professionalism behavior. These online survey platforms can increase the amount and timeliness of feedback. However, there is a need to emphasize data consolidation and distribution with these tools to ensure that feedback is distributed in a timely manner.
INCEPT, Mini-PAT, TAB, EM-HS, CAT
Facebook Dashboard, QuickNotes, TIPreport, One Minute Mentor/ Minute Feedback System, and online surveys such as Google Forms and SurveyMonkey
App-based18,70,168–170
This is a feedback tool accessed through a mobile application to allow ease of use. These apps were shown to help collect useful data and provide an increased amount of quality feedback. They also were found to have benefits of accessibility, low cost, and ability to trend resident progression.
Mobile Medical Milestones Application (M3App), Healthcare Supervision Logbook App, System for improving and measuring procedural learning (SIMPL), Resident report card (RRC), MyTIPReport
Online Social Media Platforms18,171
Use of social media platforms to allow discussion and feedback through the internet to obtain feedback through crowdsourcing. Online social media platforms can focus on in-the-moment discussion points and provide easily digestible feedback from a diverse group of evaluators.
Twitter, Instagram, Facebook
Video Recording43,103,133,172
This form can play a role as a feedback tool in itself and as an adjunct with other feedback tools such as checklists. By recording learners and educators in various situations evaluators can provide specific guidance afterward.
Pre-recorded clinical, feedback sessions, educational, simulation sessions, OSTEs, OSCEs, etc
INCEPT, Inviting Co-workers to Evaluate Physicians Tool; Mini-PAT, Mini Peer Assessment Tool; TAB, Team Asessment of Behavior; EM-HS, Emergency Medicine Humanism Scale; CAT, Communication Assessment Tool; OSTE, Observed Structured Teaching Exercises; OSCE, Objective Structured Clinical Examination.
Western Journal of Emergency Medicine 484 Volume 24, NO.3: May 2023 Feedback in Medical Education: Evidence-based Guide to Best Practices from CORD Natesan et al.
these web-based tools can be beneficial for improving faculty engagement in and frequency of their feedback.11,163,164 The timely nature of this feedback also leads to increased satisfaction from learners.164 However, these platforms can be limited by faculty comfort with, and knowledge of, technology.165 Additionally, specific and corrective feedback may be challenging.27,138
It is important to consider data consolidation and distribution with these tools to ensure that feedback is distributed in a timely manner.137,166 To improve the accessibility of online feedback tools, several platforms have used quick response (QR) codes.163,167 The use of QR codes to access online feedback forms was found to be user-friendly and resulted in faster completion than paper and online web-based tools not associated with a QR code.167 Various apps have been created, which have led to an increase in the quality of feedback.18,70,168–170 Additional strengths include accessibility, low cost, and ability to trend resident progression.18 However, much like web-based platforms, app-based platforms can be limited by faculty and resident engagement.18,170 When instituting any app-based evaluation tool, it is important to pair it with training on the app and changes to feedback culture, such as regular encouragement, incentivization, physician champions, or regular reminders.18,168,170
Using online social media platforms (eg, Twitter messaging) is another tool to increase the volume and timeliness of feedback; however, effectiveness may be limited.18,171 Videoassisted feedback can be a valuable tool for feedback similar to direct observation.133,172 However, much like other forms of direct observation, video recording may not represent true, real-world encounters as learners may act differently due to the Hawthorne effect. Additionally, video recording can cause anxiety in trainees.133
Inviting Co-workers to Evaluate Physicians Tool (INCEPT); Mini Peer Assessment Tool (Mini-PAT); Team Assessment of Behavior (TAB); Emergency Medicine Humanism Scale (EM-HS); Communication Assessment Tool (CAT); Observed Structured Teaching Exercises (OSTE), or an Objective Structured Clinical Examination (OSCE) are other useful evaluation tools.
Receiving Feedback
Traditional approaches place learners in the role of passively receiving feedback,79,82,176,177 which have been criticized for being too centered on the actions of the instructor. More modern models shift to include the learner as an active participant in soliciting and responding to feedback.4,13,153
Soliciting Feedback
A crucial initial step to engaging in effective feedback is the act of soliciting feedback that opens the individual to the critiquing process.55,178 The ability to engage in feedback-seeking behaviors is dependent on four factors: the purpose and quality of the feedback; the learner’s emotional response to feedback; the learner-evaluator relationship; and the workplace culture.4,13,50,176,179,180 While the environment is outside our control, appropriately prepping learners to take contextual factors into account and shifting the focus to environmentally appropriate feedback models may be particularly helpful.181,182 One common example is the implementation of end-of-shift feedback evaluations. While these have not been identified by faculty as providing a higher quality of feedback, their systematic and reliable delivery results in higher resident satisfaction with the feedback.32
Accepting Feedback
Despite the best intentions of the feedback giver, feedback receptivity is never assured. Literature demonstrates that faculty and learners even disagree on their perceptions of how much feedback is being given.1,16,55 Nevertheless, learner perception significantly impacts feedback acceptance and integration.130,180,183 Different experts have categorized such factors in different ways.1,50,57,184 One of the more usable classifications includes categorization of personal (ie, resilience, humility), relational (ie. the strength of supervisory relationship, power differentials), and contextual (ie, culture) factors.57
Personal Factors
Best Practice Recommendations:
1. Feedback should be clear, specific, timely, and actionable. (Level 1a, Grade B)
2. Feedback should be based on observed behaviors. (Level 3b, Grade B)
3. Both corrective and reinforcing feedback should be provided to learners, although not necessarily at the same time. (Level 4, Grade C)
4. Feedback tools are recommended to increase learner satisfaction and volume of feedback; however, the use of tools must be combined with faculty development and a culture of feedback to improve the quality of feedback. (Level 3b, Grade C)
5. Feedback should incorporate learner self-assessment. (Level 3b, Grade C)
Much of feedback receptivity depends on the learner’s frame of reference. Possessing a growth mindset and employing routine self-reflection is key.62,89,96,100,182,183,185–187 Learners often approach feedback situations as a performance, probing the situation to see what is expected of them and then acting in a way to better shape their reputation and evaluations.1,13,16,184,188 Those who have blind spots regarding their weaknesses may be resistant to feedback that challenges their existing self-perception.130,185–191 Failure to internalize feedback happens when a mismatch in external and internally generated assessment occurs. For instance, EM residents consistently assign themselves higher milestone competency ratings than their evaluating attendings.189
When feedback is perceived as an attack on personal identity, feedback internalization is effectively
Volume 24, NO.3: May 2023 485 Western Journal of Emergency Medicine Natesan et al. Feedback in Medical Education: Evidence-based Guide to Best Practices from CORD
Feedback in Medical Education: Evidence-based Guide to Best Practices from CORD Natesan
hindered. Thus, learners should perceive feedback as opportunities for improvement, rather than statements on character.1,134,192 Evidence suggests that learners educated on feedback have shown comfort in giving and receiving feedback.105 Melding self-generated learning goals with faculty-provided observations closes the feedback loop and produces more improved, usable, and well-received feedback aimed at mastering current skills and setting goals for future accomplishments.12,22,130 To bridge the gap between reception of the feedback to internalizing it, multiple experts have outlined various practical tips for learners to use feedback for performance improvement.190,191,193–200 We distilled the consistent themes among our recommendations below.
Relational Factors
Feedback receptivity is significantly impacted by relational factors such as the strength of the supervisory relationship and power differentials. Regardless of the experience level of the assessor, learners consistently recognize feedback as valid when coming from someone they trust and respect, find credible,1,182,192 and have sought out rather than been assigned,181,197 such as from role models.198,199 Mutual respect, establishing shared priorities, and the strength of the educational alliance (defined as the learner’s belief of shared goals, activities, and bonds)200 facilitated better feedback receptivity.57 Interpersonal skills also affect the relationship and receptivity. Power dynamics and fear of the effect of corrective feedback are barriers to feedback integration.57 Learners value feedback when given in a caring, nonjudgmental manner31,62,99 from educators who are friendly and approachable.201
Contextual Factors
Environmental and cultural considerations affect the receptivity of feedback. The tension between assessment and feedback, specifically the fear of consequences, can lead to learner development of a fixed mindset, limiting growth opportunities. 57,96 For professionalism issues, feedback should be given one on one.1,20 In busy learning environments, learner-centered approaches grounded in self-directed learning theories (eg, Learner-Centered Approach to Raise Efficiency [L-CARE)] in Clinical Teaching) have been proposed to facilitate more efficient learning. 202 Ultimately, various studies demonstrated benefit and/or learner preference for standardized,139,203 structured, 150,203 multisource, 150 and longitudinal1,105,204,205 feedback processes.
FEEDBACK CULTURE
Feedback culture is defined as written or verbal comments regarding medical knowledge, performance, technique, or patient care within the pedagogical approaches that are routine within a profession.206,207 The learning culture and
Best Practice Recommendations:
1. Encourage learners to take an active role in the feedback process. (Level 2b, Grade B)
2. Take the work environment into account when creating appropriate feedback systems that are contextually appropriate as a way to improve learner perception of feedback. (Level 2a, Grade B)
3. Provide opportunities for learners to build longitudinal trusting relationships in order to promote a strong educational alliance and a growth mindset and to facilitate feedback reception. (Level 4, Grade C)
4. Address the tension between assessment and feedback as fear of consequences can predispose a learner to have a fixed mindset, thus limiting learner growth. (Level 4, Grade C)
5. Develop and maintain standardized, structured, multisource, and longitudinal feedback processes. (Level 3a, Grade B)
type of clinical environment influences learners’ feedback behaviors such as recognizing, seeking, and implementing feedback, namely whether this process is encouraged or not.99,100 The ED is particularly challenging due to the nature of the work environment, including time constraints, frequent interruptions, and patient acuity, among other factors.29,208,209
Implementation
Institutions should provide and encourage educational opportunities to all individuals involved in feedback interactions including learners and educators. This will allow a culture of growth emphasizing a bidirectional feedback approach1,62,100 with a shift from performanceoriented assessments to learner-oriented feedback.56 One method is to emphasize the concept of lifelong learning and normalize the need to identify strengths and weaknesses as a way to grow. Training on giving feedback upward and receiving feedback as an educator can help provide the framework for effective bidirectional feedback. 1,16,99,181,194,200 Learners need an environment where vulnerability is acceptable and assessment focuses on a set of shared goals. 14,47 Other strategies include establishing expectations for both educators and learners, promoting specific tasks for all involved, and providing professional development sessions. 57,210 For establishing longitudinal relationships, providing protected faculty time for observational assessments and using standardized feedback tools are beneficial.97,136,207 Furthermore, institutions should encourage a culture of growth. Learners develop a fixed mindset when they perceive performance is linked to assessment, rather than a growth mindset when the relationship is not tied to assessments.96
An interdisciplinary, multimodal approach to feedback through MSF can provide additional insight regarding
Western Journal of Emergency Medicine 486 Volume 24, NO.3: May 2023
al.
et
communication, professionalism, and team dynamics and broaden the scope of the feedback received by the learner.18,20,121–123,203,211 Using non-physician medical education specialists to observe learners in the clinical setting may be a useful way to provide tangible feedback on communication, task-switching, professionalism, accountability, and team management skills.50
Barriers to Successful Implementation
Successful implementation of an optimal feedback culture requires a firm understanding of the potential barriers. Grade inflation, discomfort in providing negative feedback, concern with preserving healthy working relationships,2,32,84 time constraints, and personal deficiencies in feedback delivery each present unique challenges.67,84 Administrative support and the encouragement of the importance of feedback are also important.67 While feedback tools may pose a barrier, choosing a user-friendly tool that is of appropriate length and provides sufficient detail with required narrative comments is key.8,9,24
Although limited literature suggests this may be unwarranted,82 educators often avoid corrective feedback due to fear of retaliation (especially in systems where learner evaluations are linked to pay or promotion).80,81 Transparency and focus on the importance of corrective feedback as a learning tool12 can prevent reluctance to provide negative feedback.12,80 Finally, a culture of “niceness” can make the learning environment overtly positive, which can hinder the delivery of honest feedback and the creation of a culture of constructive feedback.12,99,100 Being “nice” can be construed as focusing on the positive with a priority on minimizing any negative feelings in the other person, while being “kind” can be construed as focusing on what is best for the learner overall — even if it means creating negative feelings.
Special Considerations
Implicit bias, which is the unconscious attitudes we have toward people or associated stereotypes, impacts both feedback provided to learners and the perception or receptibility of feedback from faculty.47 To minimize this potential bias, assessments should be performed by multiple assessors in multiple different settings.47,63,210 Furthermore, institutions should implement training to identify areas where biases exist, while working to alleviate these biases with full transparency.47 Gender bias may lead to different distributions of the frequency and type of feedback. One study found female preceptors completed more feedback forms and provided more corrective feedback to male learners, whereas male preceptors used more communal language and less agentic language with female learners.212 Additionally, female learners had more discordant feedback, especially regarding the balance of autonomy and feedback receptivity, than their male counterparts.213 Finally, in a study by Stroud, female faculty were found to be perceived as less credible when delivering feedback.95
Like racial, cultural, and gender bias, generational gaps can also affect meaningful feedback. Different generations have different patterns of learning. For example, the millennial generation is more engaged in technology and collaborative learning, while preferring clear objectives and timely feedback.28,61 Additionally, feedback should be provided to all learners, not just low performers. High performers may exhibit the “halo effect,” which can result in them receiving less constructive feedback.1 Learner shame responses can be triggered by repeated humiliation experienced in receiving feedback from facilitators. Providing feedback that is focused on behaviors, providing support that normalizes errors in the learning process, and guiding learners through reflection can decrease these learner responses.60
Best Practice Recommendations:
1. Maximize the impact of feedback by minimizing implicit bias through providing feedback from multiple different assessors in multiple different settings. (Level 4, Grade C)
2. Encourage a culture of growth and transparency, focusing on corrective feedback as a learning tool. (Level 4, Grade C)
3. Establish expectations for both educators and learners, promote specific tasks for all involved, implement processes to encourage bi-directional feedback, and provide development sessions for professional growth. (Level 4, Grade C)
4. Shift emphasis from performance-oriented assessment to learner-oriented feedback. (Level 2b, Grade B)
LIMITATIONS
Although we performed a comprehensive search guided by a medical librarian in conjunction with a bibliographic review and expert consultation to augment content when needed, we used a single search engine (MEDLINE), and it is possible that we may have missed some pertinent articles. In instances where evidence in the form of high-quality data was limited or lacking, we relied upon expert opinion and group consensus for the best practice recommendations. The literature specific to feedback for the field of EM and within graduate medical education is limited. To supplement, we included relevant articles from other medical specialties and health-related professions as we believe that EM, as a specialty, can learn from other colleagues across many disciplines. Finally, in areas where evidence was not available, we used the consensus from the expertise of our authorship group. While our author group possesses experience in research and scholarship in both feedback and medical education, there is a potential for bias to be introduced during this process. Therefore, we also sought peer review from the
Volume 24, NO.3: May 2023 487 Western Journal of Emergency Medicine Natesan et al. Feedback in Medical Education: Evidence-based Guide to Best Practices from CORD
Feedback in Medical Education: Evidence-based Guide to Best Practices from CORD
CORD Best Practices Subcommittee and posted it online for open review feedback by the CORD community.
CONCLUSION
Feedback is integral to professional development. This paper provides readers with guidance on the use of feedback in medical education, with a focus on instructor strategies for giving feedback, learner strategies for receiving feedback, and suggestions for fostering a culture of feedback.
ACKNOWLEDGMENT
The authors would like to thank the Council of Residency Directors in Emergency Medicine for its support of our committee and this project. The authors also would like to acknowledge Samantha Kaplan, PhD, Medical Librarian, Duke University, Durham, NC, for her contributions.
CORD Best Practice Committee 2020-2021
Michael Gottlieb, MD – Co-Chair Rush University Medical Center
Sreeja Natesan, MD – Co-Chair Duke University
Brian Barbas, MD Loyola University
Jennie Buchanan, MD Denver Health Medical Center
Richard Byyny, MD Denver Health Medical Center
Guy Carmelli, MD University of Massachusetts Medical School
Molly Estes, MD Loma Linda University
Katja Goldflam, MD Yale University
Andrew Grock, MD University of California - Los Angeles
Jaime Jordan, MD University of California - Los Angeles
Deena Khamees, MD University of Michigan
Andrew King, MD The Ohio State University
Krystin Miller, MD The Ohio State University
Melissa Parsons, MD University of Florida - Jacksonville
Alexander Sheng, MD Boston Medical Center
Brian Wood, MD St. Joseph’s Medical Center
Saadia Akhtar, MD Mount Sinai
Address for Correspondence: Sreeja Natesan, MD, Duke University, Department of Emergency Medicine, PO Box 3096, 1320 Erwin Road, Durham NC 27710. Email: sreeja.natesan@duke.edu.
Conflicts of Interest: By the WestJEM article submission agreement, all authors are required to disclose all affiliations, funding sources and financial or management relationships that could be perceived as potential sources of bias. No author has professional or financial relationships with any companies that are relevant to this study. There are no conflicts of interest or sources of funding to declare.
Copyright: © 2023 Natesan et al. This is an open access article distributed in accordance with the terms of the Creative Commons Attribution (CC BY 4.0) License. See: http://creativecommons.org/ licenses/by/4.0/
REFERENCES
1. Buckley C, Natesan S, Breslin A, et al. Finessing feedback: recommendations for effective feedback in the emergency department. Ann Emerg Med. 2020;75(3):445-51.
2. Yarris LM, Linden JA, Gene Hern H, et al. Attending and resident satisfaction with feedback in the emergency department. Acad Emerg Med. 2009;16 Suppl 2:S76-81.
3. Dudek NL, Dojeiji S, Day K, et al. Feedback to supervisors: Is anonymity really so important? Acad Med. 2016;91(9):1305-12.
4. Gonzalo JD, Heist BS, Duffy BL, et al. Content and timing of feedback and reflection: a multi-center qualitative study of experienced bedside teachers. BMC Med Educ. 2014;14:212.
5. Iskander M. Offering effective feedback to trainees. Med Teach 2015;37(1):92-3.
6. Kaul P, Gong J, Guiton G. Effective feedback strategies for teaching in pediatric and adolescent gynecology. J Pediatr Adolesc Gynecol 2014;27(4):188-93.
7. Ritchie KC, Sjaus A, Munro A, et al. An interpretive phenomenological analysis of formative feedback in anesthesia training: the residents’ perspective. BMC Med Educ. 2020;20(1):493.
8. Bleasel J, Burgess A, Weeks R, et al. Feedback using an ePortfolio for medicine long cases: quality not quantity. BMC Med Educ
Western Journal of Emergency Medicine 488 Volume 24, NO.3: May 2023
Natesan et al.
Natesan et al.
2016;16(1):278.
Feedback in Medical Education: Evidence-based Guide to Best Practices from CORD
9. Branfield Day L, Miles A, Ginsburg S, et al. Resident perceptions of assessment and feedback in competency-based medical education: a focus group study of one internal medicine residency program. Acad Med. 2020;95(11):1712-7.
10. Carr S. The Foundation Programme assessment tools: an opportunity to enhance feedback to trainees? Postgrad Med J 2006;82(971):576-9.
11. Connolly KA, Azouz SM, Smith AA. Feedback in plastic and reconstructive surgery education: past, present, and future. J Craniofac Surg. 2015;26(8):2261-3
12. Davila-Cervantes A, Foulds JL, Gomaa NA, et al. Experiences of faculty members giving corrective feedback to medical trainees in a clinical setting. J Contin Educ Health Prof. 2021;41(1):24-30.
13. Delva D, Sargeant J, Miller S, et al. Encouraging residents to seek feedback. Med Teach. 2013;35(12):e1625-31.
14. Ende J. Feedback in clinical medical education. JAMA 1983;250(6):777-81.
15. Hewson MG, Little ML. Giving feedback in medical education. J Gen Intern Med. 1998;13(2):111-6.
16. Natesan S, Stehman C, Shaw R, et al. Curated collections for educators: five key papers about receiving feedback in medical education. Cureus. 2019;11(9):e5728.
17. Norcini J, Burch V. Workplace-based assessment as an educational tool: AMEE Guide No. 31. Med Teach. 2007;29(9):855-71.
18. Perkins SQ, Dabaja A, Atiemo H. Best approaches to evaluation and feedback in post-graduate medical education. Curr Urol Rep 2020;21(10):36.
19. Tomiak A, Braund H, Egan R, et al. Exploring how the new entrustable professional activity assessment tools affect the quality of feedback given to medical oncology residents. J Cancer Educ 2020;35(1):165-77.
20. Campbell S, Goltz HH, Njue S, et al. Exploring the reality of using patient experience data to provide resident feedback: a qualitative study of attending physician perspectives. Perm J. 2016;20(3):15-154.
21. Ivers NM, Grimshaw JM, Jamtvedt G, et al. Growing literature, stagnant science? Systematic review, meta-regression and cumulative analysis of audit and feedback interventions in health care. J Gen Intern Med. 2014;29(11):1534-41.
22. Moroz A, Horlick M, Mandalaywala N, et al. Faculty feedback that begins with resident self-assessment: motivation is the key to success. Med Educ. 2018;52(3):314-23.
23. Moroz A, King A, Kim B, et al. Constructing a shared mental model for feedback conversations: faculty workshop using video vignettes developed by residents. MedEdPORTAL. 2019;15:10821.
24. Moss HA, Derman PB, Clement RC. Medical student perspective: working toward specific and actionable clinical clerkship feedback. Med Teach. 2012;34(8):665-7.
25. Orlander JD, Fincke BG. Soliciting feedback: on becoming an effective clinical teacher. J Gen Intern Med. 1994;9(6):334-5.
26. Vickery AW, Lake FR. Teaching on the run tips 10: giving feedback. Med J Aust. 2005;183(5):267-8.
27. Shaughness G, Georgoff PE, Sandhu G, et al. Assessment of clinical feedback given to medical students via an electronic feedback system. J Surg Res. 2017;218:174-9.
28. Schwartz AC, McDonald WM, Vahabzadeh AB, et al. Keeping up with changing times in education: fostering lifelong learning of millennial learners. Focus (Am Psychiatr Publ). 2018;16(1):74-9.
29. Richardson BK. Feedback. Acad Emerg Med. 2004;11(12):e1-5.
30. Dickinson KJ, Bass BL, Pei KY. What embodies an effective surgical educator? A grounded theory analysis of resident opinion. Surgery 2020;168(4):730-6.
31. Bing-You R, Hayes V, Varaklis K, et al. Feedback for learners in medical education: What is known? A scoping review. Acad Med 2017;92(9):1346-54.
32. Yarris LM, Fu R, LaMantia J, et al. Effect of an educational intervention on faculty and resident satisfaction with real-time feedback in the emergency department. Acad Emerg Med 2011;18(5):504-12.
33. Chathampally Y, Cooper B, Wood DB, et al. Evolving from morbidity and mortality to a case-based error reduction conference: Evidencebased Best Practices from the Council of Emergency Medicine Residency Directors. West J Emerg Med. 2020;21(6):231-41.
34. Wood DB, Jordan J, Cooney R, et al. Conference didactic planning and structure: an Evidence-based Guide to Best Practices from the Council of Emergency Medicine Residency Directors. West J Emerg Med. 2020;21(4):999-1007.
35. Parsons M, Bailitz J, Chung AS, et al. Evidence-based interventions that promote resident wellness from the Council of Emergency Residency Directors. West J Emerg Med. 2020;21(2):412-22.
36. Parsons M, Caldwell M, Alvarez A, et al. Physician pipeline and pathway programs: an evidence-based guide to best practices for diversity, equity, and inclusion from the Council of Residency Directors in Emergency Medicine. West J Emerg Med 2022;23(4):514-24.
37. Davenport D, Alvarez A, Natesan S, et al. Faculty recruitment, retention, and representation in leadership: An Evidence-Based Guide to Best Practices for Diversity, Equity, and Inclusion from the Council of Residency Directors in Emergency Medicine. West J Emerg Med. 2022;23(1):62-71.
38. Gallegos M, Landry A, Alvarez A, et al. Holistic Review, Mitigating Bias, and Other Strategies in Residency Recruitment for Diversity, Equity, and Inclusion: An Evidence-based Guide to Best Practices from the Council of Residency Directors in Emergency Medicine. West J Emerg Med. 2022;23(3):345-52.
39. Natesan S, Bailitz J, King A, et al. Clinical teaching: An Evidencebased Guide to Best Practices from the Council of Emergency Medicine Residency Directors. West J Emerg Med. 2020;21(4):985-98.
40. Estes M, Gopal P, Siegelman JN, et al. Individualized Interactive Instruction: a Guide to Best Practices from the Council of Emergency Medicine Residency Directors. West J Emerg Med. 2019;20(2):363-8.
41. Gottlieb M, King A, Byyny R, et al. Journal club in residency education: an Evidence-based Guide to Best Practices from the Council of Emergency Medicine Residency Directors. West J Emerg
Volume 24, NO.3: May 2023 489 Western Journal of Emergency Medicine
Feedback in Medical Education: Evidence-based Guide to Best Practices from CORD
Med. 2018;19(4):746-55.
42. Phillips R, Ball C, Sackett D. Oxford Centre for Evidence-Based Medicine: Levels of Evidence. CEBM: Centre for EvidenceBased Medicine. 2021. Available at: https://www.cebm.ox.ac.uk/ resources/levels-of-evidence/ocebm-levels-of-evidence. Accessed October 1, 2021.
43. Kogan JR, Conforti LN, Bernabeo EC, et al. Faculty staff perceptions of feedback to residents after direct observation of clinical skills. Med Educ. 2012;46(2):201-15.
44. Roze des Ordons A, Cheng A, Gaudet J, et al. Adapting feedback to individual residents: an examination of preceptor challenges and approaches. J Grad Med Educ. 2018;10(2):168-75.
45. Desveaux L, Ivers NM, Devotta K, et al. Unpacking the intention to action gap: a qualitative study understanding how physicians engage with audit and feedback. Implement Sci. 2021;16(1):19.
46. Cheung WJ, Patey AM, Frank JR, et al. Barriers and enablers to direct observation of trainees’ clinical performance: a qualitative study using the theoretical domains framework. Acad Med. 2019;94(1):101-14.
47. Dolan BM, Arnold J, Green MM. Establishing trust when assessing learners: barriers and opportunities. Acad Med. 2019;94(12):1851-3.
48. Kritek PA. Strategies for effective feedback. Ann Am Thorac Soc 2015;12(4):557-60.
49. Moreau KA, Eady K, Jabbour M. Exploring residents’ reactions to and use of parent feedback in a pediatric emergency department: a grounded theory study. Med Teach. 2019;41(2):207-14.
50. Waterbrook AL, Spear Ellinwood KC, Pritchard TG, et al. Shadowing emergency medicine residents by medical education specialists to provide feedback on non-medical knowledge-based ACGME subcompetencies. Adv Med Educ Pract. 2018;9:307-15.
51. Van Hell EA, Kuks JBM, Raat ANJ, et al. Instructiveness of feedback during clerkships: influence of supervisor, observation and student initiative. Med Teach. 2009;31(1):45-50.
52. Snydman L, Chandler D, Rencic J, et al. Peer observation and feedback of resident teaching. Clin Teach. 2013;10(1):9-14.
53. Smith J, Jacobs E, Li Z, et al. Successful implementation of a direct observation program in an ambulatory block rotation. J Grad Med Educ. 2017;9(1):113-7.
54. Brauch RA, Goliath C, Patterson L, et al. A qualitative study of improving preceptor feedback delivery on professionalism to postgraduate year 1 residents through education, observation, and reflection. Ochsner J. 2013;13(3):322-6.
55. Trawicki MC, Zuegge KL, Volz LM, et al. An intervention to improve medical student perception of observation and feedback during an anesthesiology clerkship. Ochsner J. 2018;18(2):159-63.
56. Balmer DF, Tenney-Soeiro R, Mejia E, et al. Positive change in feedback perceptions and behavior: a 10-year follow-up study. Pediatrics. 2018;141(1).
57. Denny B, Brown J, Kirby C, et al. “I’m never going to change unless someone tells me I need to”: fostering feedback dialogue between general practice supervisors and registrars. Aust J Prim Health 2019;25(4):374-9.
58. Mehta F, Brown J, Shaw NJ. Do trainees value feedback in case-
based discussion assessments? Med Teach. 2013;35(5):e1166-72.
59. Peccoralo L, Karani R, Coplit L, et al. Pocket card and dedicated feedback session to improve feedback to ward residents: a randomized trial. J Hosp Med. 2012;7(1):35-40.
60. Bynum WE, Goodie JL. Shame, guilt, and the medical learner: ignored connections and why we should care. Med Educ 2014;48(11):1045-54.
61. Moreno-Walton L, Brunett P, Akhtar S, et al. Teaching across the generation gap: a consensus from the Council of Emergency Medicine Residency Directors 2009 academic assembly. Acad Emerg Med. 2009;16 Suppl 2:S19-24.
62. Ramani S, Könings KD, Ginsburg S, et al. Relationships as the backbone of feedback: exploring preceptor and resident perceptions of their behaviors during feedback conversations. Acad Med 2020;95(7):1073-81.
63. Byrd A, Iheagwara K, McMahon P, et al. Using multisource feedback to assess resident communication skills: adding a new dimension to milestone data. Ochsner J. 2020;20(3):255-60.
64. Chaou C-H, Chang Y-C, Yu S-R, et al. Clinical learning in the context of uncertainty: a multi-center survey of emergency department residents’ and attending physicians’ perceptions of clinical feedback. BMC Med Educ. 2019;19(1):174.
65. Reddy ST, Zegarek MH, Fromme HB, et al. Barriers and facilitators to effective feedback: A qualitative analysis of data from multispecialty resident focus groups. J Grad Med Educ. 2015;7(2):214-9.
66. Chaou C-H, Monrouxe LV, Chang L-C, et al. Challenges of feedback provision in the workplace: A qualitative study of emergency medicine residents and teachers. Med Teach. 2017;39(11):1145-53.
67. Zehra T, Tariq M, Ali SK, et al. Challenges of providing timely feedback to residents: Faculty perspectives. JPMA The Journal of the Pakistan Medical Association. 2015;65(10):1069-74.
68. Kim JG, Morris CG, Heidrich FE. A tool to assess family medicine residents’ patient encounters using secure messaging. J Grad Med Educ. 2015;7(4):649-53.
69. Kim D, Spellberg B. Does real-time feedback to residents with or without attendings improve medical documentation? Hosp Pract (Minneap). 2014;42(3):123-30.
70. Ahle SL, Eskender M, Schuller M, et al. The Quality of Operative Performance Narrative Feedback: A Retrospective Data Comparison Between End of Rotation Evaluations and Workplace-based Assessments. Ann Surg. 2022;275(3):617-20.
71. Moonen-van Loon JMW, Overeem K, Govaerts MJB, et al. The reliability of multisource feedback in competency-based assessment programs: the effects of multiple occasions and assessor groups. Acad Med. 2015;90(8):1093-9.
72. Piquette D, Moulton C-A, LeBlanc VR. Model of interactive clinical supervision in acute care environments. Balancing patient care and teaching. Ann Am Thorac Soc. 2015;12(4):498-504.
73. Tanaka P, Bereknyei Merrell S, Walker K, et al. Implementation of a needs-based, online feedback tool for anesthesia residents with subsequent mapping of the feedback to the ACGME Milestones. Anesth Analg. 2017;124(2):627-35.
Western Journal of Emergency Medicine 490 Volume 24, NO.3: May 2023
Natesan et al.
74. Sarkany D, Deitte L. Providing feedback: practical skills and strategies. Acad Radiol. 2017;24(6):740-6.
75. Morgan S. Supervising the highly performing general practice registrar. Clin Teach. 2014;11(1):53-7.
76. Carr BM, O’Neil A, Lohse C, et al. Bridging the gap to effective feedback in residency training: perceptions of trainees and teachers. BMC Med Educ. 2018;18(1):225.
77. Findlay N. General practitioner registrars’ experiences of multisource feedback: a qualitative study. Educ Prim Care. 2012;23(5):323-9.
78. Gauthier S, Cavalcanti R, Goguen J, et al. Deliberate practice as a framework for evaluating feedback in residency training. Med Teach 2015;37(6):551-7.
79. Molloy E, Ajjawi R, Bearman M, et al. Challenging feedback myths: values, learner involvement and promoting effects beyond the immediate task. Med Educ. 2020;54(1):33-9.
80. McQueen SA, Petrisor B, Bhandari M, et al. Examining the barriers to meaningful assessment and feedback in medical training. Am J Surg 2016;211(2):464-75.
81. Cousar M, Huang J, Sebro R, et al. Too scared to teach? The unintended impact of 360-degree feedback on resident education. Curr Probl Diagn Radiol. 2020;49(4):239-42.
82. Baker K, Haydar B, Mankad S. A feedback and evaluation system that provokes minimal retaliation by trainees. Anesthesiology 2017;126(2):327-37.
83. Baker K. Clinical teaching improves with resident evaluation and feedback. Anesthesiology. 2010;113(3):693-703.
84. Sabey A, Harris M. “It’s the conversation they’ll learn from”: improving assessments for GP specialist trainees in hospital posts. Educ Prim Care. 2012;23(4):263-9.
85. Farrell L, Bourgeois-Law G, Ajjawi R, et al. An autoethnographic exploration of the use of goal oriented feedback to enhance brief clinical teaching encounters. Adv Health Sci Educ Theory Pract 2017;22(1):91-104.
86. Sargeant J, Lockyer J, Mann K, et al. Facilitated reflective performance feedback: developing an evidence- and theorybased model that builds relationship, explores reactions and content, and coaches for performance change (R2C2). Acad Med 2015;90(12):1698-706.
87. Armson H, Lockyer JM, Zetkulic M, et al. Identifying coaching skills to improve feedback use in postgraduate medical education. J Pak Med Assoc. 2019;53(5):477-93.
88. Pelgrim EAM, Kramer AWM, Mokkink HGA, et al. The process of feedback in workplace-based assessment: organisation, delivery, continuity. Med Educ. 2012;46(6):604-12.
89. Pelgrim EAM, Kramer AWM, Mokkink HGA, et al. Reflection as a component of formative assessment appears to be instrumental in promoting the use of feedback; an observational study. Med Teach 2013;35(9):772-8.
90. Bowen JL, Boscardin CK, Chiovaro J, et al. A view from the sender side of feedback: anticipated receptivity to clinical feedback when changing prior physicians’ clinical decisions-a mixed methods study. Adv Health Sci Educ Theory Pract. 2020;25(2):263-82.
91. Brown LE, Rangachari D, Melia M. Beyond the sandwich: from feedback to clinical coaching for residents as teachers. MedEdPORTAL. 2017;13:10627.
92. McKenzie S, Burgess A, Mellis C. Interns reflect: the effect of formative assessment with feedback during pre-internship. Adv Med Educ Pract. 2017;8:51-6.
93. Pelgrim EAM, Kramer AWM, Mokkink HGA, et al. Quality of written narrative feedback and reflection in a modified mini-clinical evaluation exercise: an observational study. BMC Med Educ. 2012;12:97.
94. Valentine N, Schuwirth L. Identifying the narrative used by educators in articulating judgement of performance. Perspect Med Educ 2019;8(2):83-9.
95. Stroud L, Sibbald M, Richardson D, et al. Feedback credibility in a formative postgraduate objective structured clinical examination: effects of examiner type. J Grad Med Educ. 2018;10(2):185-91.
96. Huffman BM, Hafferty FW, Bhagra A, et al. Resident impression management within feedback conversations: a qualitative study. Med Educ. 2021;55(2):266-74.
97. Voyer S, Cuncic C, Butler DL, et al. Investigating conditions for meaningful feedback in the context of an evidence-based feedback programme. Med Educ. 2016;50(9):943-54.
98. Weinstein DF. Feedback in clinical education: untying the Gordian knot. Acad Med. 2015;90(5):559-61.
99. Ramani S, Post SE, Könings K, et al. “it’s just not the culture”: a qualitative study exploring residents’ perceptions of the impact of institutional culture on feedback. Teach Learn Med. 2017;29(2):15361.
100. Ramani S, Könings K, Mann KV, et al. Uncovering the unknown: a grounded theory study exploring the impact of self-awareness on the culture of feedback in residency education. Med Teach 2017;39(10):1065-73.
101. Berbano EP, Browning R, Pangaro L, et al. The impact of the Stanford Faculty Development Program on ambulatory teaching behavior. J Gen Intern Med. 2006;21(5):430-4.
102. Holmboe ES, Fiebach NH, Galaty LA, et al. Effectiveness of a focused educational intervention on resident evaluations from faculty. J Gen Intern Med. 2001;16(7):427-34.
103. Junod Perron N, Nendaz M, Louis-Simonet M, et al. Effectiveness of a training program in supervisors’ ability to provide feedback on residents’ communication skills. Adv Health Sci Educ Theory Pract 2013;18(5):901-15.
104. Kistler EA, Chiappa V, Chang Y, et al. Evaluating the SPIKES model for improving peer-to-peer feedback among internal medicine residents: a randomized controlled trial. J Gen Intern Med 2021;36(11):3410-6.
105. Kruidering-Hall M, O’Sullivan PS, Chou CL. Teaching feedback to first-year medical students: long-term skill retention and accuracy of student self-assessment. J Gen Intern Med. 2009;24(6):721-6.
106. Zelenski AB, Tischendorf JS, Kessler M, et al. Beyond “read more”: an intervention to improve faculty written feedback to learners. J Grad Med Educ. 2019;11(4):468-71.
107. Schlair S, Dyche L, Milan F. Longitudinal faculty development
Volume 24, NO.3: May 2023 491 Western Journal of Emergency Medicine Natesan et al. Feedback in Medical Education: Evidence-based Guide to Best Practices from CORD
Feedback in Medical Education: Evidence-based Guide to Best Practices from CORD Natesan et al. program to promote effective observation and feedback skills in direct clinical observation. MedEdPORTAL. 2017;13:10648.
108. Ricotta DN, Hale AJ, Freed JA, et al. Peer observation to develop resident teaching. Clin Teach. 2020;17(5):521-5.
109. Rassbach CE, Blankenburg R. A novel pediatric residency coaching program: outcomes after one year. Acad Med. 2018;93(3):430-4.
110. Dupras DM, Edson RS. A survey of resident opinions on peer evaluation in a large internal medicine residency program. J Grad Med Educ. 2011;3(2):138-43.
111. Yuan D, Bridges M, D’Amico FJ, et al. The effect of medical student feedback about resident teaching on resident teaching identity: a randomized controlled trial. Fam Med. 2014;46(1):49-54.
112. Whitehouse A, Hassell A, Bullock A, et al. 360 degree assessment (multisource feedback) of UK trainee doctors: field testing of team assessment of behaviours (TAB). Med Teach. 2007;29(2-3):171-6.
113. Warm EJ, Schauer D, Revis B, et al. Multisource feedback in the ambulatory setting. J Grad Med Educ. 2010;2(2):269-77.
114. Riveros R, Kimatian S, Castro P, et al. Multisource feedback in professionalism for anesthesia residents. J Clin Anesth. 2016;34:3240.
115. Richard-Lepouriel H, Bajwa N, de Grasset J, et al. Medical students as feedback assessors in a faculty development program: Implications for the future. Med Teach. 2020;42(5):536-42.
116. van der Leeuw RM, Slootweg IA. Twelve tips for making the best use of feedback. Med Teach. 2013;35(5):348-51.
117. van der Leeuw RM, Schipper MP, Heineman MJ, et al. Residents’ narrative feedback on teaching performance of clinical teachers: analysis of the content and phrasing of suggestions for improvement. Postgrad Med J. 2016;92(1085):145-51.
118. Tully K, Keller J, Blatt B, et al. Observing and giving feedback to novice PGY-1s. South Med J. 2016;109(5):320-5.
119. Gottlieb M, Jordan J, Siegelman JN, et al. Direct observation tools in emergency medicine: a systematic review of the literature. AEM Education and Training. 2021;5(3):e10519.
120. Archer JC, McAvoy P. Factors that might undermine the validity of patient and multi-source feedback. Med Educ. 2011;45(9):886-93.
121. Garra G, Thode H. Synchronous collection of multisource feedback evaluations does not increase inter-rater reliability. Acad Emerg Med 2011;18 Suppl 2:S65-70.
122. Garra G, Wackett A, Thode H. Feasibility and reliability of a multisource feedback tool for emergency medicine residents. J Grad Med Educ. 2011;3(3):356-60.
123. Hayward MF, Curran V, Curtis B, et al. Reliability of the interprofessional collaborator assessment rubric (ICAR) in multi source feedback (MSF) with post-graduate medical residents. BMC Med Educ. 2014;14:1049.
124. van der Meulen MW, Boerebach BCM, Smirnova A, et al. Validation of the INCEPT: a multisource feedback tool for capturing different perspectives on physicians’ professional performance. J Contin Educ Health Prof. 2017;37(1):9-18.
125. Sherbino J, Bandiera G. Improving communication skills: feedback from faculty and residents. Acad Emerg Med. 2006;13(4):467-70.
126. Tariq M, Govaerts M, Afzal A, et al. Ratings of performance in multisource feedback: comparing performance theories of residents and nurses. BMC Med Educ. 2020;20(1):355.
127. Keister DM, Hansen SE, Dostal J. Teaching resident self-assessment through triangulation of faculty and patient feedback. Teach Learn Med. 2017;29(1):25-30.
128. Calhoun AW, Rider EA, Peterson E, et al. Multi-rater feedback with gap analysis: an innovative means to assess communication skill and self-insight. Patient Educ Couns. 2010;80(3):321-6.
129. Mahoney D, Bogetz A, Hirsch A, et al. The challenges of multisource feedback: feasibility and acceptability of gathering patient feedback for pediatric residents. Acad Pediatr. 2019;19(5):555-60.
130. Bounds R, Bush C, Aghera A, et al. Emergency medicine residents’ self-assessments play a critical role when receiving feedback. Acad Emerg Med. 2013;20(10):1055-61.
131. Stalmeijer RE, Dolmans DHJM, Wolfhagen IHAP, et al. Combined student ratings and self-assessment provide useful feedback for clinical teachers. Adv Health Sci Educ Theory Pract. 2010;15(3):31528.
132. Craig S. Direct observation of clinical practice in emergency medicine education. Acad Emerg Med. 2011;18(1):60-7.
133. Delbridge EJ, Wilson T, McGregor JD, et al. Interdisciplinary video review: assessing milestones and providing feedback. Int J Psychiatry Med. 2019;54(4-5):266-74.
134. Mann K, van der Vleuten C, Eva K, et al. Tensions in informed selfassessment: how the desire for feedback and reticence to collect and use it can conflict. Acad Med. 2011;86(9):1120-7.
135. Rizan C, Elsey C, Lemon T, et al. Feedback in action within bedside teaching encounters: a video ethnographic study. Med Educ 2014;48(9):902-20.
136. Young JQ, Sugarman R, Schwartz J, et al. Faculty and resident engagement with a workplace-based assessment tool: use of implementation science to explore enablers and barriers. Acad Med 2020;95(12):1937-44.
137. Havel LK, Powell SD, Cabaniss DL, et al. Smartphones, smart feedback: using mobile devices to collect in-the-moment feedback. Acad Psychiatry. 2017;41(1):76-80.
138. Georgoff PE, Shaughness G, Leininger L, et al. Evaluating the performance of the Minute Feedback System: A web-based feedback tool for medical students. Am J Surg. 2018;215(2):293-7.
139. McCutcheon S, Duchemin A-M. Formalizing feedback: introducing a structured approach in an outpatient resident clinic. Acad Psychiatry 2020;44(4):399-402.
140. Bandiera G, Lendrum D. Daily encounter cards facilitate competencybased feedback while leniency bias persists. CJEM. 2008;10(1):44-50.
141. Martin L, Sibbald M, Brandt Vegas D, et al. The impact of entrustment assessments on feedback and learning: trainee perspectives. Med Educ. 2020;54(4):328-36.
142. Burford B, Illing J, Kergon C, et al. User perceptions of multi-source feedback tools for junior doctors. Med Educ. 2010;44(2):165-76.
143. Pascoe JM, Nixon J, Lang VJ. Maximizing teaching on the wards: review and application of the One-Minute Preceptor and SNAPPS
Western Journal of Emergency Medicine 492 Volume 24, NO.3: May 2023
Natesan et al.
Feedback in Medical Education: Evidence-based Guide to Best Practices from CORD models. J Hosp Med. 2015;10(2):125-30.
144. Smith MA, Cherazard R, Fornari A, et al. A unique approach to faculty development using an Observed Structured Teaching Encounter (OSTE). Med Educ Online. 2018;23(1):1527627.
145. Topps D, Evans RJ, Thistlethwaite JE, et al. The One Minute Mentor: a pilot study assessing medical students’ and residents’ professional behaviours through recordings of clinical preceptors’ immediate feedback. Education for health (Abingdon, England). 2009;22(1):189.
146. Fluit C, Bolhuis S, Grol R, et al. Evaluation and feedback for effective clinical teaching in postgraduate medical education: validation of an assessment instrument incorporating the CanMEDS roles. Med Teach. 2012;34(11):893-901.
147. Sheng AY. Trials and tribulations in implementation of the emergency medicine milestones from the frontlines. West J Emerg Med 2019;20(4):647-50.
148. Holmboe ES, Yepes M, Williams F, et al. Feedback and the Mini Clinical Evaluation Exercise. J Gen Intern Med. 2004;19(5 Pt 2):558-61.
149. Yama BA, Hodgins M, Boydell K, et al. A qualitative exploration: questioning multisource feedback in residency education. BMC Med Educ. 2018;18(1):170.
150. Ferguson J, Wakeling J, Bowie P. Factors influencing the effectiveness of multisource feedback in improving the professional practice of medical doctors: a systematic review. BMC Med Educ 2014;14(1):76.
151. Hassell A, Bullock A, Whitehouse A, et al. Effect of rating scales on scores given to junior doctors in multi-source feedback. Postgrad Med J. 2012;88(1035):10-4.
152. Lockyer J, Armson H, Könings KD, et al. In-the-moment feedback and coaching: improving R2C2 for a new context. J Grad Med Educ 2020;12(1):27-35.
153. Sargeant J, Lockyer JM, Mann K, et al. The R2C2 model in residency education: how does it foster coaching and promote feedback use? Acad Med. 2018;93(7):1055-63.
154. French JC, Colbert CY, Pien LC, et al. Targeted feedback in the milestones era: utilization of the Ask-Tell-Ask feedback model to promote reflection and self-assessment. J Surg Educ 2015;72(6):e274-9.
155. Kogan JR, Shea JA. Implementing feedback cards in core clerkships. Med Educ. 2008;42(11):1071-9.
156. Prystowsky JB, DaRosa DA. A learning prescription permits feedback on feedback. Am J Surg. 2003;185(3):264-7.
157. Marcotte L, Egan R, Soleas E, et al. Assessing the quality of feedback to general internal medicine residents in a competencybased environment. Can Med Educ J. 2019;10(4):e32-e47.
158. Clay AS, Que L, Petrusa ER, et al. Debriefing in the intensive care unit: a feedback tool to facilitate bedside teaching. Crit Care Med 2007;35(3):738-54.
159. Richards ML, Paukert JL, Downing SM, et al. Reliability and usefulness of clinical encounter cards for a third-year surgical clerkship. J Surg Res. 2007;140(1):139-48.
160. Donato AA, Park YS, George DL, et al. Validity and feasibility of the minicard direct observation tool in 1 training program. J Grad Med
Educ. 2015;7(2):225-9.
161. Berz JPB, Cheng T, Quintiliani LM. Milestones-based direct observation tools in internal medicine resident continuity clinic. BMC Med Educ. 2017;17(1):240.
162. Singh T, Kundra S, Gupta P. Direct observation and focused feedback for clinical skills training. Indian Pediatr. 2014;51(9):713-7.
163. Harrison R, Tsyrulnik A, Wood DB, et al. An innovative feedback tool leading to improved faculty feedback and positive reception by residents. West J Emerg Med. 2019;21(1):47-51.
164. Hartranft TH, Yandle K, Graham T, et al. Evaluating surgical residents quickly and easily against the milestones using electronic formative feedback. J Surg Educ. 2017;74(2):237-42.
165. Chen F, Arora H, Zvara DA, et al. Anesthesia myTIPreport: a webbased tool for real-time evaluation of Accreditation Council for Graduate Medical Education’s milestone competencies and clinical feedback to residents. A A Pract. 2019;12(11):412-5.
166. Chan TM, Sebok-Syer SS, Cheung WJ, et al. Workplace-based assessment data in emergency medicine: a scoping review of the literature. AEM Educ and Train. 2021;5(3):e10544.
167. Snyder MJ, Nguyen DR, Womack JJ, et al. Testing quick response (QR) codes as an innovation to improve feedback among geographically separated clerkship sites. Fam Med. 2018;50(3):188-94.
168. Page CP, Reid A, Coe CL, et al. Learnings from the pilot implementation of mobile medical milestones application. J Grad Med Educ. 2016;8(4):569-75.
169. Page C, Reid A, Coe CL, et al. Piloting the Mobile Medical Milestones Application (M3App©): A multi-institution evaluation. Fam Med 2017;49(1):35-41.
170. Gray TG, Hood G, Farrell T. The results of a survey highlighting issues with feedback on medical training in the United Kingdom and how a smartphone app could provide a solution. BMC Res Notes 2015;8:653.
171. Desai B. A novel use of Twitter to provide feedback and evaluations. Clin Teach. 2014;11(2):141-5.
172. Bölter R, Freund T, Ledig T, et al. Video-assisted feedback in general practice internships using German general practitioners’ guidelines. GMS Z Med Ausbild. 2012;29(5):Doc68.
173. Paukert JL, Richards ML, Olney C. An encounter card system for increasing feedback to students. Am J Surg. 2002;183(3):300-4.
174. Mathew AE, Kumar Y, Angeline RP, et al. Workplace-based assessment of family medicine competencies using “field note tool”: a pilot study. J Family Med Prim Care. 2018;7(6):1458-63.
175. Connolly A, Goepfert A, Blanchard A, et al. myTIPreport and training for independent practice: a tool for real-time workplace feedback for milestones and procedural skills. J Grad Med Educ. 2018;10(1):70-7.
176. Fu R-H, Cho Y-H, Quattri F, et al. “I did not check if the teacher gave feedback”: a qualitative analysis of Taiwanese postgraduate year 1 trainees’ talk around e-portfolio feedback-seeking behaviours. BMJ Open. 2019;9(1):e024425.
177. Harre R. Positioning Theory. In: Tracy K, Ilie C, Sandel T, eds. The International Encyclopedia of Language and Social Interaction Wiley-Blackwell; 2015:1-9.
Volume 24, NO.3: May 2023 493 Western Journal of Emergency Medicine
Feedback in Medical Education: Evidence-based Guide to Best Practices from CORD
178. Tuck KK, Murchison C, Flores C, et al. Survey of residents’ attitudes and awareness toward teaching and student feedback. J Grad Med Educ. 2014;6(4):698-703.
179. Gaunt A, Patel A, Fallis S, et al. Surgical trainee feedback-seeking behavior in the context of workplace-based assessment in clinical settings. Acad Med. 2017;92(6):827-34.
180. Watling CJ, Lingard L. Toward meaningful evaluation of medical trainees: the influence of participants’ perceptions of the process. Adv Health Sci Educ Theory Pract. 2012;17(2):183-94.
181. Bowen L, Marshall M, Murdoch-Eaton D. Medical student perceptions of feedback and feedback behaviors within the context of the “educational alliance.” Acad Med. 2017;92(9):1303-12.
182. Lefroy J, Watling C, Teunissen PW, et al. Guidelines: the do’s, don’ts and don’t knows of feedback for clinical education. Perspect Med Educ. 2015;4(6):284-99.
183. Nussbaum AD, Dweck CS. Defensiveness versus remediation: selftheories and modes of self-esteem maintenance. Pers Soc Psychol Bull. 2008;34(5):599-612.
184. Goffman E. The Presentation of Self in Everyday Life. Doubleday; 1959.
185. Veloski J, Boex JR, Grasberger MJ, et al. Systematic review of the literature on assessment, feedback and physicians’ clinical performance: BEME Guide No. 7. Med Teach. 2006;28(2):117-28.
186. Chinn CA, Brewer WF. The role of anomalous data in knowledge acquisition: a theoretical framework and implications for science instruction. Rev Educ Res. 1993;63(1):1-49.
187. Butler DL, Winne PH. Feedback and self-regulated learning: a theoretical synthesis. Rev Educ Res. 1995;65(3):245-81.
188. Sargeant J, Armson H, Chesluk B, et al. The processes and dimensions of informed self-assessment: a conceptual model. Acad Med. 2010;85(7):1212-20.
189. Goldflam K, Bod J, Della-Giustina D, et al. Emergency medicine residents consistently rate themselves higher than attending assessments on ACGME milestones. West J Emerg Med 2015;16(6):931-5.
190. van der Leeuw RM, Teunissen PW, van der Vleuten CPM. Broadening the scope of feedback to promote its relevance to workplace learning. Acad Med. 2018;93(4):556-9.
191. Davies K, Guckian J. How to ask for and act on feedback: practical tips for medical students. MedEdPublish. 2018;7:63.
192. Stone D. Thanks for the Feedback: The Science and Art of Receiving Feedback Well. Penguin Books; 2014.
193. van der Leeuw RM, Overeem K, Arah OA, et al. Frequency and determinants of residents’ narrative feedback on the teaching performance of faculty: narratives in numbers. Acad Med 2013;88(9):1324-31.
194. Algiraigri AH. Ten tips for receiving feedback effectively in clinical practice. Med Educ Online. 2014;19:25141.
195. Kowalski K. Giving and receiving feedback: part II. J Contin Educ Nurs. 2017;48(10):445-6.
196. Kowalski K. Giving and receiving feedback: part I. J Contin Educ Nurs. 2017;48(9):395-6.
197. Bharamgoudar R, Sonsale A. Twelve tips for medical students
to make the best use of ward-based learning. Med Teach 2017;39(11):1119-22.
198. Wright SM, Kern DE, Kolodner K, et al. Attributes of excellent attending-physician role models. N Engl J Med. 1998;339(27):1986-93.
199. Beaulieu AM, Kim BS, Topor DR, et al. Seeing is believing: an exploration of what residents value when they receive feedback. Acad Psychiatry. 2019;43(5):507-11.
200. Telio S, Ajjawi R, Regehr G. The “educational alliance” as a framework for reconceptualizing feedback in medical education. Acad Med. 2015;90(5):609-14.
201. Teunissen PW, Stapel DA, van der Vleuten C, et al. Who wants feedback? An investigation of the variables influencing residents’ feedback-seeking behavior in relation to night shifts. Acad Med 2009;84(7):910-7.
202. Lacasse M, Lee S, Ghavam-Rassoul A, et al. Integrating teaching into the busy resident schedule: a learner-centered approach to raise efficiency (L-CARE) in clinical teaching. Med Teach 2009;31(11):e507-13.
203. Gupta A, Villegas CV, Watkins AC, et al. General surgery residents’ perception of feedback: We can do better. J Surg Educ 2020;77(3):527-33.
204. Bates J, Konkin J, Suddards C, et al. Student perceptions of assessment and feedback in longitudinal integrated clerkships. Med Educ. 2013;47(4):362-74.
205. Chou CL, Masters DE, Chang A, et al. Effects of longitudinal smallgroup learning on delivery and receipt of communication skills feedback. Med Educ. 2013;47(11):1073-9.
206. Albano S, Quadri SA, Farooqui M, et al. Resident perspective on feedback and barriers for use as an educational tool. Cureus 2019;11(5):e4633.
207. Watling C, Driessen E, van der Vleuten CPM, et al. Music lessons: revealing medicine’s learning culture through a comparison with that of music. Med Educ. 2013;47(8):842-50.
208. Chinai SA, Guth T, Lovell E, et al. Taking advantage of the teachable moment: a review of learner-centered clinical teaching models. West J Emerg Med. 2018;19(1):28-34.
209. Ruhotina M, Burrell D. A Melting Pot of Medical Education: Challenges, solutions, and opportunities for improving trainee feedback and education in the ED. R I Med J (2013). 2018;101(8):37-40.
210. Driessen E, Scheele F. What is wrong with assessment in postgraduate training? Lessons from clinical practice and educational research. Med Teach. 2013;35(7):569-74.
211. Feller K, Berendonk C. Identity matters - perceptions of interprofessional feedback in the context of workplace-based assessment in diabetology training: a qualitative study. BMC Med Educ 2020;20(1):33.
212. Loeppky C, Babenko O, Ross S. Examining gender bias in the feedback shared with family medicine residents. Educ Prim Care 2017;28(6):319-24.
213. Mueller AS, Jenkins TM, Osborne M, et al. Gender differences in attending physicians’ feedback to residents: a qualitative analysis. J Grad Med Educ. 2017;9(5):577-85.
Western Journal of Emergency Medicine 494 Volume 24, NO.3: May 2023
Natesan et al.
Feasibility of a Multifaceted Social Emergency Medicine Curriculum for Emergency Medicine Residents
Erin F. Shufflebarger, MD*
Melissa Willett, MD*
Sylvia Y. Sontheimer, MD†
Sherell Hicks, MD*
Charles A. Khoury, MD*
Lauren A. Walter, MD*
Section Editor: Caitlin Ryus, MD
University of Alabama at Birmingham Heersink School of Medicine, Department of Emergency Medicine, Birmingham, Alabama Boston Medical Center, Department of Emergency Medicine, Boston, Massachusetts
Submission history: Submitted September 26, 2022; Revision received January 6, 2023; Accepted February 17, 2023
Electronically published May 5, 2023
Full text available through open access at http://escholarship.org/uc/uciem_westjem
DOI: 10.5811/westjem.59009
Introduction: Emergency physicians are in a unique position to impact both individual and population health needs. Despite this, emergency medicine (EM) residency training lacks formalized education n the social determinants of health (SDoH) and integration of patient social risk and need, which are core components of social EM (SEM). The need for such a SEM-based residency curriculum has been previously recognized; however, there is a gap in the literature related to demonstration and feasibility. In this study we sought to address this need by implementing and evaluating a replicable, multifaceted introductory SEM curriculum for EM residents. This curriculum is designed to increase general awareness related to SEM and to increase ability to identify and intervene upon SDoH in clinical practice.
Methods: A taskforce of EM clinician-educators with expertise in SEM developed a 4.5-hour educational curriculum for use during a single, half-day didactic session for EM residents. The curriculum consisted of asynchronous learning via a podcast, four SEM subtopic lecture didactics, guest speakers from the emergency department (ED) social work team and a community outreach partner, and a poverty simulation with interdisciplinary debrief. We obtained pre- and post- intervention surveys.
Results: A total of 35 residents and faculty attended the conference day, with 18 participants completing the immediate post-conference survey and 10 participants completing the two-month delayed, postconference survey. Post-survey results demonstrated improved awareness of SEM concepts and increased confidence in participants’ knowledge of community resources and ability to connect patients to these resources following the curricular intervention (25% pre-conference to 83% post-conference). In addition, post-survey assessment demonstrated significantly heightened awareness and clinical consideration of SDoH among participants (31% pre-conference to 78% post-conference) and increased comfort in identifying social risk in the ED (75% pre-conference to 94% post-conference). Overall, all components of the curriculum were evaluated as meaningful and specifically beneficial for EM training. The ED care coordination, poverty simulation, and the subtopic lectures were rated most meaningful.
Conclusion: This pilot curricular integration study demonstrates feasibility and the perceived participant value of incorporating a social EM curriculum into EM residency training. [West J Emerg Med. 2023;24(3)495–501.]
BACKGROUND
The importance of addressing social determinants of health (SDoH) as a part of patient care is widely recognized.
The World Health Organization’s Commission on SDoH emphasized the importance of increased awareness as well as education and training specifically related to SDoH as a
Volume 24, NO.3: May 2023 495 Western Journal of Emergency Medicine * † Social Emergency Medicine
way to improve health equity.1 There is growing interest in incorporating SDoH into the undergraduate medical education curriculum, although this education is not standardized and is not yet available to every medical student.2 Within graduate medical education, the emphasis on SDoH education has predominantly been within primary care specialties (ie, internal medicine, family medicine, and pediatrics) due to the longitudinal patient relationships typically present in these specialties. However, primary care residency training programs still lack uniform and standardized SDoH curriculum content, implementation, and evaluation.3
Although emergency medicine (EM) is not considered a primary care specialty, emergency physicians are routinely confronted with SDoH, social needs, and the reality of health disparities. The emergency department (ED) has been described as “the social barometer of its community.”4 Given the unique relationship between SDoH and acute care in the ED, the field of social emergency medicine (SEM) has emerged, in which both individual and population health needs are considered.5 Research in this field has led to the implementation of many effective ED-based interventions to address population health needs in domains including access to care, exposure to violence/crime, language/literacy/ healthcare literacy, and poverty.6
Despite this recognized overlap between SDoH and EM, medical training, specifically EM residency training, often lacks a formalized curriculum related to SEM. A need has now developed for training in SDoH and application of this knowledge to practice.4 Existing literature demonstrates the feasibility of integrating SDoH-specific education as a part of an EM clerkship.7 The need for a SEM curriculum adapted specifically for EM residency training has been described and called for in previous literature,8 and objectives for such a curricular addition have been proposed.9 However, there is a gap in the literature related to the feasibility of such a curriculum addition. In this study we sought to address this need as we evaluated the feasibility of a multifaceted, immersive, introductory SEM curriculum for use in EM resident education.
OBJECTIVES
Our study goals were as follows:
1) To design, implement, and evaluate the feasibility of a replicable, multifaceted SEM curriculum for EM residents.
2) To increase EM residents’ level of awareness related to SEM and to improve their ability to identify and intervene in SDoH in clinical practice.
CURRICULAR DESIGN Study Design and Protocol
We developed this curriculum using the six-step approach for curriculum development by Kern et al.10 The overall need for a SEM curriculum was established in the literature as previously discussed and was confirmed in a needs assessment
conducted among EM residents. Next, following Kern’s framework, we established goals, objectives, and educational strategies to meet these objectives. The curriculum was then implemented and subsequently evaluated by the learners.10
A task force comprised of EM clinician-educators, including a SEM fellowship director and fellow, an EM residency program director, and an EM resident and senior medical student with specific interest in SEM, was assembled at the University of Alabama at Birmingham (UAB). The pilot “SEM curriculum” was designed as a single didactic and experiential learning block. It included four continuous hours of resident education time plus 30 minutes of asynchronous pre-learning with debrief, for a total of 4.5 hours of didactic time. This study was reviewed and subsequently determined to be exempt by the UAB Institutional Review Board.
The final curriculum (Table 1) included asynchronous flipped learning via a podcast,11 four subtopic lecture didactics, guest speakers from the ED social work team and a community representative, and a poverty simulation and debrief.12, 13 The material for the subtopic lectures was chosen considering the patient population frequently encountered by the resident learners and, when replicated, can be adjusted to meet the needs of the learners and their surrounding community. The curriculum was delivered by members of the curriculum development task force along with simulation faculty in April 2021 via videoconferencing due to COVID-19 restrictions.
Study Setting and Population
The UAB Emergency Medicine Residency Program is a three-year ACGME-accredited residency program in Birmingham, Alabama with 32 residents as of July 2020. The program is accredited by the Accreditation Council for Graduate Medical Education. Residents are allotted protected time from clinical duties to attend weekly didactics for a 4-5 hour block.
Key Outcome Measures
We developed two participant surveys, including a “preintervention” and “post-intervention” survey, and distributed the survey by email to UAB EM residents and participating faculty to evaluate the effect and impact of the virtual curriculum as well as generate general feedback. Survey responses were kept anonymous, but pre- and post-intervention surveys were matched using a unique identifier. Surveys included general demographic information (eg, gender, race) and subjective information measured by a Likert scale including self-perceived attitude and comfort level regarding identifying and addressing SDoH in the ED setting. The pre-conference survey also incorporated the “Medical Condition Regard Scale” (MCRS) to assess participants’ general attitude toward patients with social needs. The MCRS has prior evidence of validity in a similar population and measures “the degree to which the respondents find patients with a given medical condition
Western Journal of Emergency Medicine 496 Volume 24, NO.3: May 2023
Shufflebarger et al.
Feasability of a Multifaceted Social EM Curriculum
Table 1. Components of a social emergency medicine curriculum.
1. Pre-didactic asynchronous learning
Announce Podcast “Episode 4 – Social Determinants of Health and Unmet Needs in the Emergency Department”11
2. Subtopic lectures PowerPoint slide presentations
1. Intro to SEM/Asynchronous Debrief
2. Incarceration
3. Firearm Violence
4. Homelessness
Feasability of a Multifaceted Social EM Curriculum
30 minutes
See Reference 11 for podcast
3. Guest speaker from community resource
The executive director of a local homeless shelter spoke about the many resources provided by this shelter, as well as about the population that the shelter serves and the interaction between this population and the medical community.
4. ED care coordination presentation Members from the ED Care Coordination and Social Services team spoke about available resources for ED patients and how clinicians can connect patients with these resources.
5. Poverty simulation Led by the UAB Office of Interprofessional Simulation, the “Poverty Simulation” is an interactive experience “designed to raise awareness of the challenges that individuals may face when living in lowincome situations.”12 While this simulation is typically an in-person event, given COVID-19 restrictions an online interactive simulation, SPENT, was used and the interprofessional debriefing took place by video conferencing.13
60 minutes (10-15 minutes each)
30 minutes
Tailor topics to local community need. Specific materials used here can be provided upon request to corresponding author
Contact local community partner to present
30 minutes
Contact ED social services to present
2 hours
See Reference 13 for virtual poverty simulation
SEM, social emergency medicine; ED, emergency department; UAB, University of Alabama at Birmingham; COVID-19, coronavirus disease 2019.
enjoyable, treatable, and worthy of medical resources.”14 The surveys focused on the Kirkpatrick Model of Evaluation levels 1 and 2, evaluating learner reaction to and satisfaction with the curriculum as well as measuring learner attitude change as a result of the curriculum.15
Data Analysis
We used JotForm (Jotform, Inc, San Francisco, CA) to create the survey and collect all survey data. Descriptive statistics were conducted using frequencies and percentages for categorical data. We performed paired sample t-test analysis to assess whether there was a difference between matched pre- and post- survey responses from residents and other participants. P-values <0.05 were considered to be statistically significant. We performed all statistical analyses using JMP Pro 14 (JMP Statistical Discovery, LLC, Cary, NC).16
IMPACT/EFFECTIVENESS Results
A total of 23 residents (71.9%) along with 12 other participants including EM faculty and a medical student
attended the conference day. Eighteen people (51.4% of total participants) including 14 residents (60.9% of participating residents) completed the immediate post-conference survey, and 10 people (28.6% of total participants) including seven residents (30.4% of participating residents) completed the two-month delayed, post-conference survey.
Participant pre- and immediate post-survey results are displayed in Table 2. Before the conference, only 31.3% of responding participants reported prior training on identifying and intervening on SDoH. After the conference, participants were significantly more likely to report being aware of and familiar with local community resources to address SDoH and were also more confident in their knowledge of these community resources and their ability to connect patients to them. In addition, the post-conference data indicated that participants were significantly more likely to consider SDoH when providing treatment to ED patients and were significantly more comfortable with identifying social risk in the ED.
A majority of the participants reported caring for greater than 15 patients with social needs in the ED in the previous
Volume 24, NO.3: May 2023 497 Western Journal of Emergency Medicine
al.
Shufflebarger et
To
Component Description Time allotted
replicate
The emergency department (ED) is an appropriate venue to connect patients with community resources.
I feel comfortable identifying social need (ex: homelessness, food insecurity) in the ED.
I feel comfortable identifying social risk (ex: risk of worse health outcome for certain races) in the ED.*
I have been trained to identify and intervene on social determinants of health (SDoH).*
I am aware of and familiar with local community resources to address social determinants of health.*
I feel confident in my knowledge about community resources and ability to connect patients to them.*
I frequently encounter patients in the ED with social need that impacts their health.
I frequently encounter patients in the ED with social risk that impacts their health.
I frequently consider SDoH when providing treatment for my patients in the ED.
*Paired samples, P<.05 ED, emergency department; SDoH, social determinants of health.
month, with 44% of the participants reporting caring for greater than 30 patients with social needs. The most commonly encountered or anticipated barriers to addressing SDoH in the ED setting were thought to be emergency physician (EP) time constraints, lack of knowledge of resources, and availability of resources.
As demonstrated in Table 3, respondents reported overall positive attitude toward patients experiencing social needs (eg, homelessness, food insecurity). However, a majority of participants (59%) disagreed with the statement that they enjoy giving extra time to patients like this. As resident postgraduate (PGY) year increased, respondents became more likely to disagree with the following statement: “I feel especially compassionate toward patients like this,” with zero percent of PGY-1 participants, 27% of PGY-2 participants, and 57% of PGY-3 participants disagreeing with this statement. The MCRS survey was repeated in the two-month delayed, post-conference survey. Unfortunately, only four participants
could be matched to their pre-survey responses; therefore, we did not analyze this data for trends.
Feedback received following completion of the course was positive. Seventeen of eighteen (94.4%) of the respondents reported an improved understanding of the topic. Sixteen of eighteen (88.9%) respondents would recommend this curriculum to other EM residents. Similarly, 83% of respondents reported that this training increased their confidence in caring for patients with social needs. Overall, all components of the curriculum were felt to be beneficial and meaningful to the training. The ED care coordination, poverty simulation, and the subtopic lectures were rated most meaningful (Appendix 1)
DISCUSSION
Emergency physicians encounter patients with both acute and chronic medical and social needs on a daily basis. Just as we expect every practicing EP to be trained and ready to appropriately respond to a patient presenting with stroke
Western Journal of Emergency Medicine 498 Volume 24, NO.3: May 2023 Feasability of a Multifaceted Social EM Curriculum Shufflebarger et al.
Pre-survey response (n=32) Post-survey response (n=18)
Survey question
Strongly agree/Agree Strongly disagree/Disagree 30 (93.8) 2 (6.3) 17 (94.4) 1 (5.6)
Strongly agree/Agree Strongly disagree/Disagree 28 (87.5) 4 (12.5) 17 (94.5) 1 (5.6)
Strongly agree/Agree Strongly disagree/Disagree 24 (75.0) 8 (25.0) 17 (94.5) 1 (5.6)
Strongly agree/Agree Strongly disagree/Disagree 10 (31.3) 22 (68.8) 14 (77.8) 4 (22.2)
Strongly agree/Agree Strongly disagree/Disagree 18 (56.3) 14 (43.8) 16 (88.9) 2 (11.1)
agree/Agree Strongly disagree/Disagree 8 (25.0) 24 (75.0) 15 (83.3) 3 (16.7)
Strongly
Strongly agree/Agree Strongly disagree/Disagree 31 (96.9) 1 (3.1) 18 (100.0) 0 (0.0)
Strongly agree/Agree Strongly disagree/Disagree 31 (96.9) 1 (3.1) 18 (100.0) 0 (0.0)
Strongly agree/Agree Strongly disagree/Disagree 21 (65.6) 11 (34.4) 17 (94.5) 1 (5.6) Table
2. Survey results, [n (%)].
Shufflebarger et al.
Table 3. MCRS* survey results, stratified by training year [n(%)].
I prefer not to work with patients like this.
Patients like this irritate me.
I enjoy giving extra time to patients like this.
Patients like this are particularly difficult for me to work with.
Working with patients like this is satisfying.
I feel especially compassionate toward patients like this.
I can usually find something that helps patients like this feel better.
There is little I can do to help patients like this.
Treating patients like this is a waste of medical dollars.
symptoms, we should also expect every EP to be trained and ready to appropriately respond to a patient presenting with social need. This requires appropriate education and training. There is exciting work being done in the realm of education related to SDoH in EM. The feasibility of integrating SDoHspecific education into undergraduate medical education was described in 2019 when a three-part curriculum was integrated into an EM clerkship.7 The concepts of SEM have also recently been incorporated into resident education at one institution using simulation with eight cases focusing on health equity.17 Despite these recent advances, a formalized, standardized residency training on SDoH and SEM is missing from most required curricula. Less than one-third of our participants reported receiving previous training on how to identify and intervene on SDoH.
This study demonstrates that the implementation of an introductory virtual SEM curriculum for EM residents is feasible and effective. Given the multifaceted approach, we anticipate that other institutions may be able to use or
Feasability of a Multifaceted Social EM Curriculum
incorporate some or all of this framework, modifying it to fit the needs of their learners and local SDoH. The curriculum is intended to be locally relevant but can be easily replicated using the same model. Some components of the curriculum can be used directly (asynchronous podcast and poverty simulation), while other didactic components should be tailored to the specific needs of the local community (Table 1)
Ideally, EM training programs will be able to implement a longitudinal, integrated, SDoH-focused curriculum to better equip EPs to care for the social needs of their patients.9 However, this half-day curriculum serves as a demonstration of a focused didactic block that can be used either as an introduction to a longitudinal curriculum or as the first step in integrating SEM education into the resident curriculum. While this initial curriculum took only four hours of allotted resident conference time, participant surveys indicate that implementation of a single conference day was effective. We anticipate a longitudinal SEM curriculum would be just as effective and comprehensive, if not more so.
Volume 24, NO.3: May 2023 499 Western Journal of Emergency Medicine
Pre-survey response Survey question Total (n=32) PGY-1 (n=7) PGY-2 (n=11) PGY-3 (n=7) Attending (n=5)
Agree Disagree 4 (12.5) 28 (87.5) 1 (14.3) 6 (85.7) 2 (18.2) 9 (81.8) 0 (0.0) 7 (100.0) 1 (20.0) 4 (80.0)
Agree Disagree 4 (12.5) 28 (87.5) 1 (14.3) 6 (85.7) 3 (27.3) 8 (72.7) 0 (0.0) 7 (100.0) 0 (0.0) 5 (100.0)
Agree Disagree 13 (40.6) 19 (59.4) 3 (42.9) 4 (57.1) 5 (45.5) 6 (54.6) 1 (14.3) 6 (85.7) 2 (40.0) 3 (60.0)
Agree Disagree 10 (31.3) 22 (68.8) 2 (28.6) 5 (71.4) 5 (45.5) 6 (54.6) 1 (14.3) 6 (85.7) 1 (20.0) 4 (80.0)
Agree Disagree 20 (62.5) 12 (37.5) 5 (71.4) 2 (28.6) 7 (63.6) 4 (36.4) 3 (42.9) 4 (57.1) 3 (60.0) 2 (40.0)
Agree Disagree 23 (71.9) 9 (28.1) 7 (100.0) 0 (0.0) 8 (72.7) 3 (27.3) 3 (42.9) 4 (57.1) 3 (60.0) 2 (40.0)
Agree Disagree 20 (62.5) 12 (37.5) 5 (71.4) 2 (28.6) 7 (63.6) 4 (36.4) 5 (71.4) 2 (28.6) 1 (20.0) 4 (80.0)
Agree Disagree 15 (46.9) 17 (53.1) 3 (42.9) 4 (57.1) 5 (45.5) 6 (54.6) 3 (42.9) 4 (57.1) 3 (60.0) 2 (40.0)
Agree Disagree 3 (9.4) 29 (90.6) 1 (14.3) 6 (85.7) 2 (18.2) 9 (81.8) 0 (0.0) 7 (100.0) 0 (0.0) 5 (100.0)
*MCRS, Medical Condition Regard Scale; PGY, postgraduate year.
In the specialty of EM, burnout rates are high, and successful mechanisms to reduce burnout are needed.18 One component of burnout is emotional erosion, or “the transition of enthusiasm and compassion at the beginning of practice to anger, cynicism, and bitterness.”19 An interesting finding of the pre-survey MCRS was that participants’ feelings of compassion toward patients with social needs decreased with each year of residency training. While the significance of this should be interpreted with caution as the sample size was small, this trend warrants further consideration.
Axelson et al. proposed that an under-recognized contributor to burnout is a sense of futility in the daily practice of EM due to lack of training to identify and intervene on SDoH.8 This makes sense, as it could be frustrating to consistently be confronted with an issue that you have not been adequately trained to address. It is reasonable to consider that increasing SDoH education for EPs could be a useful tool for reducing burnout in the specialty. Perhaps including this education early in residency, even as early as during intern orientation, could mitigate this contributor to burnout if EM trainees felt more equipped to provide this compassionate, effective care and address patients’ social needs from the start of training. The impact of SDoH education on markers of EP burnout is an important factor to consider with future educational interventions.
LIMITATIONS
This was a single-center, pilot study involving one EM residency program and, therefore, participant numbers were small. Further implementation at other sites as a multicenter study will be necessary to further investigate the generalizability of the results of this pilot study to all EM residency programs. Additionally, this curriculum was implemented during the COVID-19 pandemic. For the safety of all participants and guest speakers, the entire curriculum including the simulation took place virtually using online video conferencing. This virtual learning platform introduces limitations including technical difficulties and reduced learner engagement.20 The response rate fell with each subsequent survey despite multiple email reminders to complete the surveys, increasing the possibility of nonresponse bias. Future in-person course delivery should attempt to increase immediate post-survey response rates by offering participants a variety of options for survey completion (eg, web-based survey, written survey). We were also unable to supplement the classroom and simulation experience with an in-person community experience (eg, service activity, touring community resources) given these restrictions. When planning future curriculum innovation, we will seek to expand this SEM resident curriculum with the addition of a community engagement component.
CONCLUSION
Emergency physicians are in a unique position to impact both individual as well as community and population health.
Despite this, formalized resident training in the social determinants of health is lacking. This single pilot study demonstrates the feasibility and perceived participant value of incorporating a social emergency medicine curriculum into residency training.
Address for Correspondence: Erin F. Shufflebarger, MD, University of Alabama at Birmingham Heersink School of Medicine, Department of Emergency Medicine, 521 19th Street South, Birmingham, AL 35233. Email: erinshufflebarger@uabmc.edu.
Conflicts of Interest: By the WestJEM article submission agreement, all authors are required to disclose all affiliations, funding sources and financial or management relationships that could be perceived as potential sources of bias. No author has professional or financial relationships with any companies that are relevant to this study. There are no conflicts of interest or sources of funding to declare.
Copyright: © 2023 Shufflebarger et al. This is an open access article distributed in accordance with the terms of the Creative Commons Attribution (CC BY 4.0) License. See: http:// creativecommons.org/licenses/by/4.0/
REFERENCES
1. CSDH. Closing the gap in a generation: health equity through action on the social determinants of health. Final Report of the Commission on Social Determinants of Health. Geneva, World Health Organization.
2. Doobay-Persaud A, Adler MD, Bartell TD, et al. Teaching the social determinants of health in undergraduate medical education: a scoping review. J Gen Intern Med. 2019;34(5):720-30.
3. Gard LA, Peterson J, Miller C, et al. Social determinants of health training in U.S. primary care residency programs: a scoping review. Acad Med. 2019;94(1):135-43.
4. Anderson ES, Hsieh D, Harrison JA. Emergency medicine: embracing the dual role of the emergency department in acute care and population health. Ann Emerg Med. 2016;68(1):21-5.
5. Anderson ES, Lippert S, Newberry J, et al. Addressing social determinants of health from the emergency department through social emergency medicine. West J Emerg Med. 2016;17(4):487-9.
6. Walter LA, Schoenfeld EM, Smith CH, et al. Emergency department–based interventions affecting social determinants of health in the United States: a scoping review. Acad Emerg Med. 2020;28(6):666-74.
7. Moffett SE, Shahidi H, Sule H, et al. Social determinants of health curriculum integrated into a core emergency medicine clerkship. MedEdPORTAL. 2019;15:10789.
8. Axelson DJ, Stull MJ, Coates WC. Social determinants of health: a missing link in emergency medicine training. AEM Educ Train 2017;2(1):66-8.
9. Stillman K, Owen DD, Mamtani M, et al. A social emergency medicine curriculum: bridging emergency care and health equity. AEM Educ
Western Journal of Emergency Medicine 500 Volume 24, NO.3: May 2023
Shufflebarger et al.
Feasability of a Multifaceted Social EM Curriculum
Shufflebarger et al.
Train. 2021;5(S1):S154-157.
10. Kern DE. (2016). Chapter 1: Overview, a six-step approach to curriculum development. In: Chen BY, Hughes MT, Kern DE, Thomas PA, eds. Curriculum Development for Medical Education. 3rd ed. Baltimore: John Hopkins University Press.
11. SocialEMpact. Episode 4 - Social determinants of health and unmet needs in the emergency department. 2019. Available at: https://www. socialempact.com/announce-podcast/sdoh. Accessed May 25, 2022.
12. Poverty Simulation. UAB Office of Interprofessional Simulation for Innovative Clinical Practice. Available at: https://www.uab.edu/ simuab/experience/pov-sim. Accessed May 25, 2022.
13. SPENT. McKinney and Urban Ministries of Durham. Available at: http://playspent.org. Accessed May 25, 2022.
14. Christison GW, Haviland MG, Riggs ML. The Medical Condition Regard Scale: measuring reactions to diagnoses. Acad Med.
Feasability of a Multifaceted Social EM Curriculum
2002;77(3):257-62.
15. Frye AW, Hemmer PA. Program evaluation models and related theories: AMEE Guide No. 67. Med Teach. 2012;34(5):e288-e299.
16. JMP® Pro 14. SAS Institute Inc., Cary, NC, 1989–2021.
17. Ward-Gaines J, Buchanan JA, Angerhofer C, et al. Teaching emergency medicine residents health equity through simulation immersion. AEM Educ Train. 2021;5(S1):S102-107.
18. Zhang Q, Mu M, He Y, et al. Burnout in emergency medicine physicians: a meta-analysis and systematic review. Medicine. 2020;99(32):e21462.
19. Berger E. Physician burnout: emergency physicians see triple risk of career affliction. Ann Emerg Med. 2013;61(3):A17-A19.
20. Wilcha R. Effectiveness of virtual medical teaching during the COVID-19 crisis: systematic review. JMIR Med Educ. 2020;6(2):e20963.
Volume 24, NO.3: May 2023 501 Western Journal of Emergency Medicine
Disparities Exist in the Application of Low Tidal-volume Ventilation in the Emergency Department
Michael Self, MD*†
Brent Kennis, BD‡
Andrew Lafree, MD*
Christopher R. Tainter, MD†
Jesus Lopez, BS‡
Atul Malhotra, MD§
Theodore Chan, MD*
Gabriel Wardi, MD‡§
Section Editor: Mark I. Langdorf, MD
University of California San Diego, Department of Emergency Medicine, San Diego, California
UC San Diego, Department of Anesthesiology, Division of Critical Care Anesthesiology, San Diego, California
UC San Diego, School of Medicine, San Diego, California
UC San Diego, Department of Internal Medicine, Division of Pulmonary, Critical Care, Sleep Medicine & Physiology, San Diego, California
Submission history: Submitted October 25, 2022; Revision received October 25, 2022; Accepted January 22, 2023
Electronically published April 26, 2023
Full text available through open access at http://escholarship.org/uc/uciem_westjem
DOI: 10.5811/westjem.59291
Introduction: Low tidal-volume ventilation (LTVV), defined as a maximum tidal volume of 8 milliliters per kilogram (mL/kg) of ideal body weight, is a key component of lung protective ventilation. Although emergency department (ED) initiation of LTVV has been associated with improved outcomes, disparities in LTVV application exist. In this study our aim was to evaluate whether rates of LTVV are associated with demographic and physical characteristics in the ED.
Methods: We conducted a retrospective observational cohort study using a dataset of patients who underwent mechanical ventilation at three EDs in two health systems from January 2016–June 2019. Demographic, mechanical ventilation, and outcome data including mortality and hospital-free days were abstracted by automatic query. A LTVV approach was defined as a tidal volume ≤8 mL/kg ideal body weight. We performed descriptive statistics and univariate analysis as indicated, and created a multivariate logistic regression model.
Results: Of 1,029 patients included in the study, 79.5% received LTVV. Tidal volumes of 400500 mL were used in 81.9% of patients. Approximately 18% of patients had tidal volumes changed in the ED. Female gender (adjusted odds ratio [aOR] 4.17, P < 0.001), obesity (aOR 2.27, P < 0.001), and first-quartile height (aOR 12.2, P < 0.001) were associated with receiving non-LTVV in multivariate regression analysis. Hispanic ethnicity and female gender were associated with first quartile height (68.5%, 43.7%, P < 0.001 for all). Hispanic ethnicity was associated with receiving non-LTVV in univariate analysis (40.8% vs 23.0%, P < 0.001). This relationship did not persist in sensitivity analysis controlling for height, weight, gender, and body mass index. Patients who received LTVV in the ED had 2.1 more hospital-free days compared to those who did not ( P = 0.040). No difference in mortality was observed.
Conclusion: Emergency physicians use a narrow range of initial tidal volumes that may not meet lung-protective ventilation goals, with few corrections. F emale gender, obesity, and firstquartile height are independently associated with receiving non-LTVV in the ED. Using LTVV in the ED was associated with 2.1 fewer hospital-free days. If con firmed in future studies, these findings have important implications for achieving quality impro vement and health equality.
[West J Emerg Med. 2023;24(3)502–510.]
Western Journal of Emergency Medicine 502 Volume 24, NO.3: May 2023 * † ‡ § Original Research
INTRODUCTION
More than 250,000 patients receive mechanical ventilation each year in emergency departments (ED) in the United States.1–3 Although potentially life-saving, mechanical ventilation may cause harm through volutrauma, barotrauma, and atelectrauma collectively referred to as ventilatorinduced lung injury (VILI).4 Adherence to lung-protective ventilation strategies mitigates these injuries and has been associated with improved patient-centered outcomes, including decreased mortality, for patients with and without acute respiratory distress syndrome (ARDS).5 In addition to appropriate positive end expiratory pressure (PEEP), an important component of a lung-protective strategy is adherence to low tidal-volume ventilation (LTVV), defined as a tidal volume ≤ 8 milliliters per kilogram (mL/kg) ideal body weight (IBW).6,7
Decades of data suggest that use of LTVV decreases mortality and VILI in patients undergoing mechanical ventilation in the intensive care unit (ICU).8 Recent data has demonstrated benefits to initiating LTVV in the ED, including decreased mortality, increased ventilator-free days, and reduced healthcare costs.9–11 Additionally, for patients with ARDS, or at risk for ARDS, convincing data shows that early adjustment of ventilator settings to target LTVV impacts outcomes.12,13 Changes to tidal volumes are infrequently made in the ED after initial ventilator settings are selected.14 Increased ED patient volumes over the past decade, coupled with rising inpatient critical care occupancy, have resulted in more critically ill patients boarding in the ED for longer times while undergoing mechanical ventilation, highlighting the importance of careful attention to ventilator settings in the ED.15–18
Various disparities in ED patient care have been described, including gender and racial differences in pain management, traumatic brain injury management, and emergency cardiology interventions.19–21 While adoption of LTVV has increased in the past decade, few investigations have evaluated demographic disparities in the use of LTVV in the ED.10,14 Several observational studies in the ICU have shown that female and obese patients are less likely to receive LTVV.22,23 Furthermore, outcome data from mechanically ventilated patients in the ICU has previously shown significant differences in survival based on race and ethnicity,24 as well as body mass index (BMI).25 A recent analysis found that women were less likely to receive LTVV in the ED compared to men, although this finding was limited by small sample size and single-center design.26 Given the importance of ED ventilator management, it is critical to identify patients at risk for receiving inappropriate tidal volumes, as this may directly impact survival and development of ARDS. Such data may help inform protocols designed to ensure appropriate ventilator settings for patients who receive mechanical ventilation in the ED, increase awareness among emergency physicians, and alleviate disparities in care that may impact patient-centered outcomes.
Population Health Research Capsule
What do we already know about this issue? Low tidal volume ventilation is associated with improved patient-centered outcomes in patients undergoing mechanical ventilation in the ED.
What was the research question? Are rates of inappropriate high tidal volumes associated with demographic and physical patient characteristics?
What was the major finding of the study? Female sex (OR 4.17, 95% CI 2.7–6.3) and short stature (OR 12.2, 95% CI 7.8–19.0) were associated with non-LTVV.
How does this improve population health?
Attention to initial selection of tidal volume in females and those with short stature may help emergency physicians mitigate this modifiable health disparity.
In our study we aimed to evaluate whether rates of LTVV were associated with demographic and physical characteristics. Using a large dataset from multiple institutions, we hypothesized that female gender, height, and elevated BMI would be associated with lower use of LTVV in the ED.
METHODS Study Design and Setting
We conducted a retrospective, multicenter, observational cohort study consisting of patients who received endotracheal intubation (ETI) and mechanical ventilation at three EDs across two healthcare systems from January 2016–June 2019. Our institutional review boards approved this study under a waiver of informed consent. This manuscript was prepared in accordance with STROBE guidelines. 27 The urban ED is a regional safetynet hospital and has approximately 55,000 patient visits per year. The suburban ED is a tertiary referral center serving a population of patients who largely receive their primary and subspecialty care at the institution and has approximately 40,000 patient visits per year. The rural ED is in a high needs, primary care health professional shortage area near the US-Mexico border in a low-density, agricultural community with approximately 50,000 patient visits per year. The urban and suburban sites are part of an academic health system, while the rural site is a distinct health system. Data from the urban and suburban sites was
Volume 24, NO.3: May 2023 503 Western Journal of Emergency Medicine Self et al. Disparities Exist in the Application of LTVV in the ED
Disparities Exist in the Application of LTVV in the ED Self
abstracted by automated query, while data from the rural site was extracted manually by two trained reviewers using a standardized data collection template.
Selection of Participants
Patients who underwent ETI were identified by the presence of an intubation order, neuromuscular blockade order, mechanical ventilation order, or documentation of ETI within the study period. Identified patients were included in the study if they were at least 18 years of age, with fraction of inspired oxygen (FiO2) and PEEP values recorded in the ED and with complete weight, height, and demographic data, and a height greater than 1.52 meters (the lower limit of acceptable height when calculating IBW using the Devine formula). We excluded patients with implausible data (eg, FiO2 > 1.00 or < 0.21). Missing data was not substituted for any cases.
Mechanical Ventilation
At both health systems, initial mechanical ventilation settings are decided upon by the treating physician and entered by a respiratory therapist. At the urban and suburban EDs, a hospital-wide protocol sets the default ventilator mode to volume-targeted pressure control (VTPC). The treating physician may choose a different mode of ventilation, but virtually all patients receive VTPC. At the rural hospital, initial ventilator settings are input by the treating physician. If an initial order for mechanical ventilation settings is not placed, a respiratory-therapist protocol allows selection of initial mechanical ventilation settings with volume control, PEEP of 8, and respiratory rate set based on the patient’s clinical picture. Measuring patient height with a tape measure is recommended but not mandated in both healthcare systems.
Measurements
Baseline demographics (including height, weight, gender, race, ethnicity, and comorbidities), vital signs, laboratory values, ventilator settings, maximum sequential organ failure assessment (SOFA) score within 24 hours, hospital discharge disposition, ED length of stay, and ED boarding time were abstracted by automated query from the electronic health record (EHR). Height and weight were obtained by any of the following means: directly measured in the ED; patient reported; obtained from patient identification; or obtained from prior ED visits. Gender was recorded as assigned gender at birth in the EHR and was patient reported, obtained from previous visits, or obtained from patient identification.
We retrospectively collected race and ethnicity from the EHR in accordance with recent guidance on appropriate reporting of race and ethnicity in scientific and medical journals. 28 Registration staff record race and ethnicity data through protocolized approaches to obtain self-reported
race and ethnicity from the patient or patient surrogate, if the patient is unable to provide information. The EHR’s prespecified race and ethnicity categories, based on nationally accepted categories, are reported as more detailed information but was not available. “Other Race or Mixed Race” and “Unknown” are reported with quotation marks as these are not specific races but EHR constructs. Vital signs and ventilator settings were abstracted from nurse or respiratory therapist-verified flowsheets, respectively. The SOFA scores were automatically calculated by the EHR. Our institution only started automatically calculating SOFA scores in July 2017; thus, a number of patients did not have this score recorded. The Charlson Comorbidity Index was calculated as described by Charlson et al. 29 Ideal body weight was calculated based on patient height using the Devine formula.30 We abstracted BMI from the chart, and obesity was defined as a BMI >30 kilograms per meter squared (kg/m2). Hospital-free days were defined as days out of the hospital in a 28-day period and were calculated using the date and time of ED arrival and hospital disposition. A patient who expired during admission received zero HFDs.
Outcome Measures
The primary outcome was the use of tidal volume (Vt) > 8 mL/kg IBW with mechanical ventilation in the ED. Secondary outcomes included the percentage of patients who had a tidal volume change in the ED, hospital-free days, and mortality.
Analysis
We used descriptive statistics and frequency distributions to compare patient characteristics. Categorical variables were compared using the chi-squared and Fisher exact test where appropriate. We compared continuous variables using the independent two-sample t -test or the Mann-Whitney U test as indicated. Data normality was assessed by examining kurtosis and skewness and inspection of histograms.
We developed a logistic regression model to analyze the relationship between receiving Vt > 8 mL/kg IBW and baseline patient demographics. A priori variables of known significance to the outcome (female gender, BMI >30 kg/m2) and clinically relevant and biologically plausible variables (age, first-quartile height) were included in the model. We used a multivariate backwards stepwise logistic regression model that selected variables sequentially for inclusion or exclusion at the 0.10 significance level. The model’s goodness-of-fit was assessed by the Hosmer-Lemeshow test and R-squared values. We reported adjusted odds ratios (aOR) and corresponding 95% CIs for all variables in the model. All tests used a two-tailed approach, and a P-value of < 0.05 was considered significant. A second multivariate analysis was performed using the same methodology, with
Western Journal of Emergency Medicine 504 Volume 24, NO.3: May 2023
al.
et
Self et al.
height, weight, female gender, age and Hispanic ethnicity, with variables selected based on biologic plausibility or results of univariate analysis.
RESULTS
Patient Demographics
We assessed a total of 1,073 cases for inclusion from the automatic query. Of these, 1,029 were included in the final study population. Patients were excluded for initial FiO2 <0.21 or >1.00 (8, 0.75%) (Figure 1). Data regarding length of stay and mortality was missing for 94 (9.14%) patients, primarily from the rural site, and were excluded from calculations of hospital-free days and mortality. Baseline characteristics are shown in Table 1. The mean age was 56 years, 31.2% of patients were female, 54.9% were identified as White, 13.5% were identified as Black, and 4.5% were identified as Asian. A total of 25.0% were identified as “Other Race or Mixed Race” patients. Of these, 73.9% were identified as having Hispanic ethnicity, compared to 14.2% of White patients and 23.5% of “Unknown” patients ( P <0.001). A total of 26.7% were identified as Hispanic patients. The median BMI was 25.9 (range 22.4-30.5), and 27.1% had a BMI > 30 kg/m 2. A total of 315 (30.6%) patients were in the first quartile of height (1.52-1.65 meters).
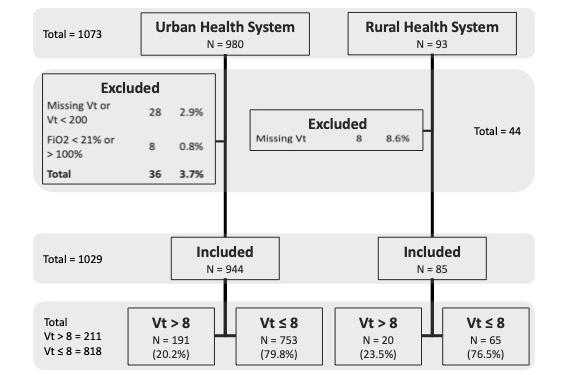
Intubation Indication, Initial Ventilator Settings and Modifications in the Emergency Department
Airway protection was the most common reason for intubation (44.1%), followed by primary respiratory failure
Disparities Exist in the Application of LTVV in the ED
(31.5%), cardiac arrest (12.6%), and refractory shock (11.5%). There was no clinically or statistically significant difference in intubation indication between patients who received Vt > 8 mL/kg IBW and those who did not (P = 0.91), nor was there a difference in Vt/IBW (P = 0.40). Initial ventilator settings in the ED, as well as changes to those settings while the patient remained in the ED are provided in Table 2. Most patients (65.5%) had an initial Vt between 6-8 mL/kg IBW, while 148 (14.0%) had an initial Vt < 6 mL/kg IBW, and 211 (20.5%) had an initial Vt > 8 mL/kg IBW. Initial tidal volume was most frequently set at either 500 mL (36.5%) or 450 mL (28.2%). Tidal volume was changed in the ED in 183 patients (17.8%). Only 4% of ventilator changes in the ED corrected non-LTVV to LTVV.
Low Tidal Volume Ventilation and Sex, Race and Ethnicity
A total of 211 patients (20.5%) had an initial Vt set at > 8 mL/kg IBW (Table 1). Patients who received Vt > 8 mL/ kg IBW were more frequently female than male (75.8% vs 19.7%, P < 0.001). Females also had a significantly higher Vt/ IBW than males (8.0 +/- 1.14 mL/kg vs 6.7 +/- 0.89 mL/kg, P < 0.001). Race was found to be significantly associated with Vt > 8 mL/kg IBW (P < 0.001). Specifically, patients who received Vt > 8 mL/kg IBW were more frequently identified as “Other or Mixed Race” (36.5% vs. 22.0%, P < 0.001), while those who received Vt ≤ 8 mL/kg IBW were more frequently identified as White (56.6% vs 48.3%, P < 0.001) or Black (14.9% vs 8.1%, P = 0.009), when compared against all other racial categories. Patients who received Vt > 8 mL/kg IBW were also more likely to be Hispanic (40.8% vs 23.0%, P < 0.001) as compared to non-Hispanic patients. Vt/IBW followed a similar trend, with a significant difference found between “Other or Mixed Race” patients and both Black and White patients (7.4 +/- 1.3 vs. 6.8 +/- 1.0 and 7.0 +/- 1.1, respectively, P < 0.001) as well as Hispanic patients and nonHispanic patients (7.4 +/- 1.3 vs 7.0 +/- 1.1, P < 0.001).
Low-tidal Volume Ventilation and Body Mass Index, Height Quartile, Comorbidities, and Maximum SOFA Score
Obese patients (BMI >/= 30 kg/m2) were more likely to receive Vt > 8 mL/kg IBW (40.8% vs 23.6%, P < 0.001) and had a higher Vt/IBW than patients without obesity (7.5 +/- 1.1 mL/kg vs 7.0 +/- 1.1 mL/kg, P < 0.001). Patients in the first quartile for height were more likely to receive Vt > 8 mL/kg IBW (82.5% vs 17.2%, P < 0.001) and had a higher Vt/IBW than patients in other quartiles (8.1 +/- 1.2 mL/ kg vs 6.7 +/- 0.81 mL/kg, P <0.001). Patients in all other quartiles were more likely to receive Vt ≤ 8 mL/kg IBW (P < 0.001 for all). Female, Hispanic, “Other or Mixed Race” and “Unknown race” patients more frequently had a first quartile height than male gender, and other ethnicities and races (68.5%, 43.7%, 41.2%, 52.9%, respectively; P < 0.001 for all). Patients who received Vt > 8 mL/kg IBW were
Volume 24, NO.3: May 2023 505 Western Journal of Emergency Medicine
Figure 1. Patient selection and exclusion. Tidal volume (Vt) > 8: tidal volume > 8 mL/kg ideal body weight. Vt ≤ 8: tidal volume ≤ 8 mL/kg ideal body weight.
ED, emergency department; MV, mechanical ventilation; Vt, tidal volume, FiO2, fraction of inspired oxygen.
Disparities Exist in the Application of LTVV in the ED Self
Notes: data are reported as mean (SD), median (IQR) or number (%). mL, milliliter; kg/M2 , kilogram, meter squared; Vt, tidal volume; IBW, ideal body weight; BMI, body mass index; CHF, congestive heart failure; SOFA, sequential organ failure assessment; CCI, Charlson Comorbidity Index; m, meter.
Western Journal of Emergency Medicine 506 Volume 24, NO.3: May 2023
et al.
Total N = 1,029 Initial Vt > 8 mL/kg IBW n = 211 (20.5%) Initial Vt ≤ 8 mL/kg IBW n = 818 (79.5%) Age, y 56.3 (17.2) 57.9 (18.2) 55.9 (16.8) Female, No. (%) 321 (31.2) 160 (75.8) 161 (19.7) Males, No. (%) 708 (68.8) 51 (24.2) 657 (80.3) Race, No. (%) Black 139 (13.5) 17 (8.1) 122 (14.9) Asian 46 (4.5) 9 (4.3) 37 (4.5) Native American 2 (0.2) 0 (0.0) 2 (0.2) Pacific Islander 3 (0.3) 1 (0.5) 2 (0.2) Other or mixed 257 (25.0) 77 (36.5) 180 (22.0) Unknown 17 (1.7) 5 (2.4) 12 (1.5) White 565 (54.9) 102 (48.3) 463 (56.6) Hispanic, No. (%) 274 (26.7) 86 (40.8) 188 (23.0) Weight (kg) 77.0 (65.7 – 91.0) 74.1 (63.4 – 87.2) 77.7 (56.0 – 92.0) BMI (kg/m2) 25.9 (22.4 – 30.5) 25.2 (21.9 – 29.6) 28.4 (24.8 – 33.9) BMI > 30, No. (%) 279 (27.1) 86 (40.8) 193 (23.6) Height quartile, No. (%) 1st (min. – 1.65 m) 315 (30.6) 174 (82.5) 141 (17.2) 2nd (1.66 m – 1.73 m) 258 (25.1) 28 (13.3) 230 (28.1) 3rd (1.74 m – 1.80 m) 253 (24.6) 8 (3.8) 245 (30.0) 4th (1.81 m – max.) 203 (19.7) 1 (0.5) 202 (24.7) Rural hospital, No. (%) 85 (8.3) 20 (9.5) 65 (7.9) Urban safety-net hospital, No. (%) 825 (80.1) 161 (76.3) 664 (81.2) Urban academic center, No. (%) 119 (11.6) 30 (14.2) 89 (10.9) Indication for intubation, No. (%) Airway protection 454 (44.1) 93 (44.1) 361 (44.1) Cardiac arrest 130 (12.6) 29 (13.7) 101 (12.3) Primary respiratory failure 324 (31.5) 63 (29.9) 261 (31.9) Refractory shock 121 (11.8) 26 (12.3) 95 (11.6) CCI Score (n = 915) 3 (1 – 6) 3 (1 – 6) 3 (1 – 6) Comorbidities, No. (%) n = 915 n = 183 n = 732 Cancer 148 (16.2) 27 (14.8) 121 (16.5) Cerebrovascular disease 216 (23.6) 48 (26.2) 168 (23.0) CHF 262 (28.6) 53 (29.0) 209 (28.6) Chronic lung disease 292 (31.9) 62 (33.9) 230 (31.4) Diabetes mellitus 256 (28.0) 65 (35.5) 191 (26.1) HIV 29 (3.2) 3 (1.6) 26 (3.6) Liver disease 219 (23.9 37 (20.2) 182 (24.9) Myocardial infarction 117 (12.8) 22 (12.0) 95 (13.0) Renal disease 195 (21.3) 38 (20.8) 157 (21.4) Max. SOFA score (n = 652) 9 (4) 9 (4) 9 (4) Length of stay (min.; n = 935) 313 (234 – 468) 313 (215 – 484) 314 (236 – 461) Boarding time (min.; n = 935) 139 (86 – 229) 134 (90 – 232) 140 (85 – 228)
Table 1. Study population characteristics.
Notes: data are reported as mean (SD), median (IQR) or number (%). mL, milliliter; kg/M2 , kilogram, meter squared; Vt, tidal volume; IBW, ideal body weight; BMI, body mass index; CHF, congestive heart failure; SOFA, sequential organ failure assessment; CCI, Charlson Comorbidity Index; m, meter.
Initial Vt >10 mL/kg IBW
(1.9)
IBW, ideal body weight; Vt, tidal volume; mL, mililiter; kg, kilogram; ED, emergency department.
more likely to have diabetes (35.5% vs 26.1%, P = 0.01); otherwise, there were no differences between the groups. The mean maximum SOFA score of 9 was the same between the groups and overall cohort.
Low-tidal Volume Ventilation and Outcomes
There was no difference in hospital mortality for patients who received at least 48 hours of mechanical ventilation with high and low tidal volume volumes (9.4% vs 11.8%, P = 0.40), nor was there a significant difference in Vt/IBW between patients who died compared to those who survived (7.0 +/- 1.2 mL/kg vs 7.1 +/- 1.1 mL/kg, P = 0.21). However, there was a significant reduction in hospital-free days for patients who received LTVV compared to those who did not (8.9 days vs 11.0 days, P = 0.03).
Multivariate Regression Analysis
Age, female gender, BMI > 30 kg/m2 and first-quartile height were included a priori in the multivariate regression analysis. Table 3 shows the results of the multivariate regression analysis.
First-quartile height and female gender were strongly associated with receiving Vt > 8 (aOR 12.2, P < 0.001 and aOR 4.17, P < 0.001, respectively). BMI >30 kg/m2 (aOR 2.27, P < 0.001) was also independently associated with
odds ratio;
index; ED, emergency department.
receiving Vt > 8. Age was not significantly associated with receiving Vt > 8 mL/kg IBW. These associations persisted in second multivariate analysis performed, with strong associations between height, weight, female gender, and receiving Vt > 8 mL/kg IBW. There was no association between Hispanic ethnicity and Vt > 8 mL/kg IBW in this second analysis.
DISCUSSION
Our analysis is the largest to date showing that female gender, first quartile height, and obesity are independently associated with receiving Vt > 8 mL/kg IBW in ED patients. Also, we showed that physicians use a narrow range of convenient, round tidal volumes (450 mL, 500 mL) with overall poor correlation to anthropomorphic characteristics such as height, weight, and BMI. Although this practice resulted in over 80% of patients receiving LTVV, we found that female gender and Hispanic ethnicity were factors associated with receiving non-LTVV, and these patients were more often in the first quartile for height. Finally, we found that these ED tidal volume disparities and practice patterns were associated with 2.1 fewer hospital-free days.
We speculate that emergency physicians infrequently use a height-based calculation for tidal volume, rather using a narrow range of seemingly preset volumes. Tidal volumes of either 400, 450, or 500 mL were used in 81.9% of patients. Only 6.2% of patients received a Vt < 400 mL, which represents the upper limit of the LTVV goal for a man 60 inches tall or a woman 62 inches tall. This could in part explain why the 13.1% of our cohort that was <62 inches was significantly less likely to receive LTVV. While Wiess et al made similar observations and hypotheses in their 2016 study of ICU patients, ours extends this observation to ED
Volume 24, NO.3: May 2023 507 Western Journal of Emergency Medicine Self et al. Disparities
in the Application of LTVV in the ED Total N = 1,029 Initial Vt > 8 mL/kg IBW n = 211 (20.5%) Initial Vt ≤ 8 mL/kg IBW n = 818 (79.5%) Mortality, admitted ≥48 hrs, No. (%) 116 (23.4) 20 (9.4%) 96 (11.8%) Hospital-free days (d.; n = 904) 10.4 (15.3) 8.9 (±11.4) 11.0 (±16.6)
Exist
Table 1. Continued.
Variable aOR 95% CI SE P-value Age 0.997 0.986 – 1.01 0.01 0.56 Female sex 4.17 2.73 – 6.36 0.22 < 0.001 BMI >30 2.27 1.49 – 3.47 0.22 < 0.001 1st quartile height 12.2 7.81 – 19.0 0.23 < 0.001
aOR,
SE,
BMI,
mass
Table 2. Initial tidal volume settings and changes.
adjusted
standard error;
body
Variable (N = 1,029) No. (%) Initial Vt, range 270 – 700 Initial Vt 600 mL 22 (2.1) Initial Vt 550 mL 56 (5.4) Initial Vt 500 mL 376 (36.5) Initial Vt 450 mL 290 (28.2) Initial Vt 400 mL 177 (17.2) Initial Vt 350 mL 36 (3.5) Vt Changed in ED 183 (17.8) Initial Vt 6-8 mL/kg IBW 674 (65.5) Initial Vt < 6 mL/kg IBW 144 (14.0) Initial Vt >8 mL/kg IBW 191 (18.6)
Table 3. Multivariate regression analysis results (N=1,029).
20
Disparities Exist in the Application of LTVV in the ED Self
patients.10,31 That the shortest patients in our cohort received the highest Vt/IBW fits with this conclusion.
Furthermore, patients were unlikely to have tidal volume adjusted in the ED, with only 18% of patients having a change. Of patients with a Vt change, 22% were changed from a non-LTVV to LTVV and 12% were changed from LTVV to non-LTVV. While Vt changes away from LTVV appear concerning, there are several plausible reasons to make such an adjustment that our study did not account for (ie, severe acidosis requiring higher minute ventilation). More importantly, our study shows that few ED patients will receive a Vt adjustment, emphasizing the importance of appropriate initial ventilator settings. Furthermore, it is imperative to remember that height based Vts are a convenient initial estimate that must be fine-tuned based on the individual patients’ pulmonary mechanics, the management of which is outside the scope of this work.
Importantly, we demonstrated that this practice pattern results in female and Hispanic patients, who were more often in the first quartile for height, receiving non-LTVV more frequently, an important disparity given that nonLTVV was associated with fewer hospital-free days. We found no association between Hispanic ethnicity and Vt > 8 mL/kg IBW when controlling for height and gender in a sensitivity analysis, supporting this conclusion. Although the “Other or Mixed Race” racial category was also associated with non-LTVV we suspect that there is significant overlap between this grouping and Hispanic ethnicity. Over 74% of “Other or Mixed Race” patients also identified as Hispanic, significantly more than any other racial group, and these groups had an identical Vt/IBW. While multiple studies have demonstrated disparities in topics ranging from analgesic practices, intensity of ICU care, and outcomes from critical illness, ours is the first to our knowledge to do so with respect to LTVV in the ED.32,33 Unlike many healthcare disparities with complicated origins, a simple change in practice pattern from “preset” tidal volumes to a calculated, height-based tidal volume could mitigate this issue.
While first-quartile height had the strongest association, the presence of obesity and female sex were also independently associated with non-LTVV. We hypothesize that obesity may cause physicians to overestimate patients’ tidal volume, supported by the observation that obesity is associated with a higher Vt/IBW compared to non-obese patients. We also suspect that female gender led physicians to overestimate patients’ tidal volume demands for reasons beyond the association between female gender and firstquartile height. Commonly used models for the prediction of IBW estimate lower weights for women than for men of the same height.30 It is possible that this consideration is underappreciated when estimating tidal volume requirements. Similarly, we suspect that the tidal volume demand of patients of first-quartile height was frequently overestimated. It has
previously been shown that clinicians perform poorly at estimating the height of patients.34
The patients in our cohort who did not receive LTVV had 2.1 fewer hospital-free days than those who received LTVV (8.9 vs 11.0, P = 0.04). This observation is consistent with several recent studies showing that initiation of LTVV as part of a lung-protective strategy in the ED is associated with better patient outcomes. While we did not find a significant difference in mortality, prior studies utilizing LTVV as part of a multifaceted lung protective ventilation strategy have done so when adjusting for comorbidities and illness severity.9-11 While the reason for this is uncertain, there are several possibilities. First is that we assessed a single component of a lung-protective ventilation strategy and did not analyze PEEP or other ventilator settings included in other ED-based investigations, such as the LOVED trial by Fuller et al.10 Second, we did not include severity of illness as a covariate in our analysis due to insufficient data. Third, although the data supporting the use of LTVV is strongest for patients with or at risk for ARDS, we did not include presence of ARDS due to insufficient data. Despite this, our analysis shows that the demographic variability in the application of LTVV has meaningful clinical consequences and thus warrants intervention.
We believe that the patient characteristics identified in our analysis as risk factors for inappropriately high tidal volumes can serve as targets for improvement. A 2021 trial by Tallman et al showed that providing respiratory therapists with a tape measure increased the rate of LTVV in the ED/ICU patients.35 This low-cost, practical intervention would allow measured height to guide Vt, rather than estimated height or absolute body weight. Finally, we hope that awareness of the trend that certain demographics are less likely to receive LTVV will contribute to the collective cognitive effort to reduce healthcare disparities.
LIMITATIONS
Our study has several limitations. With a retrospective design, our study could only show associations and was vulnerable to incomplete and inaccurate documentation. Mortality and hospital-free days data was missing from approximately 9% of patients and was excluded from those calculations, which may have affected outcomes data. Race and ethnicity data was abstracted from the EHR and the source of this information was not available, making it subject to reporting bias, although both institutions place major emphasis on self-reported demographic information. The Pew Research Center has shown that Hispanic patients are often confused by or do not relate to the survey category of “White, Hispanic,” and instead identify as “other or mixed.”36 Accordingly, a significant association was detected between Hispanic ethnicity and other/mixed race in our population. Due to limitations in our retrospective dataset, we did not
Western Journal of Emergency Medicine 508 Volume 24, NO.3: May 2023
al.
et
include the presence of or risk factors for ARDS, which may have influenced outcome data.
CONCLUSION
Female gender, obesity (body mass index > 30), and firstquartile height are independently associated with receiving non-low-tidal volume ventilation in the ED. Emergency physicians use a narrow range of default initial tidal volumes that may not meet lung-protective ventilation goals for many patients, with few corrections. Future prospective studies are required to validate these findings.
Address for Correspondence: Gabriel Wardi, MD, UC San Diego, Department of Internal Medicine, Division of Pulmonary Critical Care Anesthesiology, 200 W Arbor Dr. MC8676, San Diego, CA 92103. Email: gwardi@health.ucsd.edu.
Conflicts of Interest: By the WestJEM article submission agreement, all authors are required to disclose all affiliations, funding sources and financial or management relationships that could be perceived as potential sources of bias. Dr. Malhotra is funded by the National Institutes of Health (NIH). He reports income related to medical education from Eli Lilly, Jazz, Zoll, and Livanova. ResMed provided a philanthropic donation to the University of California at San Diego (UCSD). Dr. Malhotra is a cofounder of Healciscio, a medical startup forming in approval with the UCSD and in accordance with the UCSD‘s conflicts of interest management policies. Dr. Wardi has been supported by the NIH (R35GM143121, K23GM146092) in the past year. There are no conflicts of interest to declare.
Copyright: © 2023 Self et al. This is an open access article distributed in accordance with the terms of the Creative Commons Attribution (CC BY 4.0) License. See: http://creativecommons.org/ licenses/by/4.0/
8. Serpa Neto A, Cardoso SO, Manetta JA, et al. Association between use of lung-protective ventilation with lower tidal volumes and clinical outcomes among patients without acute respiratory distress syndrome: a meta-analysis. JAMA. 2012;308(16):1651.
9. Fuller BM, Mohr NM, Miller CN, et al. Mechanical ventilation and ARDS in the ED. Chest. 2015;148(2):365-74.
10. Fuller BM, Ferguson IT, Mohr NM, et al. Lung-protective ventilation initiated in the emergency department (LOV-ED): a quasiexperimental, before-after trial. Ann Emerg Med. 2017;70(3):406-18. e4.
11. Fernando SM, Fan E, Rochwerg B, et al. Lung-protective ventilation and associated outcomes and costs among patients receiving invasive mechanical ventilation in the ED. Chest. 2021;159(2):60618.
12. Needham DM, Yang T, Dinglas VD, et al. Timing of low tidal volume ventilation and intensive care unit mortality in acute respiratory distress syndrome. a prospective cohort study. Am J Respir Crit Care Med. 2015;191(2):177-85.
13. Needham DM, Colantuoni E, Mendez-Tellez PA, et al. Lung protective mechanical ventilation and two-year survival in patients with acute lung injury: prospective cohort study. BMJ 2012;344:e2124.
14. Owyang CG, Kim JL, Loo G, et al. The effect of emergency department crowding on lung-protective ventilation utilization for critically ill patients. J Crit Care. 2019;52:40-47.
15. Asplin BR, Magid DJ, Rhodes KV, et al. A conceptual model of emergency department crowding. Ann Emerg Med. 2003;42(2):17380.
16. Richardson DB. The access-block effect: relationship between delay to reaching an inpatient bed and inpatient length of stay. Med J Aust. 2002;177(9):492-5.
17. Halpern NA, Pastores SM. Critical care medicine in the United States 2000–2005: an analysis of bed numbers, occupancy rates, payer mix, and costs. Crit Care Med. 2010;38(1):65-71.
REFERENCES
1. Simon EL, Smalley CM, Meldon SW, et al. Procedural frequency: results from 18 academic, community and freestanding emergency departments. J Am Coll Emerg Physicians Open. 2020;1(6):1669-75.
2. Green RS, McIntyre J. The provision of critical care in emergency departments at Canada. J Emerg Trauma Shock. 2011;4(4):488-93.
3. Easter BD, Fischer C, Fisher J. The use of mechanical ventilation in the ED. Am J Emerg Med. 2012;30(7):1183-8.
4. Slutsky AS, Ranieri VM. Ventilator-induced lung injury. N Engl J Med 2013;369(22):2126-36.
5. Brochard L, Slutsky A, Pesenti A. Mechanical ventilation to minimize progression of lung injury in acute respiratory failure. Am J Respir Crit Care Med. 2017;195(4):438-42.
6. The ARDS Network. Ventilation with lower tidal volumes as compared with traditional tidal volumes for acute lung injury and the acute respiratory distress syndrome. N Engl J Med. 2000;342(18):1301-8.
7. Malhotra A. Low-tidal-volume ventilation in the acute respiratory distress syndrome. N Engl J Med. 2007;357(11):1113-20.
18. Mohr NM, Wessman BT, Bassin B, et al. Boarding of critically ill patients in the emergency department. Crit Care Med 2020;48(8):1180-7.
19. Bazarian JJ, Pope C, McClung J, et al. Ethnic and racial disparities in emergency department care for mild traumatic brain injury. Acad Emerg Med. 2003;10(11):1209-17.
20. Goyal MK, Kuppermann N, Cleary SD, et al. Racial disparities in pain management of children with appendicitis in emergency departments. JAMA Pediatr. 2015;169(11):996-1002.
21. Preciado SM, Sharp AL, Sun BC, et al. Evaluating sex disparities in the emergency department management of patients with suspected acute coronary syndrome. Ann Emerg Med. 2021;77(4):416-24.
22. Swart P, Deliberato RO, Johnson AEW, et al. Impact of sex on use of low tidal volume ventilation in invasively ventilated ICU patients—a mediation analysis using two observational cohorts. Zivkovic AR, ed. PLoS ONE. 2021;16(7):e0253933.
23. Han S, Martin GS, Maloney JP, et al. Short women with severe sepsis-related acute lung injury receive lung protective ventilation
Volume 24, NO.3: May 2023 509 Western Journal of Emergency Medicine Self et al. Disparities Exist in the Application of LTVV in the ED
Disparities Exist in the Application of LTVV in the ED Self et
less frequently: an observational cohort study. Crit Care 2011;15(6):R262.
24. Erickson SE, Shlipak MG, Martin GS, et al. Racial and ethnic disparities in mortality from acute lung injury. Crit Care Med 2009;37(1):1-6.
25. Hibbert K, Rice M, Malhotra A. Obesity and ARDS. Chest 2012;142(3):785-90.
26. Isenberg DL, Bloom B, Gentile N, et al. Males receive low-tidal volume component of lung protective ventilation more frequently than females in the emergency department. West J Emerg Med 2020;21(3):684-7.
27. von Elm E, Altman DG, Egger M, et al. The Strengthening the Reporting of Observational Studies in Epidemiology (STROBE) statement: guidelines for reporting observational studies. Ann Intern Med. 2007;147(8):573-7.
28. Flanagin A, Frey T, Christiansen SL, AMA Manual of Style Committee. Updated guidance on the reporting of race and ethnicity in medical and science journals. JAMA. 2021;326(7):621-7.
29. Charlson ME, Pompei P, Ales KL, et al. A new method of classifying prognostic comorbidity in longitudinal studies: development and validation. J Chronic Dis. 1987;40(5):373-83.
30. Peterson CM, Thomas DM, Blackburn GL, et al. Universal equation for estimating ideal body weight and body weight at any BMI. Am J Clin Nutr. 2016;103(5):1197-203.
31. Weiss CH, Baker DW, Weiner S, et al. Low tidal volume ventilation use in acute respiratory distress syndrome. Crit Care Med. 2016;44(8):1515-22.
32. Meghani SH, Byun E, Gallagher RM. Time to take stock: a metaanalysis and systematic review of analgesic treatment disparities for pain in the United States. Pain Med. 2012;13(2):150-74.
33. Soto GJ, Martin GS, Gong MN. Healthcare disparities in critical illness. Crit Care Med. 2013;41(12):2784-93.
34. Maskin LP, Attie S, Setten M, et al. Accuracy of weight and height estimation in an intensive care unit. Anaesth Intensive Care. 2010;38(5):930-4.
35. Ives Tallman CM, Harvey CE, Laurinec SL, et al. Impact of providing a tape measure on the provision of lung-protective ventilation. West J Emerg Med. 2021;22(2):389-93.
36. Gonzalez-Barrera A, Lopez MH. Is being Hispanic a matter of race, ethnicity or both? Pew Research Center. Available at: https://www. pewresearch.org/fact-tank/2015/06/15/is-being-hispanic-a-matter-ofrace-ethnicity-or-both/. Accessed March 8, 2022.
Western Journal of Emergency Medicine 510 Volume 24, NO.3: May 2023
al.
Ratio of Oxygen Saturation to Inspired Oxygen, ROX Index, Modified ROX Index to Predict High Flow Cannula Success in COVID-19 Patients: Multicenter Validation Study
Onlak Ruangsomboon, MD*
Supawich Jirathanavichai, MD*
Nutthida Phanprasert, MD*
Chanokporn Puchongmart, MD†
Phetsinee Boonmee, MD‡
Netiporn Thirawattanasoot, MD§
Thawonrat Dorongthom, MD||
Apichaya Monsomboon, MD*
Nattakarn Praphruetkit, MD*
Section Editor: Quincy Tran, MD, PhD
Mahidol University, Siriraj Hospital, Department of Emergency Medicine, Bangkok, Thailand
Banphaeo General Hospital, Department of Emergency Medicine, Samutsakhon, Thailand
Ratchaburi Hospital, Department of Emergency Medicine, Ratchaburi, Thailand
Buddhachinaraj Phitsanulok Hospital, Department of Emergency Medicine and Forensic Medicine, Phitsanulok, Thailand
Prachuap Khiri Khan Hospital, Department of Emergency Medicine and Forensic Medicine, Prachuap Khiri Khan, Thailand
Submission history: Submitted: August 7, 2022; Revision received January 27, 2023; Accepted February 11, 2023
Electronically published April 28, 2023
Full text available through open access at http://escholarship.org/uc/uciem_westjem
DOI: 10.5811/westjem.58311
Introduction: High-flow nasal cannula (HFNC) is a respiratory support measure for coronavirus 2019 (COVID-19) patients that has been increasingly used in the emergency department (ED). Although the respiratory rate oxygenation (ROX) index can predict HFNC success, its utility in emergency COVID-19 patients has not been well-established. Also, no studies have compared it to its simpler component, the oxygen saturation to fraction of inspired oxygen (SpO2/FiO2 [SF]) ratio, or its modified version incorporating heart rate. Therefore, we aimed to compare the utility of the SF ratio, the ROX index (SF ratio/respiratory rate), and the modified ROX index (ROX index/heart rate) in predicting HFNC success in emergency COVID-19 patients.
Methods: We conducted this multicenter retrospective study at five EDs in Thailand between January–December 2021. Adult patients with COVID-19 treated with HFNC in the ED were included. The three study parameters were recorded at 0 and 2 hours. The primary outcome was HFNC success, defined as no requirement of mechanical ventilation at HFNC termination.
Results: A total of 173 patients were recruited; 55 (31.8%) had successful treatment. The two-hour SF ratio yielded the highest discrimination capacity (AUROC 0.651, 95% CI 0.558-0.744), followed by two-hour ROX and modified ROX indices (AUROC 0.612 and 0.606, respectively). The two-hour SF ratio also had the best calibration and overall model performance. At its optimal cut-point of 128.19, it gave a balanced sensitivity (65.3%) and specificity (61.8%). The two-hour SF≥128.19 was also significantly and independently associated with HFNC failure (adjusted odds ratio 0.29, 95% CI 0.13-0.65; P=0.003).
Conclusion: The SF ratio predicted HFNC success better than the ROX and modified ROX indices in ED patients with COVID-19. With its simplicity and efficiency, it may be the appropriate tool to guide management and ED disposition for COVID-19 patients receiving HFNC in the ED. [West J Emerg Med. 2023;24(3)511–521.]
Volume 24, NO.3: May 2023 511 Western Journal of Emergency Medicine * † ‡ § || Original
Research
INTRODUCTION
Coronavirus disease 2019 (COVID-19) is an infectious disease caused by the severe acute respiratory syndrome coronavirus 2 that has infected millions of individuals worldwide.1 Its emergence has been regarded as a worldwide public health emergency that has prompted the transformation of healthcare systems, including those of the emergency department (ED).2 Appropriate and effective treatment of acute hypoxemic respiratory failure (AHRF) due to COVID-19 early in the ED is essential to improve patients’ outcomes.
High-flow nasal cannula (HFNC), an oxygen-delivering technique whereby heated and humidified air is delivered with positive pressure generated, has been proven to be an effective initial respiratory support measure for patients with AHRF of many etiologies in both inpatient and ED settings.3-6 It has also been used successfully as a non-invasive airway management strategy for AHRF in COVID-19 patients.7,8 Nevertheless, HFNC therapy should always be administered with caution, as its failure may result in delayed intubation and increased mortality.9,10 Therefore, predicting HFNC success or failure and determining the optimal timing of treatment escalation to invasive mechanical ventilation are critical to avoid delayed intubation and possibly prevent mortality.
The ROX (respiratory rate oxygenation) index, a ratio of oxygen saturation (SpO2)/fraction of inspired oxygen (FiO2) to respiratory rate, has been demonstrated to be a reliable predictor of HFNC success for AHRF patients in the intensive care unit (ICU) and inpatient settings.11,12 Many studies have externally validated the ROX index as a predictor of HFNC outcomes for COVID-19 patients; however, reported results were inconsistent, possibly due to different clinical settings and cut-points employed, as well as heterogeneous population.13–16 The modified ROX index is another index incorporating heart rate (HR) to the original ROX index, which has been shown to be a good predictor of HFNC outcomes for HFNC application post-extubation.17 However, no studies have validated its utility in COVID-19 patients.
The SpO2/FiO2 (SF) ratio can also be employed as a predictive marker for HFNC outcomes.18 The SF ratio may even have superior prognostic utility to the ROX or the modified ROX indices for COVID-19 pneumonia, a specific condition in which patients usually do not present with an abnormal respiratory pattern despite severe hypoxia.19 Therefore, respiratory rate, a component of both types of ROX indices, may not be a good predictor of HFNC outcomes in COVID-19 patients. Although a previous study reported a superior prognosticating ability of the SF ratio over the ROX index in COVID-19 patients, it was a single-center study conducted in an inpatient setting.20
No studies have validated and compared the SF ratio with the ROX index or its modified version in the ED setting, where HFNC is usually initiated earlier in the disease course. Consequently, we conducted this study to evaluate and compare the prognostic utility of the SF ratio, the ROX index,
Population Health Research Capsule
What do we already know about this issue?
The respiratory rate oxygenation (ROX) index is a validated predictor of high-flow nasal cannula success only in non-COVID-19 patients.
What was the research question?
Our goal was to compare the prognostic utility of the SpO2/FiO2 ratio, ROX, and modified ROX index in COVID-19 patients.
What was the major finding of the study?
The two-hour SpO2/FiO2 ratio has the best discriminative ability (AUROC 0.651, 95% CI 0.558-0.744).
How does this improve population health?
For emergency COVID-19 patients, the SpO2/ FiO2 ratio should be used for prognostication instead of the ROX or modified ROX indices.
and the modified ROX index in predicting HFNC success in patients with AHRF secondary to COVID-19 in the ED.
METHODS Study Design and Setting
This multicenter retrospective observational study was conducted between January 1–December 31, 2021 at five EDs in Thailand. A variety of EDs from various regions of the country, including those of university hospitals and secondaryand tertiary-level hospitals, participated in the study. The five study centers were Siriraj Hospital (the nation’s largest tertiary university hospital); Banphaeo Hospital (a large general hospital); Ratchaburi Hospital (a provincial teaching hospital); Buddhachinaraj hospital (a tertiary regional advanced-level hospital); and Prachuap Khiri Khan hospital (a general standard-level hospital). The Central Research Ethics Committee of Thailand approved the study (certificate number CREC044/2022). Due to its retrospective nature, informed consent was waived. The study was reported according to the STROBE guidelines.21
Participants
Adult patients over 18 years of age diagnosed with AHRF due to COVID-19 who received HFNC in the ED were included. We excluded COVID-19 patients who did not receive HFNC therapy initiated in the ED. Also excluded were
Western Journal of Emergency Medicine 512 Volume 24, NO.3: May 2023 SF Ratio, ROX, Modified ROX to Predict HFNC Success in COVID-19 Patients Ruangsomboon et al.
Ruangsomboon et al. SF Ratio, ROX, Modified ROX to Predict HFNC Success in COVID-19 Patients
those with a do-not-intubate order who received HFNC for palliative purposes.
Study Process and Data Collection
Using International Classification of Diseases, 10th Revision, codes, we retrospectively reviewed consecutive patients visiting the participating EDs with the diagnosis of COVID-19 infection made before or within the index ED visit. Their electronic health records were reviewed to determine whether they had received HFNC in the ED. We used this data if all the inclusion and exclusion criteria were satisfied. With retrospective chart review performed by trained data abstractors at each study center,22 we recorded the patients’ baseline characteristics, physiologic parameters, relevant blood examination results, HFNC settings, co-treatments, and important clinical outcomes.
Parameters required for calculating the SF ratio, the ROX index, and the modified ROX index were recorded before HFNC application (hour 0) and at 2 hours after HFNC initiation. All these parameters were measured while the patients were still in the ED awaiting disposition. The decisions to initiate HFNC to the patients, adjust HFNC settings, and escalate the treatment toward a more invasive respiratory support measure were determined by the attending physicians at each study center. Another study coordinator double-checked the recorded data in the electronic case-report forms to ensure the reliability and accuracy of the study data.
Study Parameters and Outcomes
At 0 and 2 hours after HFNC initiation, we calculated three parameters and assessed them for their utility in predicting HFNC outcomes: the SF ratio; the ROX index; and the modified ROX index. The SF ratio was calculated from the ratio of SpO2 to FiO2.18 The ROX index was calculated from the ratio of SpO2/ FiO2 to respiratory rate,11 and the modified ROX index was defined as the ratio of the ROX index over heart rate multiplied by 100.17 The primary outcome was HFNC success, defined as no requirement of mechanical ventilation following HFNC treatment at HFNC termination. The secondary outcome was overall treatment failure, defined as a requirement of escalation to mechanical ventilation following HFNC termination or mortality at hospital discharge.23,24
Statistical Analyses
We employed descriptive statistics to describe patients’ characteristics. Categorical data is reported as frequency and percentage. Continuous variables are reported as mean and standard deviation (SD) or median and interquartile range for normally distributed and non-normally distributed data, respectively, evaluated based on histograms and Q-Q plots. We compared these variables between the success and failure groups by using the chi-squared or Fisher exact test for categorical data and an independent t-test or the Mann-Whitney U test for continuous data.
As an external validation study, the predictive performance
of the SF ratio, the ROX index, and the modified ROX index for the study outcomes were assessed primarily with their discrimination and calibration capacities, coupled with other additional analyses.25 We chose the parameter with an overall superior ability over the others among all analyses performed as the best parameter in predicting the study outcomes.25-27 We reported the discrimination of each parameter with the area under the receiver operator characteristics curve (AUROC) and its 95% confidence interval (CI). We also made comparisons between the AUROCs of the study parameters for each study outcome.28 Calibration was reported with calibration plots and the HosmerLemeshow test.29,30
Moreover, we evaluated overall model performance using the Nagelkerke R-squared. A parameter that could yield a higher R-squared value should perform better than others.31,32 We also evaluated the clinical usefulness of the parameters at the optimal cut-off values according to the Youden index by reporting their sensitivity, specificity, positive likelihood ratio, negative likelihood ratio, negative predictive value, positive predictive value, and diagnostic odds ratio. We also performed univariate and multivariate logistic regression analyses to identify independent predictors of adverse clinical outcomes: HFNC failure and overall treatment failure.
Age, gender, body mass index, day of symptoms, Charlson Comorbidity Index, Sequential Organ Failure Assessment (SOFA) score, D-dimer, C-reactive protein, and steroid were determined a priori based as existing evidence as potential associating variables with HFNC outcomes to be adjusted for in the multivariate models. We included variables with univariate P-value <0.2 in the multivariate regression model for each outcome. Nonetheless, each multivariate model evaluated only one potential predictor value among the three parameters at one time point to avoid multicollinearity.
We performed all statistical analyses using SPSS version 18.0 (IBM Corporation, Armonk, NY), R version 3.6.1 (R Foundation for Statistical Computing, Vienna, Austria) with the rms, Hmisc, foreign, pROC, sciplot, and dca packages, and MedCalc for Windows version 19 (MedCalc Software, Ltd, Ostend, Belgium).
RESULTS Study Population
Between January 1–December 31, 2021, a total of 978 COVID-19 patients visited the participating EDs. Of these, 184 patients were treated with HFNC initiated in the ED and 11 (6%) had do-not-intubate status. Consequently, 173 patients were included in the study. Their characteristics are shown in Table 1. Of all the included patients, 92 were male (53.2%), and their mean age was 64.8±16.2 years. A total of 118 patients (68.2%) were successfully treated with HFNC, while the other 55 (31.8%) were mechanically ventilated at HFNC termination. Meanwhile, 87 patients met the criteria for overall treatment failure, and 72.4% of them had mortality at hospital discharge. The HFNC failure group had significantly
Volume 24, NO.3: May 2023 513 Western Journal of Emergency Medicine
SF Ratio, ROX, Modified ROX to Predict HFNC Success in COVID-19 Patients
Note: Data is presented as frequency (percentage), mean ± SD or median [interquartile range] as appropriate. HFNC, high-flow nasal cannula; ICU, intensive care unit; ED, emergency department.
Western Journal of Emergency Medicine 514 Volume 24, NO.3: May 2023
al. Characteristic Success (n=118) Failure (n=55) P-value Gender, male 61 (51.7) 31 (56.4) 0.57 Age, years 66.3±17.1 61.2±13.6 0.04 Body mass index (kg/m2) 27.3±7.1 27.5±7.7 0.85 Day of symptoms upon arrival 5.5 [4.3] 5 [4.0] 0.50 Underlying diseases Chronic pulmonary disease 13 (11.0) 5 (9.1) 0.70 Cardiovascular disease 17 (14.4) 8 (14.5) 0.98 Diabetes mellitus 45 (38.1) 19 (34.5) 0.65 Chronic kidney disease 16 (13.6) 12 (21.8) 0.17 Charlson Comorbidity Index 1 [3] 1 [3] 0.40 Initial vital signs Systolic blood pressure 140.8±27.4 144.0±30.9 0.50 Diastolic blood pressure 79.0±15.9 81.7±17.6 0.31 Pulse rate 94.6±20.1 98.0±21.5 0.31 Respiratory rate 35.2±8.1 35.5±6.3 0.79 Pulse oximetry 86 [13.5] 82.5 [15.0] 0.09 Glasgow Coma Scale 15 [0] 15 [0] 0.21 Initial blood examination White blood cells (x1000/mm3) 7.8 [4.6] 8.9 [4.8] 0.52 Platelet (x1,000/mm3) 240.1±113.6 226.1±98.2 0.44 Glomerular filtration rate (mL/min) 68.8±33.2 65.3±30.6 0.51 D-dimer (mg/L) 1.2 [2.6] 1.1 [1.8] 0.22 C-reactive protein (mg/L) 108.1 [99.5] 106.3 [92.8] 0.58 Sequential Organ Failure Assessment score 3.0±1.9 2.9±1.6 0.71 HFNC settings Temperature (ºC) 34 [3] 34 [3] 0.79 Flow (L/min) 51.2±6.0 51.6±4.8 0.67 Fraction of inspired oxygen 0.67±0.13 0.75±0.15 0.001 HFNC treatment duration, day 6.2 [5.5] 1.9 [3.9] <0.001 Co-treatment Steroid 115 (97.5) 55 (100) 0.23 Favipiravir 113 (95.8) 52 (94.5) 0.72 Remdesivir 41 (34.7) 27 (49.1) 0.07 Tocilizumab 16 (13.6) 9 (16.4) 0.63 Vasopressor 10 (8.5) 34 (61.8) <0.001 Continuous renal replacement therapy 7 (5.9) 8 (14.5) 0.06 Complication Bacterial pneumonia 32 (27.1) 22 (40.0) 0.09 Acute respiratory distress syndrome 14 (11.9) 41 (74.5) <0.001 Septic shock 12 (10.2) 33 (60.0) <0.001 ICU admission 25 (21.2) 44 (80.0) <0.001 ED length of stay, hour 24 [40] 26 [40] 0.80
Ruangsomboon et
Table 1. Patient characteristics by high-flow nasal cannula success status.
Note: Data is presented as frequency (percentage), mean ± SD or median [interquartile range] as appropriate. HFNC, high-flow nasal cannula; ICU, intensive care unit; ED, emergency department.
higher mean age than the success group (Table 1). Otherwise, baseline demographics and initial physiologic variables were generally comparable between the two groups. Nevertheless, the failure group required higher FiO2 on HFNC, were on HFNC for a shorter duration, and had more complications and longer hospital length of stay than the success group (Table 1).
Study Parameters
There were no missing values for any parameters evaluated at either the 0- or 2-hour time points. We included all 173 samples in the analyses for both time points because no outcome events occurred prior to the two-hour time point at which the second parameter values were measured. The mean values of the three indices were lower in the HFNC failure group than in the success group; however, only the parameters measured at two hours were significantly different between the groups for both study outcomes (Table 2). Distributions of the parameter values among the study population are shown in Figure 1. For all parameters, a higher proportion of patients with higher parameter values were those with overall treatment success, implying strong associations between the parameter values and overall treatment failure (Figure 1D-1F). However, such trends and associations were not as prominent for any parameters with HFNC success (Figure 1A-1C).
Parameters’ Performance
The ROC curves of all parameters are shown in Figure 1S, and their AUROCs are presented in Table 3. The SF ratio measured at two hours post-HFNC application had the highest discriminating capacity (AUROC 0.651, 95% CI 0.558-0.744),
followed by the two-hour ROX index (AUROC 0.612, 95% CI 0.516-0.707), and two-hour modified ROX index (AUROC 0.606, 95% CI 0.512-0.700). However, none of these AUROCs were significantly different from each other (P-value for difference among AUROCs=0.80). Similarly, the two-hour SF ratio could yield higher AUROC for overall treatment failure than the two-hour ROX and modified ROX indices (Table 3), but these AUROCs were also not significantly different (P-value=0.21). The parameters measured at hour 0 all had lower discrimination than those at two hours for both study outcomes (Table 3).
The two-hour SF ratio was the parameter with the best overall performance based on the Nagelkerke R-squared for both study outcomes (Table 3). Calibration based on the Hosmer-Lemeshow tests also showed that the two-hour SF ratio calibrated well with both outcomes, especially with overall treatment failure. Although the calibration plots in Figure 2 imply that there may have been an underestimation of the probability of both outcomes in the lowest and highest quintiles of probability predictions for the SF ratio that was worse than the other two parameters, these plots need to be interpreted with caution due to the small number of sample and event rates at the very low and very high predicted probabilities, possibly resulting in over/underestimation of risks due to random noise.
The two-hour SF ratio at the optimal cut-point of 128.19 for predicting HFNC success yielded the most balanced sensitivity (65.3%) and specificity (61.8%) compared to twohour ROX>3.23 and two-hour modified ROX>4.27 (Table 4). Although it could also detect the lowest proportion of patients (56.6%), the rate of false positives was the lowest (21.4%)
Volume 24, NO.3: May 2023 515 Western Journal of Emergency Medicine Ruangsomboon et al. SF Ratio, ROX, Modified ROX to Predict HFNC Success in COVID-19 Patients Characteristic Success (n=118) Failure (n=55) P-value Hospital length of stay, day 11 [9] 17 [18] <0.001 Hospital mortality 32 (27.1) 31 (56.4) <0.001
Table 1. Continued.
Parameter Time-point (hours) HFNC success Overall treatment failure Success (n=118) Failure (n=55) P-value Success (n=86) Failure (n=87) P-value SpO2/FiO2 ratio 0 193.44±66.90 180.44±70.63 0.25 197.04±65.54 187.71±70.22 0.14 2 147.57±31.17 130.28±30.39 0.001 151.96±30.46 132.14±30.28 <0.001 ROX 0 5.92±2.56 5.26±2.13 0.08 6.0±2.43 5.42±2.43 0.12 2 5.27±1.81 4.53±1.52 0.01 5.50±1.87 4.57±1.49 <0.001 Modified ROX 0 6.91±3.49 5.90±2.83 0.06 6.97±3.45 6.20±3.15 0.13 2 6.38±2.86 5.42±2.21 0.03 6.72±2.97 5.44±2.25 0.002
Table 2. Descriptive statistics of potential predictors of high-flow nasal cannula outcomes.
HFNC, high-flow nasal cannula; SpO2, pulse oximetry; FiO2, fraction of inspired oxygen; ROX, respiratory rate oxygenation index.
SF Ratio, ROX, Modified ROX to Predict HFNC Success in COVID-19 Patients
descriptive calibration
ratio, ROX, and modified ROX at 2 hours for HFNC success [A, B, C] and for overall treatment failure [D, E, F]. HFNC, high-flow nasal cannula; SF, pulse oximetry/fraction of inspired oxygen ratio; ROX, respiratory rate oxygenation index.
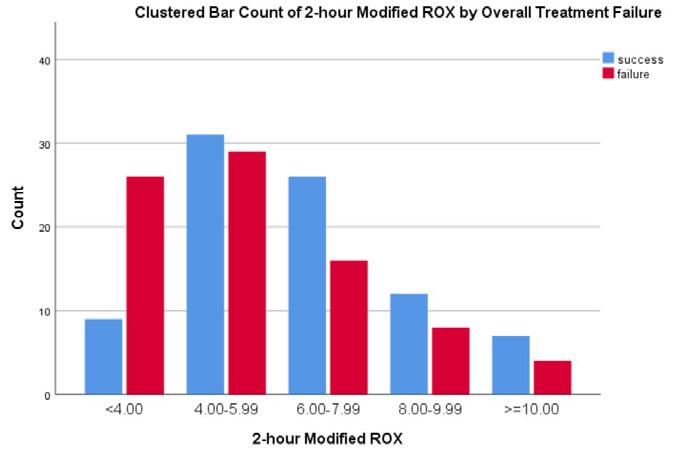
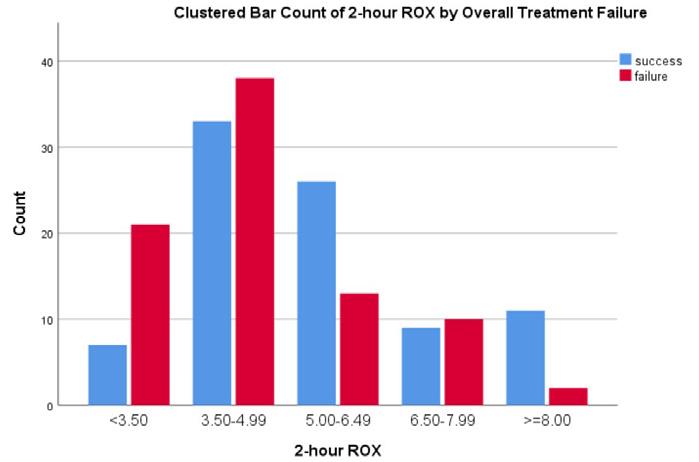
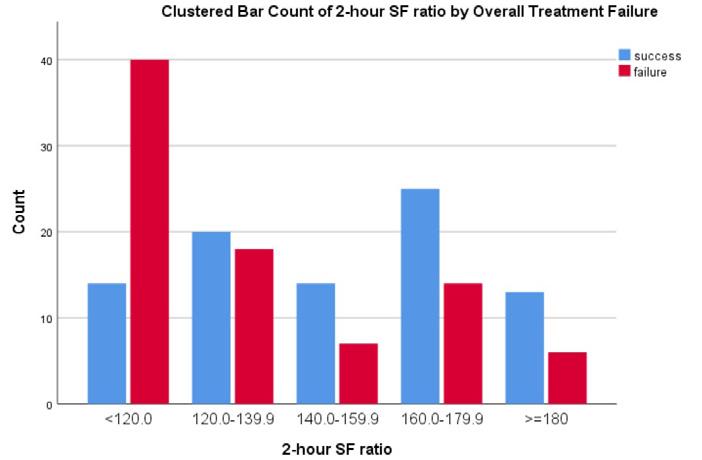
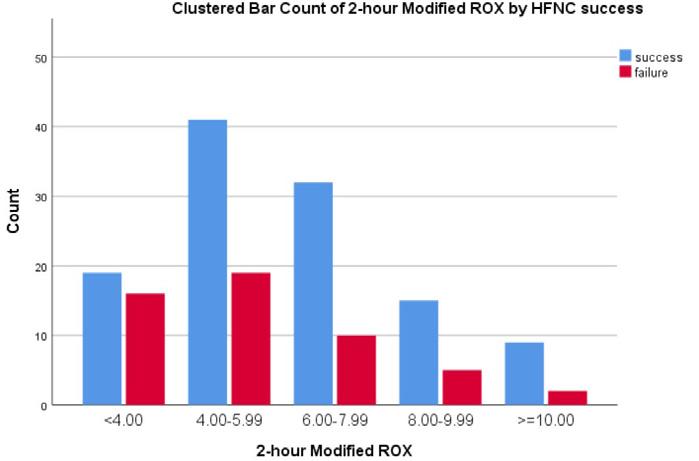
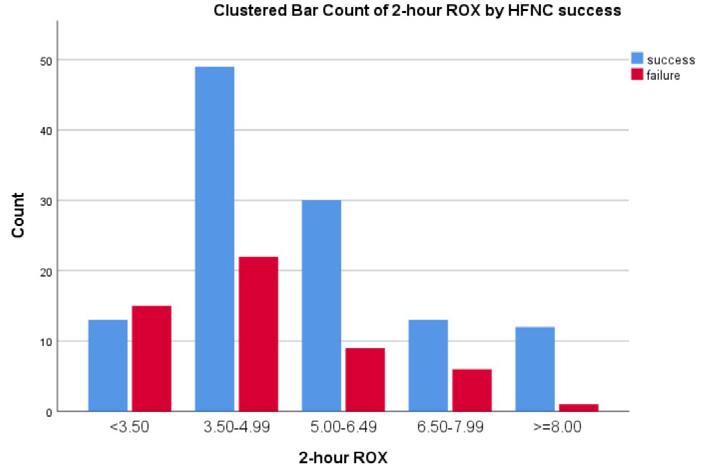
Note: P-value for differences in AUROC among any parameters for HFNC success = 0.799, for overall treatment failure = 0.213. HFNC, high-flow nasal cannula; SpO2, pulse oximetry; FiO2, fraction of inspired oxygen; ROX, respiratory rate oxygenation index.
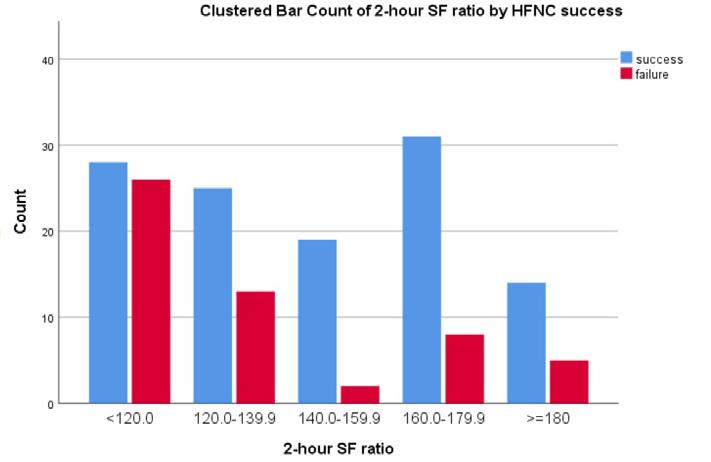
Western Journal of Emergency Medicine 516 Volume 24, NO.3: May 2023
Ruangsomboon et al. A. B C D E F
Parameter Before HFNC (0 hour) 2 hours after HFNC Overall performance Calibration Discrimination Overall performance Calibration Discrimination Nagelkerke R-Square (%) HosmerLemeshow test AUROC (95%CI) p-value Nagelkerke R-square (%) HosmerLemeshow test AUROC (95%CI) P-value HFNC success SpO2/FiO2 ratio 1.2 0.021 0.603 (0.510-0.695) 0.029 9.4 0.321 0.651 (0.558-0.744) 0.001 ROX 2.4 0.730 0.586 (0.495-0.677) 0.063 5.8 0.005 0.612 (0.516-0.707) 0.022 Modified ROX 3.1 0.216 0.593 (0.500-0.686) 0.049 4.2 0.939 0.606 (0.512-0.700) 0.026 Overall treatment failure SpO2/FiO2 ratio 1.7 0.086 0.616 (0.529-0.703) 0.009 13.0 0.604 0.692 (0.612-0.771) <0.001 ROX 1.9 0.221 0.592 (0.504-0.679) 0.039 9.6 0.030 0.649 (0.565-0.732) <0.001 Modified ROX 1.8 0.213 0.569 (0.481-0.656) 0.121 7.9 0.087 0.647 (0.563-0.731) 0.001
Figure 1. Distribution and
of SF
Table 3. Prognostic performance of the parameters before and after high-flow nasal cannula (HFNC) application in predicting HFNC success and overall treatment failure.
Ruangsomboon et al. SF Ratio, ROX, Modified ROX to Predict HFNC Success in COVID-19 Patients
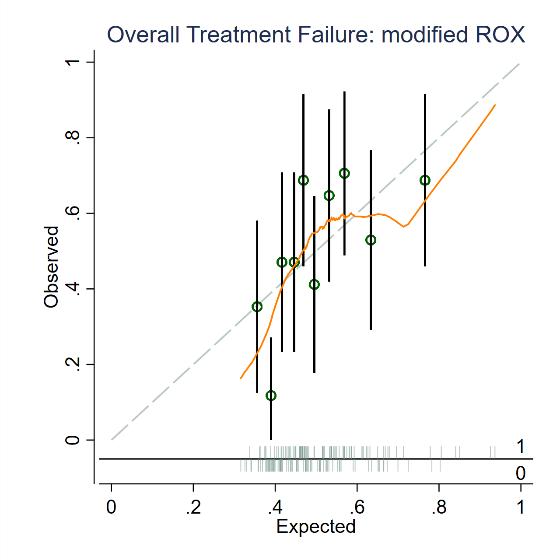
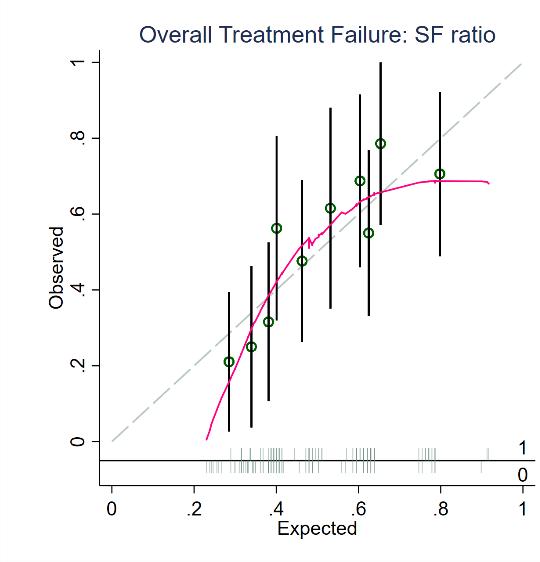
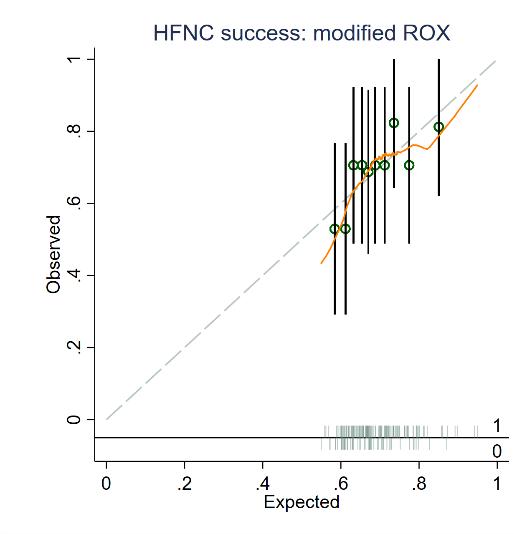
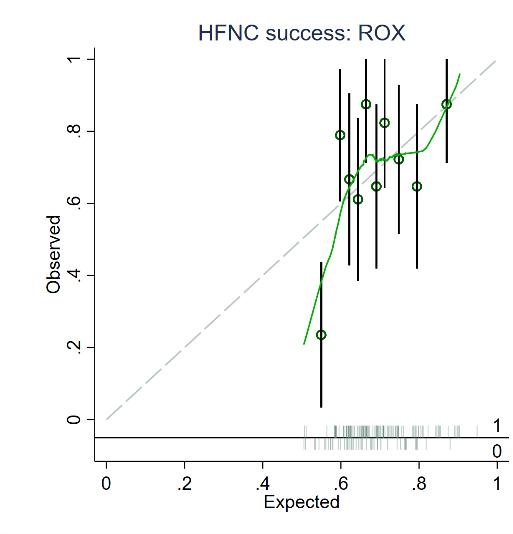
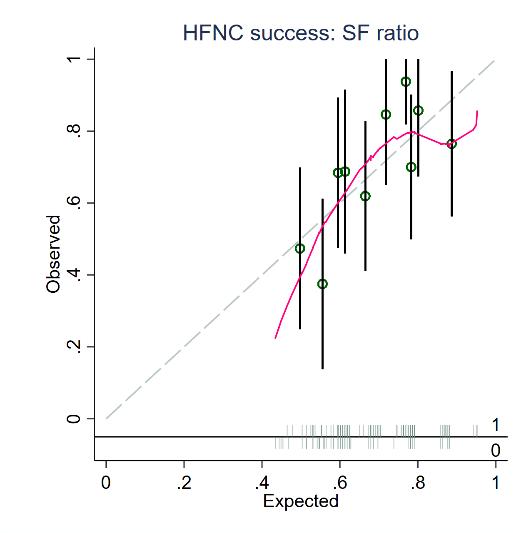
Figure 2. Calibration plots of SF ratio, ROX, and modified ROX at 2 hours for predicting HFNC success [A, B, C], and overall treatment failure (D, E, F].
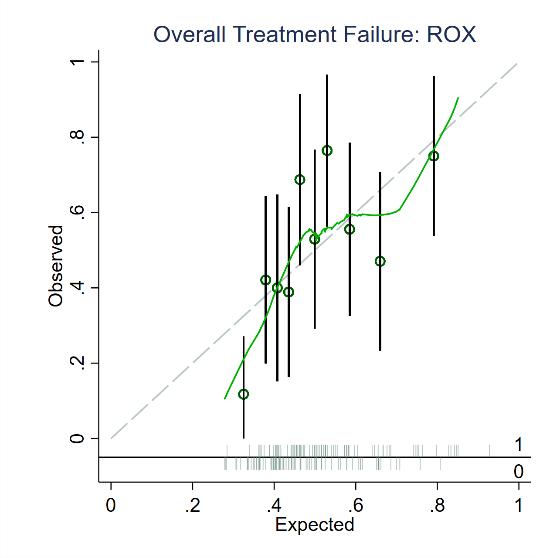
HFNC, high-flow nasal cannula; SF, pulse oximetry/fraction of inspired oxygen ratio; ROX, respiratory rate oxygenation index
Table 4. Diagnostic accuracy indices of the parameters measured two hours after application of high-flow nasal cannula.
Volume 24, NO.3: May 2023 517 Western Journal of Emergency Medicine
A B C D E F
Parameter N (%) [false positive (%)] Sensitivity (%) Specificity (%) PPV (%) NPV (%) LR+ LR- DOR HFNC success SF ratio≥128.19 98 (56.6) [21 (21.4)] 65.3 (55.9, 73.8) 61.8 (47.7, 74.6) 78.6 (69.1, 86.2) 45.3 (33.8, 57.3) 1.7 (1.2, 2.5) 0.6 (0.4, 0.8) 3.0 (1.6, 5.9) ROX≥3.23 157 (90.8) [42 (26.8)] 97.5 (92.7, 99.5) 23.6 (13.2, 37.0) 73.2 (65.6, 80.0) 81.3 (54.4, 96.0) 1.3 (1.1, 1.5) 0.1 (0.03, 0.4) 11.9 (3.4, 40.6) Modified ROX≥4.27 127 (73.4) [34 (26.8)] 78.8 (70.3, 85.8) 38.2 (25.4, 52.3) 73.2 (64.6, 80.7) 45.7 (30.9, 61.0) 1.3 (1.0, 1.6) 0.6 (0.3, 0.9) 2.3 (1.2, 4.6) Overall treatment failure SF ratio≥119.38 126 (72.8) [50 (39.7)] 88.4 (79.7, 94.3) 42.5 (32.0, 53.6) 60.3 (51.2, 68.9) 78.7 (64.3, 89.3) 1.5 (1.3, 1.9) 0.3 (0.2, 0.5) 5.6 (2.6, 12.2) ROX≥4.36 103 (59.5) [40 (38.8)] 73.3 (62.6, 82.2) 54.0 (43.0, 64.8) 61.2 (51.1, 70.6) 67.1 (54.9, 77.9) 1.6 (1.2, 2.1) 0.5 (0.3, 0.7) 3.2 (1.7, 6.1) Modified ROX≥4.06 107 (61.8) [43 (40.2)] 74.4 (63.9, 83.2) 50.6 (39.6, 61.5) 59.8 (49.9, 69.2) 66.7 (54.0, 77.8) 1.5 (1.2, 1.9) 0.5 (0.3, 0.8) 3.0 (1.6, 5.6) HFNC, high-flow nasal cannula; SF, ratio of oxygen saturation (SpO2)/fraction of inspired oxygen (FiO2); ROX, respiratory rate oxygenation index; PPV, positive predictive value; NPV, negative predictive value; LR, likelihood ratio; DOR, diagnostic odds ratio.
SF Ratio, ROX, Modified ROX to Predict HFNC Success in COVID-19 Patients
compared to the other indices. For overall treatment failure, two-hour SF ratio>119.38 had the most balanced sensitivity and specificity and could detect the highest proportion of patients with the least false positives (Table 5).
Additionally, two-hour SF ratio was the chosen variable to be included in the multivariate regression models because it was
the strongest predictor of the outcomes based on the univariate regression results (Table 5) and because it had the most superior diagnostic ability (based on Table 3 and 4) with the least input variables compared to the ROX and the modified ROX indices. From the multivariate model, two-hour SF ratio>128.19 was the only variable independently associated with HFNC failure
P=0.001) -
Note: aOptimal cut-points of SpO2/FiO2 ratio were 128.19 for HFNC failure and 119.38 for overall treatment failure, boptimal cut-points of ROX were 3.23 for HFNC failure and 4.36 for overall treatment failure, coptimal cut-points of Modified ROX were 4.27 for HFNC failure and 4.06 for overall treatment failure. Variables with univariate P-value< 0.2 were included in the multivariate logistic regression models. Only one strongest parameters in predicting each outcome among SpO2/FiO2 ratio, ROX, and modified ROX were included in the multivariate models to avoid multicollinearity. OR, odds ratio; CI, confidence interval; GFR, glomerular filtration rate; SpO2, pulse oximetry; FiO2, fraction of inspired oxygen; ROX, respiratory rate oxygenation index.
Western Journal of Emergency Medicine 518 Volume 24, NO.3: May 2023
Ruangsomboon et al.
Variable HFNC failure Overall treatment failure Univariate OR (95% CI; P-value) Multivariate OR (95% CI; P-value) Univariate OR (95% CI; P-value) Multivariate OR (95% CI; P-value) Age (per 1-year increase) 0.98 (0.96-1.04; P=0.25) - 1.03 (1.01-1.05; P=0.005) 1.02 (0.99-1.04; P=0.23) Gender male (vs female) 1.21 (0.63-2.30; P=0.57) - 1.18 (0.65-2.14; P=0.60)Body mass index (kg/m2) 1.0 (0.96-1.05; P=0.85) - 0.97 (0.93-1.01; P=0.11) 0.98 (0.93-1.04; P=0.50) Day of symptoms on arrival 0.95 (0.86-1.05; P=0.31) - 0.91 (0.83-0.99; P=0.04) 0.92 (0.82-1.03; P=0.16) Charlson Comorbidity Index 1.04 (0.91-1.18; P=0.59) - 1.12 (0.98-1.27; P=0.09) 1.03 (0.87-1.21; P=0.74) Sequential Organ Failure Assessment score (per 1-point increase) 0.96 (0.79-1.17; P=0.71) - 1.34 (1.10-1.64; P=0.004) 1.19 (0.95-1.49; P=0.14) D-dimer≥1.5mg/L (vs <1.5 mg/L) 0.57 (0.26-1.26; P=0.17) 0.52 (0.23-1.19; P=0.12) 1.13 (0.55-2.33; P=0.74)C-reactive protein (vs <100 mg/L) 100-200 mg/L >200 mg/L Ref 0.94 (0.45-1.94; P=0.87) 1.20 (0.46-3.09; P=0.71) - Ref 1.32 (0.67-2.58; P=0.43) 1.38 (0.56-3.43; P=0.49)Steroid n/a (too few observations) - 2.05 (0.18-23.01; P=0.56)0-hour SpO2/FiO2 ratio 1.0 (0.99-1.0; P=0.25) - 1.0 (0.99-1.0; P=0.14)0-hour ROX 0.88 (0.76-1.03; P=0.10) - 0.91 (0.80-1.03; P=0.12)0-hour modified ROX 0.90 (0.80-1.01; P=0.07) - 0.93 (0.85-1.02; P=0.14)2-hour SpO2/FiO2 ratio ≥ optimal cut-point (vs < optimal cut-point)a 0.32 (0.16-0.62; P=0.001) 0.29 (0.13-0.65; P=0.003) 0.17 (0.08-0.38; P<0.001) 0.19 (0.08-0.46; P<0.001) 2-hour ROX ≥ optimal cut-point (vs < optimal cut-point)b 0.38 (0.17-0.71; P=0.002) - 0.29 (0.15-0.56; P<0.001)2-hour modified ROX; ≥ optimal cut-point (vs < optimal cut-point)c 0.41 (0.20-0.82; P=0.01) - 0.25 (0.11-0.56;
Table 5. Univariate and multivariate analyses of factors predicting high-flow nasal cannula outcomes.
Ruangsomboon et al. SF Ratio, ROX, Modified ROX to Predict HFNC Success in COVID-19 Patients after adjusting for other potential confounders (adjusted odds ratio [aOR] 0.29, 95% CI 0.13-0.65; P=0.003) (Table 5). For overall treatment failure, the two-hour SF ratio>119.38 was also significantly and strongly associated with the outcome (aOR 0.19, 95% CI 0.08-0.38; P<0.001) (Table 5).
DISCUSSION
To the best of our knowledge, this study was the first to directly compare the prognostic utility of the SF ratio, the ROX index, and the modified ROX index for AHRF patients secondary to COVID-19 in the ED setting. We found that the SF ratio measured at two hours post-HFNC application was the best predictor of HFNC and overall treatment success since it could yield the highest discriminating ability and overall performance index, as well as good calibration, well-balanced diagnostic accuracy indices, and strong association with HFNC and overall treatment failure.
High-flow nasal cannula has been recommended as the respiratory and oxygenation support measure for patients with AHRF due to COVID-19 since it has been shown to provide many physiologic benefits and may reduce adverse outcomes, such as mechanical ventilation rate.7,8 Therefore, it has been increasingly used in many settings, including the ED, where the disease trajectory may differ from inpatient or ICU settings given that HFNC is initiated earlier in the disease course. Still, patients with failed HFNC treatment may end up requiring mechanical ventilation, and a delay in this process may result in mortality.9 To avoid these undesirable outcomes, it is necessary to employ adequate and appropriate patient monitoring using effective and efficient instruments.
The ROX index, the most widely validated prognostic marker of HFNC outcomes, has been shown by many studies to also have acceptable prognostic utility in COVID-19 patients.14-16, 27 However, only one single-center study has evaluated its utility in the ED setting.34 Moreover, no multicenter studies have compared the ROX index to the SF ratio, a more convenient and possibly more relevant tool for COVID-19 considering its pathophysiology and general patient characteristics, or the modified ROX index, a relatively more complex measure that also incorporates another vital sign (HR) that may be related to the disease severity and progression.
Consequently, the present study has added to the current body of evidence that the SF ratio, the simplest parameter among the three, could outperform the ROX and the modified ROX indices in predicting HFNC success for COVID-19 patients in the ED setting. Although the discrimination based on AUROC of the SF ratio was not significantly higher than those of the other parameters, it was still superior to the others by a wide range of other statistical analyses, including calibration, overall model performance, diagnostic accuracy indices based on the optimal cut-point, and associations with the outcome based on regression analyses. The superiority of the SF ratio over other more complex parameters could have been because patients with COVID-19 usually present with silent hypoxia, a condition in which
other physiologic parameters can appear normal despite very low oxygenation.19 As a result, the study parameter with only variables relevant to oxygenation was more highly related and predictive of the outcome. The present study yielded concordant results with a study by Kim et al, who evaluated 133 COVID-19 patients receiving HFNC treatment in an inpatient setting and found that the SF ratio at one hour provided superior AUROC to that of the ROX index.20
However, it is important to note that although the SF ratio offered a more balanced sensitivity and specificity than the other two indices for HFNC success, the ROX index yielded a largely higher sensitivity and the proportion of detectable patients. This controversy might have been because the Youden index employed in these analyses may not be the most appropriate method to identify the optimal cut-point for this outcome as it only focused on the highest product of sensitivity combined with specificity without considering their balance. This matter was evidenced by a very high sensitivity and low specificity for the ROX index compared to the other two parameters.
Interestingly, we found that the SF ratio clearly had better predictive ability than the other indices for overall treatment failure based on all statistical analyses performed. Its performance was even better than the SF ratio for HFNC success. This result adds to the current body of evidence that mortality could have been another measure of adverse clinical outcomes of COVID-19 in patients treated with HFNC that predictive scoring systems, especially the SF ratio, could be able to predict accurately. With its unique clinical progression, disease-specific mortality could imply severe disease deterioration despite initial successful HFNC weaning.24
Nevertheless, despite the SF ratio having the highest AUROC, the AUROCs found in our study were generally lower than in other studies in COVID-19 patients.14-16,20,33 Such a contrast could have been explained partly by different settings and population between this study and previous studies (ED vs non-ED). Also, it could have been because of the characteristics of the population and setting specific to Thailand, a middleincome country, where the quality of care and available healthcare resources are much more limited than in other higher income countries. Our generally higher mortality and HFNC failure rates compared to other studies of higher income countries may reflect our limited-resources situation. Also, the events of inhospital mortality and mechanical ventilation experienced by our study population might not have arisen directly due to COVID-19 but also partly due to limited healthcare provisions and suboptimal quality of care. These issues might have explained the lower discrimination capacity of the study parameters in the present study. Nevertheless, they underlie the importance of the present study as the much higher validation AUROCs in previous studies from higher income countries would not have been applicable to our scenario.
Nonetheless, from the present study, it was still appropriate to conclude that the SF ratio was superior to the ROX index and the modified ROX index in predicting HFNC success and
Volume 24, NO.3: May 2023 519 Western Journal of Emergency Medicine
overall treatment failure for emergency COVID-19 patients not only because of its superior performance over a wide range of statistical analytic methods but also because the SF ratio is easier to calculate at bedside, thereby being more efficient to be used in the ED.
LIMITATIONS
There were some limitations to this study. First, the study was conducted in a middle-income country, which may limit its generalizability even though it involved multiple EDs of hospitals with varying levels of care. Second, the data was collected retrospectively, which may have caused possible errors and corresponding bias associated with the nature of a retrospective study. Third, we only measured the parameters at two hours post-HFNC application and not at any later time points because it was the longest duration that all the patients were still in the EDs; therefore, the clinical utility of the parameters could also involve aiding in ED disposition decision-making. The other reason was that there were many missing variables at later time points because the physiologic parameters were not monitored simultaneously among inpatient units of participating hospitals. Nevertheless, had the parameters been followed for longer than two hours, their prognostic utility and their relative ability in prognostication could have changed. Regardless, the applicability of those findings to the ED setting may be limited.
CONCLUSION
The SF ratio measured two hours after high-flow nasal cannula initiation was better than the ROX index and the modified ROX index at predicting HFNC success in patients with acute hypoxemic respiratory failure secondary to COVID-19 in the ED setting. Compared to the other two ROX indices, the two-hour SF ratio had the greatest prognostic utility, as well as the utmost simplicity and bedside efficiency. Therefore, it may be an appropriate tool to guide appropriate disposition, further management, and potential escalation therapy for COVID-19 patients treated with HFNC therapy in the ED.
Address for Correspondence: Nattakarn Praphruetkit, MD, Mahidol University, Department of Emergency Medicine, 2 Wanglang Road, Bangkok Noi, Bangkok, Thailand 10700. Email: nattakarn107@yahoo.com
Conflicts of Interest: By the WestJEM article submission agreement, all authors are required to disclose all affiliations, funding sources and financial or management relationships that could be perceived as potential sources of bias. No author has professional or financial relationships with any companies that are relevant to this study. There are no conflicts of interest or sources of funding to declare.
Copyright: © 2023 Ruangsomboon et al. This is an open access article distributed in accordance with the terms of the Creative Commons Attribution (CC BY 4.0) License. See: http:// creativecommons.org/licenses/by/4.0/
REFERENCES
1. Zhu N, Zhang D, Wang W, et al. A novel coronavirus from patients with pneumonia in China, 2019. N Engl J Med. 2020;382(8):727-33.
2. Sahu KK, Mishra AK, Lal A. Trajectory of the COVID-19 pandemic: chasing a moving target. Ann Transl Med. 2020;8(11):694.
3. Roca O, Riera J, Torres F, et al. High-flow oxygen therapy in acute respiratory failure. Respir Care. 2010;55(4):408–13.
4. Makdee O, Monsomboon A, Surabenjawong U, et al. High-flow nasal cannula versus conventional oxygen therapy in emergency department patients with cardiogenic pulmonary edema: a randomized controlled trial. Ann Emerg Med. 2017;70(4):465-72
5. Ruangsomboon O, Limsuwat C, Praphruetkit N, et al. Nasal high-flow oxygen versus conventional oxygen therapy for acute severe asthma patients: a pilot randomized controlled trial. Acad Emerg Med. 2021;28(5):530-41.
6. Ruangsomboon O, Dorongthom T, Chakorn T, et al. High-flow nasal cannula versus conventional oxygen therapy in relieving dyspnea in emergency palliative patients with do-not-intubate status: a randomized crossover study. Ann Emerg Med. 2020;75(5):615–26.
7. Ospina-Tascón GA, Calderón-Tapia LE, García AF, et al. Effect of high-flow oxygen therapy vs conventional oxygen therapy on invasive mechanical ventilation and clinical recovery in patients with severe COVID-19: a randomized clinical trial. JAMA. 2021;326(21):2161–71.
8. Calligaro GL, Lalla U, Audley G, et al. The utility of high-flow nasal oxygen for severe COVID-19 pneumonia in a resourceconstrained setting: A multi-centre prospective observational study. EClinicalMedicine. 2020;28:100570.
9. Kang BJ, Koh Y, Lim CM, et al. Failure of high-flow nasal cannula therapy may delay intubation and increase mortality. Intensive Care Med. 2015;41(4):623–32.
10. Roca O, de Acilu MG, Caralt B, et al. Humidified high flow nasal cannula supportive therapy improves outcomes in lung transplant recipients readmitted to the intensive care unit because of acute respiratory failure. Transplantation. 2015;99(5):1092–8.
11. Roca O, Messika J, Caralt B, et al. Predicting success of high-flow nasal cannula in pneumonia patients with hypoxemic respiratory failure: the utility of the ROX index. J Crit Care. 2016;35:200–5.
12. Roca O, Caralt B, Messika J, et al. An index combining respiratory rate and oxygenation to predict outcome of nasal high-flow therapy Am J Respir Crit Care Med. 2018;199(11):1368–76.
13. Fink DL, Goldman NR, Cai J, et al. Ratio of oxygen saturation index to guide management of COVID-19 pneumonia. Ann Am Thorac Soc. 2021;18(8):1426–8.
14. Patel M, Chowdhury J, Mills N, et al. Utility of the rox index in predicting intubation for patients with COVID-19-related hypoxemic respiratory failure receiving high-flow nasal therapy: retrospective cohort study. JMIRx Med. 2021;2(3):e29062.
15. Prakash J, Bhattacharya PK, Yadav AK, et al. ROX index as a good predictor of high flow nasal cannula failure in COVID-19 patients with acute hypoxemic respiratory failure: A systematic review and metaanalysis. J Crit Care. 2021;66:102–8.
Western Journal of Emergency Medicine 520 Volume 24, NO.3: May 2023
Ruangsomboon et al.
SF Ratio, ROX, Modified ROX to Predict HFNC Success in COVID-19 Patients
16. Vega ML, Dongilli R, Olaizola G, et al. COVID-19 pneumonia and ROX index: time to set a new threshold for patients admitted outside the ICU. Authors’ reply. Pulmonology. 2021;27(5):475–6.
17. Goh KJ, Chai HZ, Ong TH, et al. Early prediction of high flow nasal cannula therapy outcomes using a modified ROX index incorporating heart rate. J Intensive Care. 2020;8(1):41.
18. Kim GE, Choi SH, Park M, et al. SpO2/FiO2 as a predictor of high flow nasal cannula outcomes in children with acute hypoxemic respiratory failure. Sci Rep. 2021;11(1):13439.
19. Tobin MJ, Jubran A, Laghi F. Misconceptions of pathophysiology of happy hypoxemia and implications for management of COVID-19. Respir Res. 2020;21(1):249.
20. Kim JH, Baek AR, Lee SI, et al. ROX index and SpO2/FiO2 ratio for predicting high-flow nasal cannula failure in hypoxemic COVID-19 patients: a multicenter retrospective study. PLOS ONE. 2022;17(5):e0268431.
21. von Elm E, Altman DG, Egger M, et al. Strengthening the Reporting of Observational Studies in Epidemiology (STROBE) statement: guidelines for reporting observational studies. BMJ. 2007;335(7624):806–8.
22. Worster A, Bledsoe RD, Cleve P, et al. Reassessing the methods of medical record review studies in emergency medicine research. Ann Emerg Med. 2005;45(4):448–51.
23. Ma XH, An MM, Yin F, et al. Factors associated with failure of high-flow nasal cannula oxygen therapy in patients with severe COVID-19: a retrospective case series. J Int Med Res. 2022;50(5):3000605221103525.
24. Ferrer S, Sancho J, Bocigas I, et al. ROX index as predictor of high flow nasal cannula therapy success in acute respiratory failure due to SARS-CoV-2. Respir Med. 2021;189:106638.
25. Ramspek CL, Jager KJ, Dekker FW, et al. External validation of prognostic models: what, why, how, when and where? Clin Kidney J.
2021;14(1):49–58.
26. Ruangsomboon O, Boonmee P, Limsuwat C, et al. The utility of the rapid emergency medicine score (REMS) compared with SIRS, qSOFA and NEWS for Predicting in-hospital Mortality among Patients with suspicion of Sepsis in an emergency department. BMC Emerg Med. 2021;21(1):2.
27. Praphruetkit N, Boonchana N, Monsomboon A, et al. ROX index versus HACOR scale in predicting success and failure of high-flow nasal cannula in the emergency department for patients with acute hypoxemic respiratory failure: a prospective observational study. Int J Emerg Med. 2023;16(1):3.
28. DeLong ER, DeLong DM, Clarke-Pearson DL. Comparing the areas under two or more correlated receiver operating characteristic curves: a nonparametric approach. Biometrics. 1988;44(3):837–45.
29. Steyerberg EW, Vickers AJ, Cook NR, et al. Assessing the performance of prediction models: a framework for some traditional and novel measures. Epidemiology. 2010;21(1):128–38.
30. Pencina MJ, D’Agostino RB, Demler OV. Novel metrics for evaluating improvement in discrimination: net reclassification and integrated discrimination improvement for normal variables and nested models. Stat Med. 2012;31(2):101–13.
31. Hu B, Palta M, Shao J. Properties of R(2) statistics for logistic regression. Stat Med. 2006;25(8):1383–95.
32. Tjur T. Coefficients of determination in logistic regression models—a new proposal: the coefficient of discrimination. The American Statistician. 2009;63(4):366–72.
33. Chandel A, Patolia S, Brown AW, et al. High-flow nasal cannula therapy in COVID-19: using the ROX index to predict success. Respir Care. 2021;66(6):909–19.
34. Valencia CF, Lucero OD, Castro OC, et al. Comparison of ROX and HACOR scales to predict high-flow nasal cannula failure in patients with SARS-CoV-2 pneumonia. Sci Rep. 2021;11(1):22559.
Volume 24, NO.3: May 2023 521 Western Journal of Emergency Medicine
et al. SF
ROX,
ROX
Predict HFNC Success in COVID-19 Patients
Ruangsomboon
Ratio,
Modified
to
Effect of a Home Health and Safety Intervention on Emergency Department Use in the Frail Elderly: A Prospective Observational Study
Sandy Bogucki, MD, PhD*
Gina Siddiqui, MD†
Ryan Carter, MPH, MD‡
Joanne McGovern, BS*
James Dziura, MPH, PhD§
Geliang Gan, MPH, PhD||
Fangyong Li, MS, MPH||
Gina Stover, AS*
David C Cone, MD#
Carolyn Brokowski, ALM, MSc*
Daniel Joseph, MD*
Section Editor: Stephen Meldon, MD
Yale School of Medicine, Department of Emergency Medicine, New Haven, Connecticut
New York City Health and Hospitals, Elmhurst Hospital Center, Department of Emergency Medicine, Queens, New York
Our Lady of Fatima Hospital, Department of Emergency Medicine, North Providence, Rhode Island
Yale School of Medicine, Yale Center for Analytical Science, Department of Emergency Medicine and of Endocrinology, New Haven, Connecticut
Yale School of Public Health, Yale Center for Analytical Sciences, New Haven, Connecticut
University of Hawai’i, Honolulu, Hawaii
Submission history: Submitted August 14, 2022; Revision received January 24, 2023; Accepted February 9, 2023
Electronically published May 3, 2023
Full text available through open access at http://escholarship.org/uc/uciem_westjem
DOI: 10.5811/westjem.58378
Introduction: Geriatric patients are often frail and may lose independence through a variety of mechanisms including cognitive decline, reduced mobility, and falls. Our goal was to measure the effect of a multidisciplinary home health program that assessed frailty and safety and then coordinated ongoing delivery of community resources on short-term, all-cause emergency department (ED) utilization across three study arms that attempted to stratify frailty by fall risk.
Methods: Subjects became eligible for this prospective observational study via one of three pathways: 1) by visiting the ED after a fall (2,757 patients); 2) by self-identifying as at risk for falling (2,787); or 3) by calling 9-1-1 for a “lift assist” after falling and being unable to get up (121). The intervention consisted of sequential home visits by a research paramedic who used standardized assessments of frailty and risk of falling (including providing home safety guidance), and a home health nurse who aligned resources to address the conditions found. Outcomes of interest were all-cause ED utilization at 30, 60, and 90 days post-intervention compared with subjects who enrolled via the same study pathway but declined the study intervention (controls).
Results: Subjects in the fall-related ED visit arm were significantly less likely to have one or more subsequent ED encounters post-intervention than controls at 30 days (18.2% vs 29.2%, P<0.001); 60 days (27.5% vs 39.8%, P<0.001); and 90 days (34.6% vs 46.2%, P<0.001). In contrast, participants in the self-referral arm had no difference in ED encounters post-intervention compared to controls at 30, 60, or 90 days (P=0.30, 0.84, and 0.23, respectively). The size of the 9-1-1 call arm limited statistical power for analysis.
Conclusion: A history of a fall requiring ED evaluation appeared to be a useful marker of frailty. Subjects recruited through this pathway experienced less all-cause ED utilization over subsequent months after a coordinated community intervention than without it. The participants who only self-identified as at risk for falling had lower rates of subsequent ED utilization than those recruited in the ED after a fall and did not significantly benefit from the intervention. [West J Emerg Med. 2023;24(3)522–531.]
Western Journal of Emergency Medicine 522 Volume 24, NO.3: May 2023 * † ‡ § || #
Original Research
INTRODUCTION
The preservation of autonomy and the ability to live independently is a major focus of geriatric medicine.1,2,3 Geriatric patients are often frail and vulnerable and may lose independence through a variety of mechanisms including cognitive decline, depression, functional decline and reduced mobility, and falls.1,2 Importantly, many of these risk factors are modifiable.4 A growing body of research surrounding geriatric falls has demonstrated that they are both prevalent, afflicting approximately 30% of community-living persons >65 years, and significant drivers of loss of independence, often triggering nursing home placement.5,6,7,8
Approximately three million individuals are treated for falls each year in emergency departments (ED).9 Fall-related deaths appear to be increasing, with the US Centers for Disease Control and Prevention noting a 30% increase from 2007 to 2016.9 Falls are also costly both to individuals and to the healthcare system, with a median cost of more than $26,000.10 In 2015 the total cost associated with falls in the US exceeded $50 billion.9 From the community and prehospital standpoint, falls also result in significant resource expenditure and call volume to emergency medical services (EMS).11,12,13,14 Individuals who fall are also likely to have repeat EMS and ED encounters.15,16
Multiple significant barriers have limited frail elders’ acceptance of home healthcare assessments and delivery. One observed barrier for high-risk populations has been patient reluctance to admit home health personnel into their homes; however, once EMS professionals have been trained in “community paramedicine” techniques, they were able to achieve patient trust and have made significant contributions to various public health aims.17 A second barrier is finding a reliable marker for frailty that detects individuals likely to benefit without over-enrolling patients who will not. Falls appear to be an indicator of frailty among the elderly, although target populations in the fallprevention literature range from healthy volunteers in day centers to hospitalized patients, and it is not discernible whether differences in effectiveness of interventions derive from diversity of the study population or the interventions themselves. A final barrier is defining success without patient-valued outcomes; most studies reported recurrent falls as an endpoint, but few measured broader, all-cause morbidity or mortality.
Importance
Providing the elderly who are frail with the ability to maintain independence and live safely at home is of paramount importance to preserving their quality of life.18 Multiple interventions have been attempted to target this population with varying effect. Interventions in the ED have had limited success, with few documenting improved outcomes.19,20,21,22,23 Primary care-based interventions
Population Health Research Capsule
What do we already know about this issue?
Elderly falls at home requiring EMS response were associated with repeat 9-1-1 calls and transport to an ED over the following 30 days.
What was the research question?
Can a coordinated health and safety visit by a paramedic and a home care nurse decrease allcause ED utilization over 30-90 days?
What was the major finding of the study?
Among frail elderly, the intervention reduced the proportion of repeat ED visits significantly at 30, 60, and 90 days (18.2% vs 29.2%, 27.5% vs 39.8%, and 34.6% vs 46.2%, respectively, P<0.001 for all).
How does this improve population health?
The complementary skills of EMS and home care nurses can enhance the health and safety of elders, reducing their reliance on emergency medical care.
have shown similar results.24 25 Multifactorial approaches appear to be more successful.26 Additionally, EMS-based interventions have shown some promise.27,28,29,30,31,32 Widespread success with home safety assessment interventions in the real world, however, remains limited as they have often not been coupled with ongoing community resources and care. This study introduces a novel approach to address this significant gap in healthcare support of the frail elderly living at home.
Goals of This Investigation
We sought to measure the effect of a coordinated frailty assessment and home safety intervention by research paramedics with follow-up visits by community-based home health nurses on subsequent, all-cause ED utilization at 30, 60, and 90 days post-intervention. Ultimately, the goal was to improve the safety of enrolled subjects and enhance their ability to live independently.
METHODS
Study Design and Setting
The Paramedic Referrals for Increased Independence and Decreased Disability in the Elderly (PRIDE) program was a prospective observational study, conducted between March 2015–April 2018. Subjects resided in the geographic catchment area of 15 towns in south-central Connecticut.
Volume 24, NO.3: May 2023 523 Western Journal of Emergency Medicine Bogucki et al. Coordinated Home Health and Safety Intervention Decreases ED Utilization by Frail Elderly
Coordinated Home Health and Safety Intervention Decreases ED Utilization by Frail Elderly Bogucki et
Selection of Participants
Study subjects were recruited into one of three enrollment populations: 1) those who were seen in the ED after falls; 2) individuals who responded to public messaging and perceived themselves to be at risk for falling; and 3) those referred by EMS agencies after they called 9-1-1 for a “lift assist” or help getting up after a non-injury fall at home. Subjects were recruited into the ED arm by research associates (RA) stationed in the ED of a large, urban, tertiary care hospital with over 100,000 ED visits per year.
On assigned schedules that generally covered day and evening shifts seven days a week, these RAs monitored patient locator boards for chief complaints suggestive of falls by seniors. When appropriate, they approached the patient and/or family, explained the study, and if eligible, invited them to participate. Following informed consent, the participants were enrolled as study subjects. Those who were interested in participating but were admitted to the hospital on that ED visit were contacted again by the RAs near the time of discharge to facilitate entry into the study.
Subjects who perceived themselves as elderly and at risk of falling, were recruited through information events and public messaging. Recruitment efforts included tables at senior centers, senior housing complexes, churches, and other venues, which were staffed by research paramedics wearing PRIDE logos who answered questions and distributed brochures. Radio spots and billboards describing the program and providing contact information were also used.
Subjects were recruited into the EMS referral arm at the time of a “lift assist” call if they or the responsible family member at the scene agreed that a study representative could subsequently call and invite them to participate in the study. If the patient consented to the follow-up call, his or her name and telephone number were forwarded by the EMS responders to study personnel. Following informed consent, all subjects who did not wish to participate in the study intervention were given the option of declining.
In all arms of the study, eligibility was restricted to adults living at home or in assisted living facilities within the geographic catchment area. Participants living in long-term care facilities were not eligible to participate. There was no explicit age requirement, but participants were primarily over 65, likely due to use of the term “elderly” in the program title. We defined the intervention group as those who agreed to participate in the intervention. Participants comprising the control group consented to have their subsequent ED utilization followed but chose not to participate in the intervention. Each participant received a $10 gift card to a local supermarket for enrolling, and a $15 gift card for completing the interventions.
Intervention
The intervention consisted of a visit by a Connecticutlicensed paramedic serving independently of the EMS system and trained and identified to the public as a research assistant
for this project. The research paramedic performed a home safety check (availability of grab bars, working smoke detectors, risks associated with throw rugs, trip hazards, etc), obtained a list of current medications, and employed standard instruments to assess degrees of frailty.33,34,35,36 The research paramedic also contacted the study subject’s primary care clinician, discussed relevant findings from the home assessment, and if the subject consented, facilitated a followup visit. Free transportation to the primary care office site was offered as part of the intervention. The precise screening performed, and the field-adapted Fall Risk Inventory, can be found in Appendix 1.
Following the research paramedic’s visit, there was a pre-arranged house call by a nurse from one of several participating home health agencies. The nurse reviewed the findings of the research paramedic’s assessment, performed medication reconciliation, and confirmed access to currently prescribed medications. The nurse also determined needs for durable equipment and ongoing services such as physical or occupational therapy and arranged for delivery. Research paramedics and visiting nurse staff were formally trained for the intervention, including didactic training and opportunities to ride along with their counterparts in the care team and to shadow case managers and care coordinators in the ED. Further details on the training curriculum for paramedics and nurses can be found in Appendix 2.
Finally, after the interventions were completed, a brief satisfaction survey was mailed to each participant. This survey was adapted for PRIDE from the Centers for Medicare & Medicaid Home Health Care Consumer Assessment of Healthcare Providers and Systems, which was beta-tested on an early subset of subjects representing all three enrollment populations and did not require revision before deployment.
Measurements
Data obtained from the participants directly at the time of enrollment, during the interventions performed by the research paramedics and visiting nurses during the home visits, and participants’ responses to the post-completion satisfaction survey, were collected and maintained using REDCap electronic data capture tools hosted at Yale University.37 38 We captured subsequent ED admissions or hospitalizations by matching multiple identifiers in REDCap with participants’ electronic health records.
We measured ED utilization that occurred 30, 60, and 90 days after enrollment in the control group, and after the home health nurse visit was completed in the intervention group. Study subjects were considered part of the control group until both visits outlined in the intervention (research paramedic and visiting nurse) were completed. For example, subjects whose study intervention was completed over 60 days following enrollment, had 30-day and 60-day data included in the control group. The date of completion of the second visit was considered day 0 for the intervention group. Any EMS
Western Journal of Emergency Medicine 524 Volume 24, NO.3: May 2023
al.
use at 30 days was also measured and published separately.13
Outcomes
Primary outcomes were subsequent all-cause ED utilization.
Analysis
We conducted a generalized estimating equation (GEE) analysis using SAS analytic software 9.4 (SAS Institute, Inc, Cary, NC) to compare the proportions of participants that had at least one ED visit during the 30, 60, or 90 days following enrollment in the control group or following completion of the visits in the intervention group. The GEE was used to accommodate repeated assessments from the participants, some of whom were sequentially included in control and then intervention groups. We similarly compared data across the three enrollment populations (ie, ED-recruited, self-referred, and EMS-referred) to determine whether the intervention appeared more or less effective among these groups. We also conducted a multivariable analysis with covariate adjustment including age, gender, and insurance type.
Additional supportive analyses were performed on the ED-enrolled subject populations to evaluate sensitivity. First, to further evaluate for any effects related to having some data from the same subjects in both intervention and no-intervention groups, we removed all the data from the crossover subjects from the dataset and only those who had never received the intervention throughout the study were compared by logistic regression with those who did. Second, to address potential bias due to variable delays between the time of enrollment in the ED and the time of the intervention, we looked at our population of crossover subjects (those who had outcomes recorded both before and after the study intervention). We performed paired analysis using GEE to compare the no-intervention phase vs the intervention phase of their study participation. The crossover subjects thus served as their own controls.
We performed person-time analysis using generalized Poisson regression to further evaluate the intervention’s effect on healthcare utilization. The statistical significance was defined as P<0.05, two-sided.
RESULTS
There were 5,665 individuals enrolled in the PRIDE study: 121 from 9-1-1 calls; 2,757 from ED visits; and 2,787 via self-referral. Of these, full 90-day follow-up data were available for 5,439 (96%) of enrolled subjects. Figure 1 shows the numbers of subjects and their study participation following enrollment. A few (<10) subjects contacted us requesting to withdraw from the study after initially enrolling. All of these occurred prior to an initial home visit by a PRIDE research paramedic. The records of those individuals were totally deleted from the REDCap database so that none of their personal data or medical records could subsequently be accessed by the investigators. They are not included in
Figure 1. Flowchart showing total enrollment and the number of participants at each stage of the PRIDE* study. The subjects who began their 30- or 60-day observation period without the PRIDE intervention but then participated in the PRIDE interventions are shown in the transition area in the middle of the chart.
*PRIDE, Paramedic Referrals for Increased Independence and Decreased Disability in the Elderly.
the total enrollment shown in the flow chart. There were 146 deaths (2.6%) of study subjects over the course of the interventions and follow-up periods; the number who died at each stage of the study is also shown in the flow chart.
Table 1 shows demographic statistics by enrollment population. The study population had an average age of 76 years, was 68% female, and 53% urban-dwelling; 81% of the participants had Medicare insurance. At least 32% of PRIDE participants lived in subsidized or public housing (data not shown), and 45% fell below the poverty line, based upon Medicaid enrollment figures. Approximately 53% of participants lived in the city of New Haven, while the rest lived in the surrounding suburbs. The self-referral arm included 73.4% participants over the age of 65 years, whereas the 9-11 lift assist and ED referral arms included 88.4% and 89% of subjects over 65, respectively.
Table 2 shows the main outcomes of our intervention. We found that that the PRIDE intervention had the greatest effect among those subjects invited to participate during a fallrelated ED visit. In this group, the PRIDE intervention was associated with a 38% relative reduction in subsequent ED visits within 30 days, and a 25% relative reduction at 90 days of follow-up (all P-values significant at <0.001). The adjusted P value reflects demographic covariates including age, gender and insurance type(s). Individuals who entered this study through the self-referral mechanism did not have significant reductions in subsequent ED encounters (all P-values >0.2). Those who enrolled as a result of 9-1-1 referrals also showed no apparent benefit, although the numbers in this arm were too small for reliable comparison.
Volume 24, NO.3: May 2023 525 Western Journal of Emergency Medicine
al.
Frail Elderly
Bogucki et
Coordinated Home Health and Safety Intervention Decreases ED Utilization by
Total Enrolled (All Study Arms ) 5 ,665 No Study Interven�on 2 ,092 30 Day Follow-up 2 ,055 60 Day Follow-up 1 ,818 90 Day Follow-up 1 ,645 30 Day Follow-up 3 ,804 60 Day Follow-up 3 ,797 90 Day Follow-up 3 ,794 PRIDE Interven�ons 3 ,806 207 142 Died 37 Died 31 Died 30 Died 3 Died 7 Died 2 Died 36 Changed to PRIDE Interven�on Group 349 Completed Interven�ons 269 Not completed 80
Coordinated Home Health and Safety Intervention Decreases ED Utilization by Frail Elderly Bogucki et
Table 1. PRIDE* participant demographics.
*PRIDE, Paramedic Referrals for Increased Independence and Decreased Disability in the Elderly.
*PRIDE, Paramedic Referrals for Increased Independence and Decreased Disability in the Elderly; ED, emergency department.
Western Journal of Emergency Medicine 526 Volume 24, NO.3: May 2023
al.
Characteristics 9-1-1 Lift assist (N=121) Emergency department (N= 2,757) Self-referral (N=2,787) Number Percentage Number Percentage Number Percentage Age at enrollment Younger than 65 14 11.6% 296 11% 743 26.6% 65-74 25 20.6% 788 28.4% 679 24.3% 75-84 44 36.3% 877 31.8% 769 27.5% 85 and older 38 31.5% 796 28.8% 596 21.3% Gender Female 76 63% 1834 66.6% 1,931 69.3% Male 45 37% 923 33.4% 856 30.7% Race White 96 79% 1760 64% 1,594 57% Black 18 15% 760 27.5% 716 25.5% Hispanic 4 3% 209 7.5% 432 15.5% American Indian, Alaska Native, Asian/ Pacific Island American, or other 3 2% 28 1% 45 2% Insurance* Medicare 69 57% 1554 56% 1,128 40% Medicaid 4 3% 240 10% 436 16% Medicare+ Medicaid 46 38% 809 29% 1,005 36% Private 2 2% 97 3% 106 4% None 0 0 57 2% 112 4%
Follow-up time No intervention PRIDE intervention Unadjusted P-value Adjusted P-value 9-1-1 lift assist 30 days 3/9 (33.33%) 22/83 (26.51%) 0.5060 days 4/8 (50.00%) 28/81(34.57%) 0.38 0.36 90 days 2/6 (33.33%) 35/80(43.75%) 0.60 0.30 Self-referral 30 days 54/516 (10.47%) 198/2,297 (8.62%) 0.31 0.30 60 days 62/440 (14.09%) 342/2,297 (14.89%) 0.56 0.84 90 days 75/393 (19.08%) 431/2,297 (18.76%) 0.66 0.23 Emergency department enrollment 30 days 447/1,530 (29.22%) 259/1,424 (18.19%) <0.001 <0.001 60 days 545/1,370 (39.78%) 390/1,419 (27.48%) <0.001 <0.001 90 days 576/1,246(46.23%) 491/1,417 (34.65%) <0.001 <0.001
Percentage of subjects with ≥1 subsequent ED encounter
Table 2. PRIDE* study outcomes comparing the percentage of study subjects with at least one subsequent, any-cause ED visit 30, 60, and 90 days following completion of the PRIDE intervention or enrollment only “No Intervention” in subjects in the 9-1-1 lift assist, selfreferral, or ED enrollment populations.
The results of the analysis for the ED-enrolled subjects excluding the intervention crossovers are presented in Table 3. The statistically significant difference between the PRIDE intervention and no intervention groups in terms of subsequent ED utilization was preserved over all three follow-up intervals with adjusted and unadjusted P-values <0.001.
In analyses of crossover participants only (ie, those observed during both control and intervention periods), all of the subjects had at least 30, and some up to 90 days, of outcomes data prior to receiving the intervention. As the data shown in Table 4 demonstrates, the percentage of these subjects with at least one ED visit following enrollment increased with each month of follow-up both pre- and postintervention but was comparatively decreased following the PRIDE intervention. The differences between the groups remain statistically significant, with higher P-values reflecting the smaller numbers included in these subsets of study participants.
We also performed a person-time analysis to initial ED visit and an event-time analysis for all ED visits. The results are displayed in Tables 5 and 6, respectively. In the group of individuals originally recruited from the ED, the incidence rate was 3.36 per 1,000 follow-up days among intervention subjects vs 4.54 per 1,000 follow-up days in the no-intervention group, a difference that was statistically significant (P<0.001). The incidence rates of first ED visit among the 9-1-1 lift-assist and self-referral groups showed no significant difference between the intervention and no intervention groups. Incidence rates of total overall visits also demonstrated a significant difference among subjects recruited from the ED: 6.27 visits per 1,000 follow-up days in
the intervention arm vs 7.16 visits per 1,000 follow-up days in the control arm (P<0.01), but not among subjects recruited via 9-1-1 lift assist or self-referral.
The following question was asked as part of the participant satisfaction survey that was mailed to every subject who completed both the PRIDE paramedic and nurse visits: “Using any number from 0 to 10, where 0 is the worst healthcare experience possible and 10 is the best healthcare experience possible, what number would you use to rate your experience with the PRIDE program?” The participants were provided self-addressed, stamped envelopes for returning their surveys. A total of 3,806 surveys were mailed to participants and 1,952 were returned, for a response rate of 51%, although 77 individuals (3.9%) left this question blank. Table 7 depicts the distribution of results along the satisfaction scale described above. Of the 1,875 who answered this question, 69% rated participation in the PRIDE program a “10,” or the best healthcare experience possible.
DISCUSSION
To our knowledge, this is the largest study of an intervention aimed at reducing short-term morbidity while maintaining independence among frail, community-dwelling older adults. Based on promising earlier studies, EMS personnel coordinated with home healthcare agency nurses and primary care physicians to address gaps in home support services and to define the individuals who were most likely to benefit from the interventions. 13
This study demonstrated decreased subsequent all-cause ED utilization at 30, 60, and 90 days after a home assessment
Table 3. PRIDE* study outcomes comparing the percentage of study subjects who had been enrolled in the ED and had at least one subsequent, any-cause ED visit 30, 60, and 90 days following completion of the PRIDE intervention vs enrollment only. The crossover patients included in Table 2 who had results in both the no-intervention (by virtue of time passed between enrollment and completion of the intervention) and the intervention groups were excluded in this analysis. Thus, there is no overlap between the control and intervention groups.
Percentage of ED-enrolled unique subjects with ≥1 subsequent ED encounter
*PRIDE, Paramedic Referrals for Increased Independence and Decreased Disability in the Elderly; ED, emergency department.
Table 4. PRIDE* study outcomes comparing the percentage of study subjects who had been enrolled in the ED and had at least one subsequent, any-cause ED visit 30, 60, and 90 days prior to (no Intervention) or following completion of the PRIDE intervention.
*PRIDE, Paramedic Referrals for Increased Independence and Decreased Disability in the Elderly; ED, emergency department.
Volume 24, NO.3: May 2023 527 Western Journal of Emergency Medicine Bogucki
by Frail Elderly
et al. Coordinated Home Health and Safety Intervention Decreases ED Utilization
Follow-up time No intervention PRIDE intervention Unadjusted P-value Adjusted P-value 30 days 341/1,156 (29.5%) 259/1,424 (18.19%) <0.001 <0.001 60 days 438/1,114 (39.32%) 390/1,419 (27.48%) <0.001 <0.001 90 days 481/1,075 (45.57%) 491/1,417 (34.65%) <0.001 <0.001
Percentage
ED-enrolled
No intervention PRIDE intervention Unadjusted P-value Adjusted P-value 30 days 106/374 (28.34%) 74/374 (19.8%) 0.003 0.002 60 days 107/256 (41.8%) 83/256 (32.42%) 0.01 0.01 90 days 85/171 (49.7%) 69/171 (40.35%) 0.04 0.05
of crossover
subjects with ≥1 subsequent ED encounter
Coordinated Home Health and Safety Intervention Decreases ED Utilization by Frail Elderly Bogucki
Table
analysis for first healthcare encounter with or without PRIDE* intervention, by enrollment population.
*PRIDE, Paramedic Referrals for Increased Independence and Decreased Disability in the Elderly; ED, emergency department.
Table
analysis for all ED visits, with or without PRIDE* intervention, by enrollment population.
*PRIDE, Paramedic Referrals for Increased Independence and Decreased Disability in the
Table
Results of a satisfaction rating question that was part of a survey mailed to study participants after they completed both elements of the PRIDE* intervention. (See text for the wording of the question and the scale used.)
*PRIDE, Paramedic Referrals for Increased Independence and Decreased Disability in the Elderly.
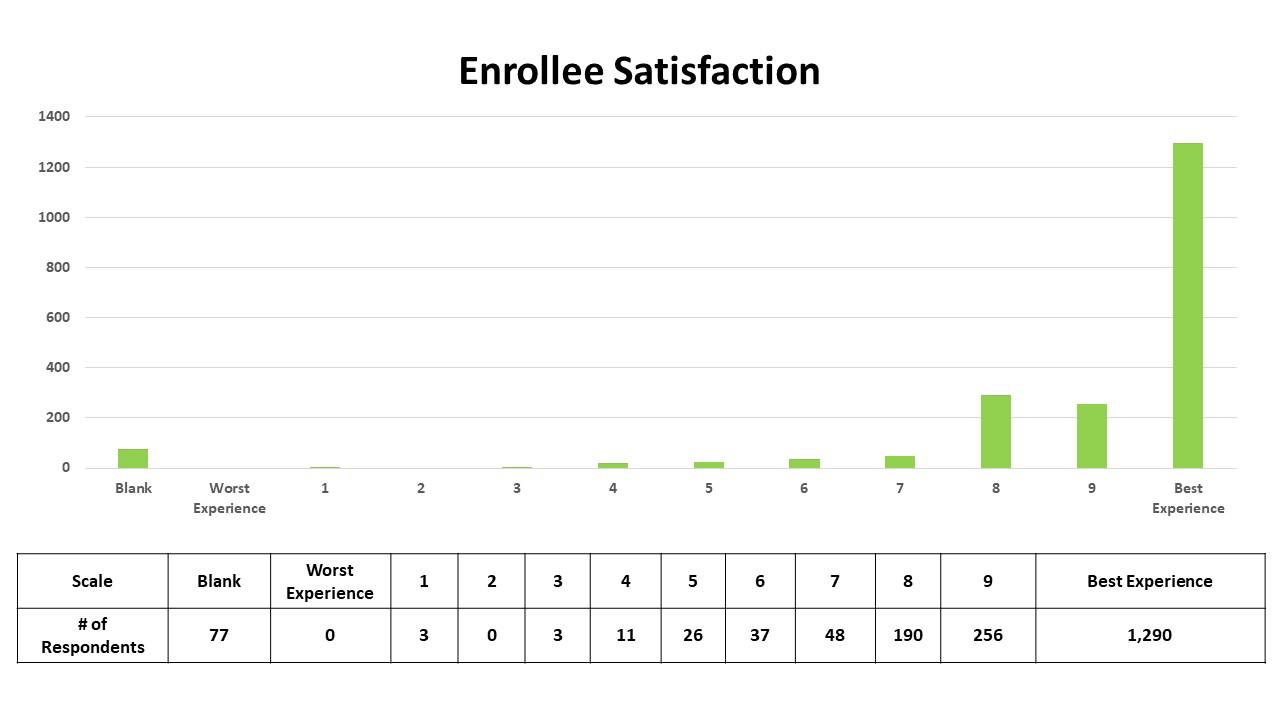
Western Journal of Emergency Medicine 528 Volume 24, NO.3: May 2023
al. Enrollment population No intervention PRIDE intervention Follow-up days # of people # of people per 1,000 follow-up days Follow-up days # of people # of people per 1,000 follow-up days P-value 9-1-1 Lift assist 1,670 6 3.59 19,146 64 3.34 0.91 Self-referral 142,352 203 1.43 695,166 1,974 1.54 0.36 ED visits 254,595 1,156 4.54 292,016 982 3.36 <0.0001 Total overall 398,617 1,365 3.42 1,006,328 2120 2.11 <0.0001
et
Enrollment population No intervention PRIDE intervention Follow-up Days # ED visits # ED visits per 1,000 followup days Follow-up days # ED visits # ED visits per 1,000 followup days P-value 9-1-1 Lift assist 3,084 11 3.57 52,753 299 5.67 0.30 Self-referral 200,107 537 2.68 1,038,001 3,327 3.21 0.044 ED visits 606,716 4,343 7.16 606,578 3,801 6.27 0.0092 Total overall 809,907 4,891 6.04 1,697,332 7,427 4.38 <0.0001
5. Person-time
Elderly; ED, emergency
department.
6. Event-time
7.
intervention among ED patients who presented with falls, but not among individuals who self-referred. There were substantial demographic differences between the self-referred and EDenrolled arms, as seen in Table 1. The self-referred subject group was younger, included a higher percentage of minorities, and more likely to have Medicaid or no insurance than the EDenrolled subjects. The baseline rates of ED re-utilization in the fall-related ED visit enrollment population were two to three times the rates seen in the self-referral population. (With no intervention, 29%, 40%, and 46% of the ED subgroup visited the ED at 30, 60, and 90 days, respectively, vs 10%, 14%, and 19% of the self-referral subgroup.) This rate of subsequent ED use suggests that ED presentation by elderly individuals for falls may be a salient indicator for health systems to identify patients at high risk of returning for any reason if no intervention is performed. Based on these group comparisons, older age and falls requiring medical evaluation appeared to be more predictive of benefit from the PRIDE intervention than race or type of insurance coverage.
The significantly lower ED utilization among subjects receiving the PRIDE intervention within the ED-recruited population but not in the self-referral population further suggests that falls are a useful marker for frailty, and that the associated high risk of short-term illness and injury may be modifiable by the right set of interventions. Indeed, for patient populations not specifically restricted to falls, home visit interventions have been found to be more effective on higher risk patients.39 Interventions such as this are also more effective in patients who have had falls; Cumming et al and Nikolaus et al both found their interventions to be more effective in the subgroups that had previous falls.40,41
Recent research has shown that emergency physicians fail to identify risk factors for falls in the ED.21 Although the ED is a place where high-risk patients are concentrated, the risk mitigation strategies these patients acutely need is difficult to implement onsite, given the competing demands on a clinician’s time and the hectic environment. However, this study provides evidence that patients’ time in the ED can be harnessed effectively another way, by dedicated enrollment staff to coordinate post-visit, risk-mitigating follow-up.
In contrast, the difficulty enrolling subjects into the 9-1-1 lift-assist arm attests to the regulatory and workflow challenges for EMS personnel to enroll individuals in the same intervention. Several towns within the geographic catchment area were reluctant to allow EMS personnel to perform this enrollment, and unlike in the ED, EMS did not have additional staff helping with patient enrollment. These practical considerations are unlikely to be unique to this study and may represent reasons ED enrollment may be preferable to EMS agencies recruiting subjects on scene.
LIMITATIONS
This was an observational cohort study that provided participants the choice whether to receive the intervention, rather than being a randomized controlled trial. Without randomization it is unknown whether selection bias is present and a contributor to the differences in outcomes between the control and intervention arms. Nevertheless, analyses of those that were observed during both control and intervention periods (ie, intervention crossovers) provided similar results. Another limitation in analysis of the intervention is that the efficacy of the PRIDE intervention was assessed in aggregate. The effect size or direction of independent components of the multifactorial intervention (research paramedic visit, nurse visit, medication reconciliation, mobility screening, primary care clinician communication, free transportation to follow-up appointments, ongoing visiting nurse services, medical equipment, etc) could not be determined from this study. Outcomes reporting of ED visits was limited to within the Yale New Haven Health System (YNHHS); therefore, repeat ED visits to other health systems are not reflected in our analysis. However, the vast majority (at least 85%, based on EMS data) of ED visits and 88% of the inpatient beds in the study’s catchment area are at YNHHS facilities.
CONCLUSION
Research paramedic and visiting nurse home visits were associated with lower rates of subsequent all-cause ED utilization among subjects who presented to the ED after falls but not among subjects who self-enrolled by identifying themselves as at risk for falling, nor among subjects who contacted 9-1-1 for lift assists. These findings suggest that individuals who present to the ED after falls can efficiently be enrolled and are likely to benefit from a program involving standardized home assessment of frailty and safety by specially trained paramedics and follow-up visits by home health nurses to arrange for appropriate, ongoing medical and community resources. By targeting this vulnerable group with a focused intervention, the autonomy of these patients and their ability to live independently may be enhanced and potentially preserved.
ACKNOWLEDGMENTS
The PRIDE program was supported by Grant # 1C1CMS331356 from the US Department of Health and Human Services, Centers for Medicare & Medicaid Services. The contents of this presentation are solely the responsibility of the authors and do not necessarily represent the official views of the US Department of Health and Human Services or any of its agencies.
Volume 24, NO.3: May 2023 529 Western Journal of Emergency Medicine
ED
Frail Elderly
Bogucki et al. Coordinated Home Health and Safety Intervention Decreases
Utilization by
Coordinated Home Health and Safety Intervention Decreases ED Utilization by Frail Elderly Bogucki et al.
Address for Correspondence: Sandy Bogucki, MD, PhD; Dept of Emergency Medicine, Yale University School of Medicine. 464 Congress Ave, Suite 260; New Haven, CT 06519. Email: sandy. bogucki@yale.edu
Conflicts of Interest: By the WestJEM article submission agreement, all authors are required to disclose all affiliations, funding sources and financial or management relationships that could be perceived as potential sources of bias. No author has professional or financial relationships with any companies that are relevant to this study. There are no conflicts of interest or sources of funding to declare.
Copyright: © 2023 Bogucki et al. This is an open access article distributed in accordance with the terms of the Creative Commons Attribution (CC BY 4.0) License. See: http://creativecommons.org/ licenses/by/4.0/
assist” call. Prehosp Emerg Care. 2013;17:51-6.
14. Snooks HA, Halter M, Close JC, et al. Emergency care of older people who fall: a missed opportunity. Qual Saf Health Care. 2006;15:390-2.
15. Mikolaizak AS, Simpson PM, Tiedemann A, et al. Systematic review of non-transportation rates and outcomes for older people who have fallen after ambulance service call-out. Australas J Ageing. 2013;32:147-57.
16. Mikolaizak AS, Harvey L, Toson B, et al. Linking health service utilisation and mortality data: unravelling what happens after fallrelated paramedic care. Age Ageing. 2022;51.
17. Shah MN, Caprio TV, Swanson P, et al. A novel emergency medical services-based program to identify and assist older adults in a rural community. J Am Geriatr Soc. 2010;58:2205-11.
REFERENCES
1. Bimou C, Harel M, Laubarie-Mouret C, et al. Patterns and predictive factors of loss of the independence trajectory among communitydwelling older adults. BMC Geriatr. 2021;21:142.
2. Kabayama M, Mikami H, Kamide K. Multidimensional factors associated with the loss of independence: a population-based longitudinal study. Geriatr Gerontol Int. 2018;18:448-5.
3. Olivari BS, Baumgart M, Lock SL, et al. CDC grand rounds: promoting well-being and independence in older adults. MMWR Morb Mortal Wkly Rep. 2018;67:1036–9.
4. Talarska D, Strugala M, Szewczyczak M, et al. Is independence of older adults safe considering the risk of falls? BMC Geriatr. 2017;17:66.
5. Sattin RW. Falls among older persons: a public health perspective. Annu Rev Public Health. 1992:13:489-508.
6. Tinetti ME SM, Ginter SF. Risk factors for falls among elderly persons living in the community. N Engl J Med. 1988;319(26):1701-7.
7. Campbell AJ BM, Spears GF. Risk factors for falls in a communitybased prospective study of people 70 years and older. J Gerontol. 1989;44(4):M112-7.
8. Masud T, Morris RO. Epidemiology of falls. Age Ageing. 2001;30 Suppl 4:3-7.
9. Centers for Disease Control and Prevention. Important Facts about Falls. 2021. Available at: https://www.cdc.gov/ homeandrecreationalsafety/falls/adultfalls.html. Accessed February 11, 2023.
10. Newgard CD, Lin A, Caughey AB, et al. The cost of a fall among older adults requiring emergency services. J Am Geriatr Soc. 2021;69:38998.
11. Simpson PM, Bendall JC, Patterson J, et al. Epidemiology of ambulance responses to older people who have fallen in New South Wales, Australia. Australas J Ageing. 2013;32:171-6.
12. Quatman CE, Mondor M, Halweg J, et al. Ten years of EMS fall calls in a community: an opportunity for injury prevention strategies. Geriatr Orthop Surg Rehabil. 2018;9:2151459318783453.
13. Cone DC, Ahern J, Lee CH, et al. A descriptive study of the “lift-
18. Motamed-Jahromi M, Kaveh MH. Effective interventions on improving elderly’s independence in activity of daily living: a systematic review and logic model. Front Public Health. 2021;8:516151.
19. Harper KJ, Arendts G, Barton AD, et al. Providing fall prevention services in the emergency department: Is it effective? A systematic review and meta-analysis. Australas J Ageing. 2021;40:116-28.
20. Morello RT, Soh SE, Behm K, et al. Multifactorial falls prevention programmes for older adults presenting to the emergency department with a fall: systematic review and meta-analysis. Inj Prev. 2019;25:557-64.
21. Davenport K, Alazemi M, Sri-On J, et al. Missed opportunities to diagnose and intervene in modifiable risk factors for older emergency department patients presenting after a fall. Ann Emerg Med. 2020;76:730-8.
22. Goldberg EM, Marks SJ, Resnik LJ, et al. Can an emergency department-initiated intervention prevent subsequent falls and health care use in older adults? A randomized controlled trial. Ann Emerg Med. 2020;76:739-50.
23. Quatman-Yates CC, Wisner D, Weade M, et al. Assessment of fall-related emergency medical service calls and transports after a community-level fall-prevention initiative. Prehosp Emerg Care. 2022;26:410-21.
24. Bhasin S, Gill TM, Reuben DB, et al. A randomized trial of a multifactorial strategy to prevent serious fall injuries. N Engl J Med. 2020;383:129-40.
25. Gill TM, Bhasin S, Reuben DB, et al. Effect of a multifactorial fall injury prevention intervention on patient well-being: the STRIDE study. J Am Geriatr Soc. 2021;69:173-9.
26. Hopewell S, Adedire O, Copsey BJ, et al. Multifactorial and multiple component interventions for preventing falls in older people living in the community. Cochrane Database Syst Rev. 2018;7:CD012221.
27. Snooks HA, Anthony R, Chatters R, et al. Paramedic assessment of older adults after falls, including community care referral pathway: cluster randomized trial. Ann Emerg Med. 2017;70:495-505.
28. Agarwal G, Angeles R, Pirrie M, et al. Effectiveness of a community paramedic-led health assessment and education initiative in a seniors’ residence building: the Community Health Assessment
Western Journal of Emergency Medicine 530 Volume 24, NO.3: May 2023
Bogucki et al.
Coordinated Home Health and Safety Intervention Decreases ED Utilization by Frail Elderly
Program through Emergency Medical Services (CHAP-EMS). BMC Emerg Med. 2017;17:8.
29. Mikolaizak AS, Lord SR, Tiedemann A, et al. A multidisciplinary intervention to prevent subsequent falls and health service use following fall-related paramedic care: a randomised controlled trial. Age Ageing. 2017;46:200-7.
30. Comans TA, Currin ML, Quinn J, et al. Problems with a great idea: referral by prehospital emergency services to a community-based falls-prevention service. Inj Prev. 2013;19:134-8.
31. Mason S, Knowles E, Colwell B, et al. Effectiveness of paramedic practitioners in attending 999 calls from elderly people in the community: cluster randomised controlled trial. BMJ. 2007;335:919.
32. Logan PA, Coupland CA, Gladman JR, et al. Community falls prevention for people who call an emergency ambulance after a fall: randomised controlled trial. BMJ. 2010;340:c2102.
33. Podsiadlo D, Richardson S. The timed “Up & Go”: a test of basic functional mobility for frail elderly persons. J Am Geriatr Soc. 1991;39:142-8.
34. Centers for Disease Control and Prevention. Assessment: 30-Second Chair Stand. 2017. Available at: https://www.cdc.gov/steadi/pdf/ STEADI-Assessment-30Sec-508.pdf. Accessed February 11, 2023.
35. Duncan PW, Studenski S, Chandler J, et al. Functional reach: predictive validity in a sample of elderly male veterans. J Gerontol.
1992;47:M93-8.
36. Centers for Disease Control and Prevention. Assessment: The 4-Stage Balance Test. 2017. Available at: https://www.cdc.gov/steadi/ pdf/STEADI-Assessment-4Stage-508.pdf. Accessed February 11, 2023.
37. Harris PA, Taylor R, Thielke R, et al. Research electronic data capture (REDCap)--a metadata-driven methodology and workflow process for providing translational research informatics support. J Biomed Inform. 2009;42:377-81.
38. Harris PA, Taylor R, Minor BL, et al. The REDCap consortium: building an international community of software platform partners. J Biomed Inform. 2019;95:103208.
39. Jackson C, Kasper EW, Williams C, et al. Incremental benefit of a home visit following discharge for patients with multiple chronic conditions receiving transitional care. Popul Health Manag. 2016;19:163-70.
40. Cumming RG, Thomas M, Szonyi G, et al. Home visits by an occupational therapist for assessment and modification of environmental hazards: a randomized trial of falls prevention. J Am Geriatr Soc. 1999;47:1397-402.
41. Nikolaus T, Bach M. Preventing falls in community-dwelling frail older people using a home intervention team (HIT): results from the randomized Falls-HIT trial. J Am Geriatr Soc. 2003;51:300-5.
Volume 24, NO.3: May 2023 531 Western Journal of Emergency Medicine
Emergency Department Length of Stay Is Associated with Delirium in Older Adults
Natalie M Elder, MD*,‡
Bryn E Mumma, MD*
Meg Y Maeda, BS*
Daniel J. Tancredi, PhD†
Katren R Tyler, MD*
Section Editor: Stephen Meldon,
MD
University of California Davis School of Medicine, Department of Emergency Medicine, Sacramento, California University of California Davis School of Medicine, Department of Pediatrics, Sacramento, California
The Robert Larner College of Medicine at The University of Vermont, Department of Emergency Medicine, Burlington, Vermont
Submission history: Submitted November 8, 2022; Revision received February 15, 2023; Accepted February 17, 2023
Electronically published May 3, 2023
Full text available through open access at http://escholarship.org/uc/uciem_westjem
DOI: 10.5811/westjem.59383
Introduction: Incident delirium in older patients is associated with prolonged hospitalization and mortality. A recent study suggested an association between emergency department (ED) length of stay (LOS), time in ED hallways, and incident delirium. In this study we further evaluated the emerging association between incident delirium with ED LOS, time in ED hallways, and number of non-clinical patient moves in the ED.
Methods: We performed this retrospective cohort study at a single, urban, academic medical center. All data were extracted from the electronic health record. We included patients aged ≥65 years presenting to the ED and admitted to family or internal medicine services over a two-year period . Patients admitted to any other service, transferred from another hospital, discharged from the ED, or who underwent procedural sedation were excluded. The primary outcome was incident delirium, defined as a positive delirium screen, receipt of sedative medications, or use of physical restraints. Multivariable logistic regression models including age, gender, language, history of dementia, Elixhauser Comorbidity Index, number of non-clinical patient moves within the ED, total time spent in the ED hallway, and ED LOS were fitted.
Results: We studied 5,886 patients ≥65 years of age; median age was 77 (69-83) years; 3,031 (52%) were female, and 1,361 (23%) reported a history of dementia. Overall, 1,408 (24%) patients experienced incident delirium. In multivariable models, ED LOS was associated with development of delirium (odds ratio [OR] 1.02, 95% confidence interval [CI] 1.01-1.03, per hour), while non-clinical patient moves [OR 0.97, (95% CI 0.91-1.04) and ED hallway time [OR 0.99, 95% CI 0.98-1.01, per hour) was not associated with development of delirium.
Conclusion: In this single-center study, ED length of stay was associated with incident delirium in older adults, while non-clinical patient moves and ED hallway time in the ED were not. Health systems should systemically limit time in the ED for admitted older adults. [West J Emerg Med. 2023;24(3)532–537.]
INTRODUCTION
Delirium, an acute, fluctuating condition with an alteration in level of consciousness associated with inattention and disorganized thinking, is the most common complication
in hospitalized patients ≥65 years in age. It affects more than 2.6 million older adults each year with substantial annual costs for advanced healthcare systems, estimated to be between $38-152 billion in the United States (US).2-4 Delirium
Western Journal of Emergency Medicine 532 Volume 24, NO.3: May 2023 * † ‡
Original Research
substantially impacts mortality, morbidity, and hospital length of stay (LOS).5,6 Delirium outcomes are worse in patients with dementia, and delirium may contribute to the development of dementia.7,8 Furthermore, preventing episodes of delirium may help to prevent dementia.9
Incident delirium is delirium that was not present on initial evaluation and develops during the hospital encounter. Known risk factors for incident delirium include sleep deprivation, lack of natural light, ambient noise, infection, immobility, urinary catheterization, malnutrition, history of cognitive impairment, pain, and acute medical conditions.10 Protective factors include early mobilization, maintenance of diurnal rhythms, and adequate hydration. The emergency department (ED) epitomizes a clinical space that is likely to precipitate delirium, especially if the exposure is prolonged or intense. As hospitals and EDs become more crowded, patients are spending more time in the ED. Early data from inpatient settings suggests that multiple bed moves are associated with increased delirium.11-13 However, it is unknown whether unnecessary non-clinical bed moves within the ED, in addition to the risks of longer ED LOS, are associated with development of incident delirium in older patients.
Our objective in this study was to evaluate the association between development of incident delirium during admission and (a) ED LOS, (b) ED hallway time, and (c) number of times a patient is moved from one treatment space to another for non-clinical reasons within the ED.
METHODS
Study Design and Setting
This retrospective cohort study was performed at a single, urban, academic ED with approximately 65,000 adult ED encounters annually. The study period extended from January 1, 2018–December 31, 2019. This study was approved by the local institutional review board.
Study Population
We included consecutive patients ≥65 years presenting to the ED and admitted to the hospital on the internal medicine or family and community medicine services. Patients admitted to the ED observation unit prior to hospital admission were included in the study cohort. Patients were excluded if they were admitted to any other service, were admitted to an intensive care unit, were interfacility transfers from another health system, or were discharged directly from the ED or the ED observation unit. Also excluded were patients who underwent procedural sedation in the ED or as inpatients. We defined inclusion and exclusion criteria prior to data collection.
Data Collection
All study data were directly extracted from the local electronic health record system (EHR) (Epic Systems Corporation, Verona, WI) by information technology (IT) data analysts. The IT data analysts were blinded to the study’s hypothesis and objectives. As part of the standard institutional
Population Health Research Capsule
What do we already know about this issue? Older adults are vulnerable to developing incident delirium during their emergency department (ED) stay.
What was the research question? Is incident delirium associated with ED length of stay, time in the hallway, and number of bed movements?
What was the major finding of the study? Length of stay in the ED was associated with development of incident delirium (OR 1.02, 95% CI 1.01-1.03, per hour).
How does this improve population health? Delirium is harmful, preventable, and costly to our healthcare system. Older adults should be given priority for bed assignment after admission.
data curation process, we validated key variables and a representative sample of complete records prior to final data extraction. Key variables validated included time intervals, number and type of bed moves, medication administration, restraint use, and delirium screen. The institutional data team had previously validated the Elixhauser Comorbidity Index (ECI) for data extraction. We did not manually review or abstract data for the final dataset. For this reason, using data abstraction forms, training and monitoring data abstractors, and measuring interobserver reliability as would be done for traditional chart review studies were not applicable.14
Measurements
Key variables collected included patient demographics, ECI, history of dementia, time intervals in the ED, total number and type of patient movements in the ED, use of sedative medications, use of physical restraints, results of the Confusion Assessment Method–Intensive Care Unit (CAM-ICU) delirium screen, and encounter diagnoses. We calculated the ECI for each record according to the methodology described by van Walraven et al, and assigned the corresponding point value when a condition was present.15-17 The score ranges from -19 to 89, with a higher score indicating higher likelihood of in-hospital death. We defined total ED LOS as the interval from ED arrival to physical departure from the ED; this included ED waiting time, ED treatment time, and any boarding time after the admission orders were placed in which the patient remained in the ED. Waiting time was defined as the interval from ED arrival to
Volume 24, NO.3: May 2023 533 Western Journal of Emergency Medicine Elder et al ED Length of Stay is Associated with Delirium in Older Adults
placement in a treatment bed or assignment of an attending physician to the patient, whichever occurred first. This included time spent in ED intake, triage, and waiting for a treatment bed. We defined ED treatment time as the interval from placement in an ED treatment bed to placement of inpatient bed request. Admit order time was defined as the interval from placement of an inpatient bed request to receipt of inpatient admission orders. Hallway time was defined as any time spent in a hallway bed. Throughout the study period, hallway beds were used only in the ED and not in the inpatient areas.
Patient moves were divided into clinical and non-clinical patient moves. We defined clinical patient moves as a patient changing physical locations between ED arrival and physical departure from the ED that directly advanced patient care. Examples include moving from ED triage to an ED treatment bed or from an ED treatment bed to ED radiology imaging. Nonclinical patient moves were defined as those that did not directly advance patient care. For example, moving from triage to any waiting area (waiting room or hallway waiting) or from one ED treatment bed to another was a non-clinical patient move.
Sedative medications included oral and parenteral benzodiazepines (lorazepam, midazolam, diazepam) and antipsychotic agents (haloperidol, olanzapine, risperidone, quetiapine) administered at any time during the patient’s ED or inpatient stay. Medications that were ordered but not administered were not included. Neither did we include antihistamines (diphenhydramine) or medications given for insomnia (melatonin, zolpidem).
The use of restraints was defined as an EHR order for any level of physical restraints during the ED or inpatient stay.
The CAM-ICU is the institutional delirium screen used in all levels of inpatient care. During inpatient care, the CAMICU was recorded by nursing staff twice daily. The CAM-ICU was variably recorded in the ED. Any positive CAM-ICU screen was considered to indicate the presence of delirium.
Outcomes
Delirium was the primary outcome, defined as the composite outcome of a positive CAM-ICU screen at any time, administration of sedative medication, or use of patient restraints. We considered use of sedative medications and physical restraints to be a proxy for acute confusion, which equates to a positive CAM-ICU. Secondary outcomes included individual elements of the primary composite outcome: a positive CAM-ICU screen, administration of sedative medication, or use of physical restraints.
Analysis
Analyses began with descriptive statistics. Logistic regression models with robust standard errors were fitted with the primary composite outcome as the dependent variable and the following independent variables: age; gender; English language preference; history of dementia; ECI, number of unnecessary non-clinical bed moves within the ED; total hallway time in
the ED; ED LOS; and hospital LOS. We also fitted Poisson regression models with the same covariates with hospital LOS as the exposure, as the relationship between incident delirium and hospital LOS is bi-directional and complex. Patients missing outcome or predictor variables were excluded from analyses including the missing variables. We conducted all analyses using Stata 14 (StataCorp LP, College Station, TX).
RESULTS
Characteristics of Study Subjects
During the study period from January 1, 2018–December 31, 2019, 13,601 patients ≥65 years of age were admitted to our hospital. Sixty-six patients underwent procedural sedation during the admission and were excluded, resulting in a population of 13,535 patients. Of these, 5,886 patients were admitted from the ED to the internal medicine or family and community medicine service. This cohort included 3,031 (52%) women and 1,361 (23%) patients with a documented history of dementia. The study population included White non-Hispanic/ Latinx (3,058; 52%), Black (802; 14%), Hispanic/Latinx (671; 11%), and Asian (601; 10%) patients (Table 1). No patients
Western Journal of Emergency Medicine 534 Volume 24, NO.3: May 2023
al
ED Length of Stay is Associated with Delirium in Older Adults Elder et
Characteristic N (%) Age* 77 (69, 83) Female gender 3,031 (51%) Race/ethnicity White 3,058 (52%) Black 802 (14%) Hispanic or Latinx 671 (11%) Asian 601 (10%) Multiracial/other 709 (12%) Not available 45 (1%) English-language preference 4,799 (81%) History of dementia 1,361 (23%) Elixhauser Comorbidity Index* 18 (10, 26) ED length of stay (hours)* 16 (8.0, 21) ED wait time (hours)* 1.2 (0.1, 1.6) ED treatment time (hours)* 4.1 (2.2, 4.8) ED hallway time (hours)* 1.5 (0.6, 4.7) Total ED non-clinical patient moves 0 1,172 (20%) 1 2,413 (41%) 2 1,625 (28%) 3 or more 676 (11%) Positive CAM-ICU screen 592 (10%) Use of physical restraints 189 (3%) Use of sedative medication 1,086 (18%)
presented as median (25th, 75th percentile) ED, Emergency
CAM-ICU
Confusion Assessment Method.
*Data
department;
,
Table 1. Demographic and clinic characteristics (N=5,886).
Elder et al ED Length of Stay is Associated with Delirium in Older Adults
were excluded due to missing data.
Main Results
Approximately one in four patients (1,408/5,886; 24%) experienced the primary composite outcome of a positive CAMICU screen, use of sedative medications, or use of physical restraints; 592 (10%) had a positive CAM-ICU screen; 1,086 (18%) received sedative medications; and 189 (3%) were physically restrained. After adjusting for demographic and clinical factors, ED LOS per hour was independently associated with both the primary composite outcome (odds ratio [OR] 1.02, 95% confidence interval [CI] 1.01-1.03) and the secondary outcomes of positive CAM-ICU screen (OR 1.02, 95% CI 1.001.02), administration of sedative medications (OR 1.02, 1.011.02), and use of physical restraints (OR 1.02, 95% CI 1.01-1.02) (Table 2). Male patients were more likely to receive physical restraints (OR 1.40, 95% CI 1.03-1.89) and less likely to receive sedative medication (OR 0.85, 95% CI 0.75-0.98) compared to female patients. Higher ECI score was associated with all outcomes (Table 2). The number of ED non-clinical patient moves were not associated with the primary composite outcome (OR 0.97, 95% CI 0.91-1.04) or secondary outcomes (Table 2).
DISCUSSION
Delirium is a common, expensive to treat, and partially preventable condition in older adults that is under-recognized and may have devastating sequelae.4,18 The ED environment may promote the development of incident delirium.19-21 Associations between ED LOS and incident delirium have been recently described.1,22 Our study also found ED LOS associated with the development of incident delirium.
Multiple room transfers have been associated with incident delirium and with falls in the ED1 and inpatient setting.11-13 The current study of older adults did not find a significant association between the development of incident delirium and non-clinical patient moves within the ED. However, only 11% of our cohort underwent three or more non-clinical patient moves. It is possible that the low number
of non-clinical patient moves in our cohort mitigated the development of incident delirium. Our study of older adults did not find an association between time spent in the ED hallway and incident delirium in contrast to a prior study.18
Multiple screening tools for delirium exist23; in this study we used the CAM-ICU delirium screening tool built into the institution’s EHR. The feasibility of screening for delirium in the ED and in the inpatient setting remains complex. Clinician gestalt without a formal screening tool is associated with poor sensitivity and specificity.21,23 The CAM-ICU is brief, easy to administer, and has been shown to have excellent specificity in older adult ED patients (although specificity decreases in patients who have dementia).24 Both sedative medications and restraints are more frequently used when behaviors associated with hyperactive delirium are present such as agitation or attempts to get out of bed. It is likely that patients with hypoactive or mixed delirium are undercounted using this primary composite model, as it is easier to clinically recognize hyperactive delirium than hypoactive delirium. Prior research in the ED suggests that hyperactive delirium accounts for less than 10% of ED delirium, while hypoactive or mixed delirium is more common, less likely to be recognized, and accounts for substantial mortality.18,25
Approximately 10% of patients in this study screened CAM-ICU positive. English-speaking patients were more likely to have a positive CAM-ICU screen. The CAM-ICU requires excellent English comprehension; patients who do not have conversational English may be disadvantaged, even with liberal use of interpreters.
Nearly 20% of older inpatients admitted through the ED received a sedative medication at some point during their hospitalization. With known exceptions, such as alcohol or benzodiazepine withdrawal, sedative medications do not treat the underlying processes precipitating delirium. Of note, we found that female patients were significantly more likely to have sedative medications administered. In contrast, male patients were more likely to be physically
Volume 24, NO.3: May 2023 535 Western Journal of Emergency Medicine
Primary outcome Secondary
Variable Incident delirium N=1,408 Positive CAM-ICU screen, N=592 Sedative medication N=1,086 Physical restraint use N=189 Age (per year) 0.98 (0.98-0.99) 1.02 (1.02-1.09) 0.97 (0.96-0.98) 1.00 (0.98-1.02) Male gender 0.86 (0.75-0.97) 1.01 (0.84-1.21) 0.85 (0.75-0.98) 1.40 (1.03-1.89) English language 1.72 (1.45-2.05) 1.33 (1.05-1.69) 1.95 (1.59-2.38) 0.81 (0.56-1.17) History of dementia 2.86 (2.48-3.30) 3.00 (2.49-3.63) 2.34 (1.99-2.73) 4.64 (3.35-6.42) Elixhauser Comorbidity Index (per 10 points) 1.02 (1.01-1.02) 1.03 (1.03-1.04) 1.01 (1.00-1.01) 1.02 (1.01-1.03) Total ED non-clinical bed moves 0.97 (0.91-1.04) 1.00 (0.91-1.10) 0.99 (0.92-1.06) 1.15 (0.98-1.34) ED hallway time (per hour) 0.99 (0.98-1.01) 1.00 (0.98-1.02) 0.99 (0.98-1.01) 1.00 (0.97-1.03) ED LOS (per hour) 1.02 (1.01-1.03) 1.02 (1.00-1.02) 1.02 (1.01-1.02) 1.02 (1.01-1.02)
outcomes
Table 2. Multivariable logistic regression results.
CAM-ICU, Confusion Assessment Method; ED, emergency department; LOS, length of stay. Data are presented as odds ratios with 95% confidence intervals.
ED Length of Stay is Associated with Delirium in Older Adults
restrained. To our knowledge, there are no prior studies that have reported gender differences in the management of delirium in older adults.
Physical restraints were used in 3% of older adults in this study, most commonly in patients with history of dementia and in male patients. This proportion is substantially lower than recent reports showing restraint use in hospitalized non-critical care patients to be between 8.5-11.8%.26,27 Restraints have not been shown to reduce falls and may increase the risk of developing delirium in hospitalized patients,26,28 highlighting the importance of minimizing restraint use in older adults.
LIMITATIONS
This retrospective cohort study was performed at a single, urban, academic hospital, and our experiences may differ from those in other institutions. While this study has the limitations inherent in a retrospective cohort study, it is strengthened by adherence to applicable methodologic recommendations.14 During the study period, delirium screening was not consistently performed in the ED, limiting our ability to identify delirium that was present on arrival. This study did not adjust for receipt of opioids or adequacy of pain control measures. Other risk factors for developing delirium that were not routinely documented in the EHR included living in a residential care facility, sensory impairments such as hearing or vision loss, and outpatient polypharmacy.
CONCLUSION
This study builds on recent work that suggests prolonged ED length of stay is harmful for older patients who require admission. Longer ED LOS (per additional hour) was significantly associated with the development of delirium in older patients admitted to the hospital. Patients and health systems will benefit if admitted older patients, especially those with a history of dementia and multiple comorbidities, are promptly assigned and moved to a hospital inpatient bed, minimizing their length of stay in the ED.
Address for Correspondence: University of Vermont, Department of Emergency Medicine, 111 Colchester Ave, Burlington, VT 05401. Email: natalie.elder@uvmhealth.org
Conflicts of Interest: By the WestJEM article submission agreement, all authors are required to disclose all affiliations, funding sources and financial or management relationships that could be perceived as potential sources of bias. No author has professional or financial relationships with any companies that are relevant to this study. There are no conflicts of interest or sources of funding to declare.
Copyright: © 2023 Elder et al. This is an open access article distributed in accordance with the terms of the Creative Commons Attribution (CC BY 4.0) License. See: http://creativecommons.org/ licenses/by/4.0/
REFERENCES
Elder
1. van Loveren K, Singla A, Sinvani L, et al. Increased emergency department hallway length of stay is associated with development of delirium. West J Emerg Med. 2021;22(3):726-35.
2. Leslie DL, Marcantonio ER, Zhang Y, et al. One-year health care costs associated with delirium in the elderly population. Arch Intern Med. 2008;168(1):27-32.
3. Gou RY, Hshieh TT, Marcantonio ER, et al. One-year Medicare costs associated with delirium in older patients undergoing major elective surgery. JAMA Surg. 2021;156(5):430-42.
4. Caplan GA, Teodorczuk A, Streatfeild J, et al. The financial and social costs of delirium. Eur Geriatr Med.2020;11(1):105-12.
5. Witlox J, Eurelings LS, de Jonghe JF, et al. Delirium in elderly patients and the risk of postdischarge mortality, institutionalization, and dementia: a meta-analysis. JAMA. 2010;304(4):443-51.
6. Goldberg TE, Chen C, Wang Y, et al. Association of delirium with long-term cognitive decline: a meta-analysis. JAMA Neurol 2020;77(11):1373-81.
7. Fong TG, Jones RN, Marcantonio ER, et al. Adverse outcomes after hospitalization and delirium in persons with Alzheimer disease. Ann Intern Med. 2012;156(12):848-56.
8. Gross AL, Jones RN, Habtemariam DA, et al. Delirium and long-term cognitive trajectory among persons with dementia. Arch Intern Med 2012;172(17):1324-31.
9. Fong TG, Davis D, Growdon ME, et al. The interface between delirium and dementia in elderly adults. Lancet Neurol. 2015;14(8):82332.
10. Ahmed S, Leurent B, Sampson EL. Risk factors for incident delirium among older people in acute hospital medical units: a systematic review and meta-analysis. Age Ageing. 2014;43(3):326-33.
11. Ranasinghe C, Fleury A, Peel NM, et al. Frailty and adverse outcomes: impact of multiple bed moves for older inpatients. Int Psychogeriatr. 2017;29(2):345-9.
12. Evensen S, Saltvedt I, Lydersen S, et al. Environmental factors and risk of delirium in geriatric patients: an observational study. BMC Geriatr. 2018;18(1):282.
13. Goldberg A, Straus SE, Hamid JS, et al. Room transfers and the risk of delirium incidence amongst hospitalized elderly medical patients: a case-control study. BMC Geriatr. 2015;15:69.
14. Worster A, Bledsoe RD, Cleve P, et al. Reassessing the methods of medical record review studies in emergency medicine research. Ann Emerg Med. 2005;45(4):448-51.
15. Elixhauser A, Steiner C, Harris DR, et al. Comorbidity measures for use with administrative data. Med Care. 1998;36(1):8-27.
16. van Walraven C, Austin PC, Jennings A, et al. A modification of the Elixhauser comorbidity measures into a point system for hospital death using administrative data. Med Care. 2009;47(6):626-33.
17. Austin SR, Wong YN, Uzzo RG, et al. Why Summary comorbidity measures such as the Charlson Comorbidity Index and Elixhauser score work. Med Care. 2015;53(9):e65-72.
18. Han JH, Zimmerman EE, Cutler N, et al. Delirium in older emergency
Western Journal of Emergency Medicine 536 Volume 24, NO.3: May 2023
et al
Elder et al
department patients: recognition, risk factors, and psychomotor subtypes. Research Support, Non-U.S. Gov’t. Acad Emerg Med 2009;16(3):193-200.
19. Oliveira J. e Silva L, Berning MJ, Stanich JA, et al. Risk factors for delirium in older adults in the emergency department: a systematic review and meta-analysis. Ann Emerg Med. 2021
20. Émond M, Boucher V, Carmichael PH, et al. Incidence of delirium in the Canadian emergency department and its consequences on hospital length of stay: a prospective observational multicentre cohort study. BMJ Open. 2018;8(3):e018190.
21. Boucher V, Lamontagne ME, Nadeau A, et al. Unrecognized incident delirium in older emergency department patients. J Emerg Med 2019;57(4):535-42.
22. Bo M, Bonetto M, Bottignole G, et al. Length of stay in the emergency department and occurrence of delirium in older medical patients. J Am Geriatri Soc. 2016;64(5):1114-9.
23. Carpenter CR, Hammouda N, Linton EA, et al. Delirium prevention,
ED Length of Stay is Associated with Delirium in Older Adults
detection, and treatment in emergency medicine settings: A Geriatric Emergency Care Applied Research (GEAR) Network Scoping Review and Consensus Statement. Acad Emerg Med. 2021;28(1):19-35.
24. Han JH, Wilson A, Graves AJ, et al. Validation of the Confusion Assessment Method for the Intensive Care Unit in older emergency department patients. Acad Emerg Med. 2014;21(2):180-7.
25. Han JH, Eden S, Shintani A, et al. Delirium in older emergency department patients is an independent predictor of hospital length of stay. Acad Emerg Med. 2011;18(5):451-7.
26. Lach HW, Leach KM, Butcher HK. Evidence-based practice guideline: changing the practice of physical restraint use in acute care. J Gerontol Nurs. 2016;42(2):17-26.
27. Thomann S, Zwakhalen S, Richter D, et al. Restraint use in the acute-care hospital setting: a cross-sectional multi-centre study. Int J Nurs Stud. 2021;114:103807.
28. Inouye SK, Westendorp RG, Saczynski JS. Delirium in elderly people. Lancet. 2014;383(9920):911-22.
Volume 24, NO.3: May 2023 537 Western Journal of Emergency Medicine
Characterizing Social Insecurity in a Rural North Carolina Emergency Department
Elizabeth Gignac, DO
Godwin Y. Dogbey, PhD
Aleksandr Pevtsov, DO
Autumn Bass, DO
Tibor Nagy, DO
Amna Farshori, DO
Grace D. Brannan, PhD
Campbell University School of Osteopathic Medicine, Harnett County, North Carolina
Section Editor: Emily Cleveland Manchanda, MD, MPH
Submission history: Submitted September 2, 2021; Revision received December 12, 2022; Accepted February 2, 2023
Electronically published April 26, 2023
Full text available through open access at http://escholarship.org/uc/uciem_westjem
DOI: 10.5811/westjem.54605
Introduction: Social insecurity, a form of deprivation of social amenities, if present among patients presenting in a rural emergency department (ED) can be a source of medical burden and poor health outcomes. Although knowledge and understanding of the insecurity profile of such patients is necessary for targeted care that improves their health outcomes, the concept has not been comprehensively quantified. In this study we explored, characterized, and quantified the social insecurity profile of ED patients at a rural teaching hospital in southeastern North Carolina with a large Native American population.
Methods: A paper survey questionnaire was administered by trained research assistants between May–June 2018 to patients who presented to the ED and consented to participate in this cross-sectional, singlecenter study. The survey was anonymous with no identifying information collected on the respondents. A general demographic section and questions derived from the literature capturing sub-constructs of social insecurity—communication access, access to transportation, housing insecurity and home environment, food insecurity, and exposure to violence–were captured in the survey. We assessed the factors included in the index of social insecurity based on a rank ordering using the magnitude of their coefficient of variation and the Cronbach’s alpha reliability index of the constituent items.
Results: Overall, we collected 312 surveys from the approximately 445 administered and included them in the analysis, representing a response rate of about 70%. The average age of the 312 respondents was 45.1 (±17.7) years with a range of 18.0-96.0. More females (54.2%) than males participated in the survey. Native Americans (34.3%), Blacks (33.7%), and Whites (27.6%) comprised the three major racial/ethnicity groups of the sample, which are representative of the study area’s population distribution. Social insecurity was observed among this population regarding all the subdomains and an overall measure (P <.001). We identified three key determinants of social insecurity—food insecurity, transportation insecurity, and exposure to violence. Social insecurity significantly differed overall and among the three of its key constituent domains by patients’ race/ethnicity and gender (P <.05).
Conclusion: Emergency department visits in a rural North Carolina teaching hospital are characterized by a diverse patient population, including patients with some degree of social insecurity. Historically marginalized and minoritized groups including Native Americans and Blacks demonstrated overall higher rates of social insecurity and higher indexes on exposure to violence than their White counterparts. Such patients struggle with basic needs such as food, transportation, and safety. As social factors play a critical role in health outcomes, supporting the social well-being of a historically marginalized and minoritized rural community would likely help build the foundation for safe livelihood with improved and sustainable health outcomes. The need for a more valid and psychometrically desirable measurement tool of social insecurity among ED populations is compelling. [West J Emerg Med. 2023;24(3)538–546.]
Western Journal of Emergency Medicine 538 Volume 24, NO.3: May 2023 Original Research
INTRODUCTION
Emergency departments (ED) across the United States (U.S.) frequently serve as medical safety nets for marginalized and excluded populations. The ED has become the oasis of primary healthcare access for patients who are uninsured, underinsured, low income, and homeless.1-6 Prior studies suggest that any forms of social deprivation can significantly and negatively impact health outcomes in a given population.4,7-9 The concept of social insecurity, in a healthrelated context, has been studied or described in various ways without a clear consensus. Studies involving any semblance of social insecurity have been situated within the context and conceptual framework of social determinants of health (SDOH).4,7,10,11
Social insecurity can be construed as the multitude of social factors that increase threats and risks to people’s lives and the likely negative impacts on their health outcomes.10 Social insecurity can be described as an overarching factor among the plethora of factors that underpins healthcare disparities in the U.S. It undergirds many of the variables associated with lack of access to affordable and quality healthcare.7 Underlying social insecurity is the coexistence of economic deprivation and inequity. Some researchers have measured a community’s degree of disparity using the Deprivation Index, which consists of four indicators: unemployment; social class; type of housing tenure; and car ownership.7, 11,13 Other variables such as race/ethnicity, income, food availability, and education are often incorporated in analyses of a community’s Deprivation Index.11,12
The literature on SDOH has highlighted the association between social factors and health outcomes of the population. However, studies that have coherently examined multiple factors in defining and characterizing social insecurity among rural populations have been scanty.4,5,7-12 Our study took a more coherent and comprehensive approach to explore, characterize, and quantify social insecurity in a unique and previously unstudied population. We explored the factors contributing to social insecurity in a rural community teaching hospital with a large Native American population. We hypothesized that patient demographics, namely age, race/ ethnicity, and gender, would be associated with the key factors or sub-domains of social insecurity.
METHODS
Study Design and Location
This was a cross-sectional study conducted at the ED of University of North Carolina (UNC) Health Southeastern in Lumberton, NC. Lumberton is the most populated city in Robeson County, which is one of the largest and poorest counties in the state. Robeson County measures 973 square miles, and UNC Southeastern is the sole regional medical center in the county. This rural hospital serves a diverse, medically disinvested, and economically impoverished population. Life expectancy in Robeson County is the lowest of all counties
What do we already know about this issue? Social determinants of health critically impact the health outcomes of individuals and communities.
What was the research question? We sought to determine, characterize, and quantify the social insecurity profile of a rural ED patient population.
What was the major finding of the study? Significant race/ethnicity and gender differences exist between Native Americans/ Blacks compared to Whites in three key constituent domains of social insecurity: Food insecurity, transportation insecurity, and exposure to violence. (P<.05).
How does this improve population health? Supporting the social well-being of historically marginalized rural populations is imperative for building safe and sustainable livelihoods with improved health outcomes.
in the state. In 2015 it ranked 100 of 100 counties in “health factors” and 95 of 100 counties in “health outcomes.”6,21-24 Additionally, Robeson County is home to the Lumbee Tribe of North Carolina, a state-recognized Native American tribe without federal benefits, which comprises nearly 40% of the population.24 Compared to the U.S. median household income of $63,179 during the study period, the median household income in Robeson County was just $34,976.24 Furthermore, only 14% of Robeson County residents have achieved an education level of Bachelor’s degree or higher, compared with nearly 33% of the U.S. population.23
For this cross-sectional study, we implemented an intercept survey method with convenience sampling of ED patients at UNC Southeastern. Although it was a convenience sampling, it bore some resemblance to a quasi-random sampling. Research assistants (RA) were present at varying times in alternating sequence and, except for the exclusion criteria, every patient had equal opportunity to participate in the survey.
Participants: Recruitment, Informed Consent, and Inclusion/Exclusion Criteria
The research team, including trained RAs, administered a survey questionnaire to ED patients who met inclusion criterion between May–June 2018. The inclusion criterion was subjects ≥18 years of age who completed a consent process.
Volume 24, NO.3: May 2023 539 Western Journal of Emergency Medicine Gignac et al. Characterizing Social Insecurity in a Rural North Carolina ED
Population Health Research Capsule
Characterizing Social Insecurity in a Rural North Carolina ED
We excluded subjects who were non-English speaking, currently incarcerated, presented with psychiatric chief complaints, or those who presented as critically ill. Subjects were not screened for literacy, but upon a subject’s request, RAs provided verbal assistance with survey completion. The survey questionnaires were printed and placed in sealed envelopes by the subjects, and their anonymity was preserved.
Construct of Social Insecurity
After reviewing prior research on SDOH, we identified five major domains as the framework for evaluating social insecurity.1,5,7,13 The five domains underlying the construct of social insecurity with their associated number of survey questions are as follows9:
• Communication access (3 items)
• Access to transportation (4 items)
• Housing security and home environment (3 items)
• Food insecurity (3 items)
• Exposure to violence (5 items)
The survey questions reflected these overarching themes found in various prior works involving SDOH. Additionally, we collected sociodemographic information from the participants. Beyond the five domains listed above, we aimed to identify other nuances of social insecurity.
Data Analysis
We generated descriptive statistics, such as frequencies/ percentages for categorical variables, and determined means, ranges, and standard deviations for continuous variables. To quantify social insecurity, we constructed a scoring index using items of the sub-domains and an overall score consisting of all the items together. We performed reliability analysis (as measured by the Cronbach’s alpha) for each item of the sub-domains, and for the overall construct of social insecurity. Furthermore, we used a rank ordering of the factors based on coefficient of variation (CV) in conjunction with the Cronbach’s alpha to select the factors to be included in the social insecurity index construction. We performed a preliminary multivariate analysis by using the sub-domains as dependent variables and demographics (age, gender, and ethnicity) as independent variables. Following that analysis, we determined statistically significant group differences with respect to continuous variables by using parametric (or non-parametric equivalents where necessary) tests such as analysis of variance (ANOVA), independent samples t-test, and one-sample t-test as appropriate. Statistical significance level was set at a P-value of of less than 5% for all inferential questions. We used SPSS Statistical Program version 27 (IBM Corporation, Armonk, NY) to analyze the data.
RESULTS
Demographics
The average age of the respondents was 45.1 (±17.7) years ranging from 18.0-96.0 years. Table 1 presents the
demographic profile of the survey respondents. Overall, 312 surveys were collected from the approximately 445 administered and included in the analysis, representing a response rate of about 70%. Of the 312 respondents, 92.3% lived in Robeson County and 45.8% were male. The race/ ethnicity distribution was almost evenly divided between Native American (34.4%), Black (33.7%), and White (27.6). The remainder was Hispanic or “other.” It should be noted that this demographic of race/ethnicity distribution of the survey participants/respondents intimately mirrors that of the population of Robeson County.21,24
Domains and Item Analyses of Social Insecurity Manifestations
Table 2 outlines the response distribution over the five sub-domains of social insecurity among the respondent patients presenting to the ED of a large, rural teaching medical center. In all, 18 binary-anchored (0=no and 1=yes) items constituted social insecurity across each of the delineated five sub-domains. The items were intentionally calibrated such that a total response score of zero would indicate low while 18 would indicate high as a measure of overall social insecurity. We reverse coded items to correspond to the direction of the core items for consistency of the score—8 of the 18 items were reverse coded. The reverse coded items were 1,
4, 5,
Western Journal of Emergency Medicine 540 Volume 24, NO.3: May 2023
Gignac et al.
2,
Characteristic Number of responses Percent Gender Female 169 54.2 Male 143 45.8 Race/Ethnicity Native American/Alaska Native 107 34.3 Black 105 33.7 Hispanic 3 1.0 White 86 27.6 Other (including more than one category) 11 3.5 Highest education completed Less than high school 75 24.0 High school graduate 130 41.7 Some college/associate degree 89 28.5 Bachelor’s degree 11 3.5 Advanced degree 7 2.2 Lives in Robeson County Yes 288 92.3 No 24 7.7
Table 1. Demographic characteristics of respondents (N=312).
Table 2. Response frequencies by subdomains and associated items of social insecurity construct.
*Missing data was omitted; thus, n varies from item to item.
6, 7, 9, and 12 (refer to Table 2). For each of the sub-domains the ranges were 0-3 for communication, housing security and environment, food insecurity; 0-4 for transportation; and 0-5 for violence exposure. These ranges defined the number of items that composed each of the sub-domains of the overall social insecurity construct.
We conducted a reliability analysis on the items within each domain as well as for all the items overall. Table 3 shows the results of Cronbach’s alphas from the reliability analysis of the items in each sub-domain, as well as all the items together (overall). Three of the observed reliabilities and overall were fair and acceptable (Cronbach’s alpha ≥ 0.6); however, the negative reliability of the items underlying the communication sub-domain, although problematic, might hold plausible explanations that would be of policy relevance. Furthermore,
**Overall + mean summative score of the
the relatively low reliability for housing insecurity may need further exploration.
In Table 4, the mean of the overall summated social insecurity measure was higher than zero suggesting the
Volume 24, NO.3: May 2023 541 Western Journal of Emergency Medicine Gignac et al. Characterizing Social Insecurity in a Rural North Carolina ED
Yes No Subdomain and items n % n % Communication 1. Do you have a traditional phone line (“land line”) in your home? 116 37.2 196 62.8 2. Do you have a personal cell phone (not shared with another person)? 268 85.9 44 14.1 3. Are there ever times you need to make a phone call, but do not have access to a phone? 68 21.9 242 78.1 Transportation 4. Do you have a government-issued identification card such as a driver ’s license, state ID or passport? 294 94.5 17 5.5 5. Do you have a valid driver’s license? 209 67.0 103 33.0 6. Do you have reliable transportation to get to an appointment in Robeson County? 274 87.8 38 12.2 7. Do you have reliable transportation to get to an appointment outside Robeson County? (For example, Raleigh, Durham, Chapel Hill, or Wilmington) 241 77.5 70 22.5 Housing security and home environment 8. At any time in the past 12 months have you been homeless? 37 11.9 274 88.1 9. Does your home have running water and electricity? 308 98.7 4 1.3 10. In the past 12 months have you been without water or electricity at home because the bill was not paid? 29 9.3 282 90.7 Food insecurity 11. Are there ever times when you run out of food because you do not have money to buy more? 85 27.2 227 72.8 12. Do you have access to the types of food you believe are healthy? 273 88.1 37 11.9 13. Do you ever have to cut the size of your meals or skip them because of limited budget for food? 84 27.1 226 72.4 Exposure to violence 14. Has your home ever been robbed? 89 28.7 221 71.3 15. Have you ever been threatened with a gun? 83 26.9 226 73.1 16. Have you ever been shot with a gun? 32 10.3 278 89.7 17. Has anyone in your family ever been shot with a gun? 96 31.0 214 69.0 18. Has anyone in your family ever died of a gunshot wound? 54 17.4 256 82.6
Subdomain Cronbach alpha Communication -0.147 Transportation 0.603 Housing insecurity 0.439 Food insecurity 0.713 Exposure to violence 0.627 Overall** 0.759
Table 3. Reliability coefficients for each subdomain and the overall.
subdomains.
Table 4. Descriptive statistics of the subdomains and overall score of social insecurity.
*Sample size varied due to missing values.
**Due to missing values the range of the overall was 0-14 rather than the theorized 0-18. #A one-sample t-test showed that all the means were different than zero, (P < 0.001), indicating somewhat the presence of social insecurity. CV, coefficient of variation.
presence of perceived social insecurity among the population under study. To account for scaling differences in the constituent number of items, rank ordering of the summated sub-domains from the highest to the least contributing subdomain to overall social insecurity (using CV = standard deviation/mean) yielded the following:
1. Housing insecurity
2. Food insecurity
3. Transportation
4. Exposure to violence
5. Communication
Although from the CV ordering, housing insecurity commanded a first place among the five sub-domains, its Cronbach’s alpha reliability index was not satisfactory: It was lower than the conventionally acceptable value of at least 0.6 for the purpose of this study. Hence, it would not be considered a factor in the quantification of the measurement of social insecurity in the population under study. Communication was the least in the CV ranking with even an unacceptable negative Cronbach’s alpha value. Thus, examining the results of the Cronbach’s alpha reliability analysis in tandem with the CV ordering, the top three factors of the five constituting social insecurity would be as follows: exposure to violence; transportation; and food insecurity in relative increasing order of importance.
Age, Gender, Race/Ethnicity, and Social Insecurity
In an initial multivariate analysis involving demographic variables age, gender, and race/ethnicity, age did not significantly predict any of the three social insecurity subdomains. Following up using an ANOVA, we observed statistically significant differences among the three major ethnicity classifications of the population under study, namely Native American, Black, and White, regarding social insecurity overall and for each of the three key sub-domains—exposure to violence, transportation insecurity, and food insecurity. Native Americans/Alaska Natives and Blacks on average did not show a statistically significant difference in their index score of overall social insecurity (P=.79). However, Whites had
on average, a statistically significant lower measure of social insecurity than American Indians/Alaska Natives (P< .001) and Blacks (P=.004). The results for the sub-domain of exposure to violence were similar; no statistically significant difference was observed between Native Americans/Alaska Natives and Blacks (P=1). However, statistically significant differences were observed between Whites and Native Americans/Alaska Natives (P<.001), and Blacks (P=.001). Whites on average had a lower index of exposure to violence than the other two race/ ethnicity categories. On transportation insecurity, there was only a statistically significant difference between Native Americans/ Alaska Natives and Whites (P=.03) with the former showing a higher index compared to the latter. Food insecurity yielded similar results, but in this case, the difference was between Whites and Blacks (P=.04).
Similarly, gender differences were observed for the overall measure of social insecurity as well as the three key sub-domains—exposure to violence, transportation, and food insecurity. Males on average than females exhibited higher overall social insecurity (P<.001). The same was true for exposure to violence (P<.001) and transportation insecurity (P=.004), but no statistically significant difference in food insecurity (P=.59) was observed.
DISCUSSION
In this study we sought to determine, characterize, and quantify the most common elements of the social landscape that are associated with the patient population of this rural ED. The study presents an exploratory, descriptive, and quantitative characterization of social insecurity in a rural, underserved, and racially diverse county. Our results demonstrate higher levels of social insecurity among Native Americans/Alaska Natives and Blacks compared to White counterparts. This finding is consistent with numerous prior works that highlight the link between racial inequality and health outcomes in the US.25-28
Structural racism has been linked to poorer mental health, general health, and physical health through numerous pathways.26 Structural racism includes societal policies and
Western Journal of Emergency Medicine 542 Volume 24, NO.3: May 2023 Characterizing Social Insecurity in a Rural North Carolina ED Gignac et al.
Subdomain N* Minimum Maximum Mean# SD CV Communication 312 0 3 0.99 0.69 0.70 Transportation 312 0 4 0.73 1.01 1.38 Housing insecurity 312 0 3 0.22 0.53 2.41 Food insecurity 312 0 3 0.66 0.98 1.48 Exposure to violence 310 0 5 1.14 1.31 1.15 Overall** 312 0 14 3.74 3.12
systems that reinforce unequal access to housing, education, employment, credit, and healthcare. In turn, this can lead to poorer health outcomes, perpetuated discrimination, and unequal allocation of resources.25 Furthermore, racism contributes to poorer health outcomes by inflicting adverse cognitive and emotional stress, inducing allostatic and physiological stress, and potential physical injury from racially motivated assaults and violence.25, 26 Gleaning from our study, we found that Robeson County represents a microcosm of this national trend whereby structural and systemic racism may underpin the health-outcome discrepancies observed.25-28
Our results show that there was a significant level of social insecurity (although difficult to exactly benchmark or realistically quantify) among the study population. Of the five sub-domains of social insecurity delineated, three emerged as the most notable. Food insecurity was the topmost factor identified, followed by transportation availability, and exposure to violence.
Prior research suggests that rural residents of the western and southern US experience more food insecurity than their counterparts in other regions.29-31 Likewise, historically marginalized and minoritized populations incur higher rates of food insecurity than other groups.29-31 The rates of food insecurity in Robeson County were nearly twice the state average and more than double the national average.29 Although most respondents (88.1%) affirmed that they have access to healthy foods, a high proportion of them (27%) reported running out of food due to lack of money or reducing/skipping meals due to budget constraints. Interestingly, reported food insecurity was associated with higher rates of crime (ever having been robbed, threatened with a gun, or shot) than those without reported food insecurity.32
Transportation availability or access emerged as the second topmost source of social insecurity in this population. Subjects were surveyed on this topic to explore their ability to obtain outpatient specialty care when not available in Robeson County. As a rural, medically underserved county, many medical specialties are not available within Robeson County. It is not uncommon for ED patients to require outpatient followup with a specialist located at a distant urban area. Despite a high proportion (87.8%) reporting that they had reliable transportation within the county, over 30% did not have a valid driver’s license. Furthermore, 22.5% reported not having had reliable transportation to appointments, up to three hours away, outside the county. These findings highlight transportation barriers to obtaining healthcare within the population.
The third topmost factor contributing to social insecurity in the study population was exposure to violence. Our results suggest that many respondents had been victims of burglary and larceny: 28.5% reported a prior home robbery. In fact, the crime rate in Robeson County is consistently one of the highest in the country.24,23 Compared to urban Wake County, rates of violent crimes in Robeson County are nearly four
times higher. Violent crime rates in Robeson County during the study dates were nearly triple the national rate.33-34
More than one in four respondents (26.9%) affirmed that they had been threatened with a gun, and about 10% reported personally sustaining a gunshot wound. Almost one third (31%) of respondents reported having a family member who had sustained a gunshot wound, and 17.4% reported having a family member die of a gunshot wound. Our results were consistent with prior works that have suggested a higher prevalence of gun violence among poor and minoritized populations than others. The implications of gun violence could be far-reaching. The sequelae of gun violence impact healthcare costs, disability, and mental health for victims and survivors.18-24,32-34
Housing insecurity and communication were found to be the least favorable factors, respectively, in the quantitative ranking of the five social insecurity domains examined in this study population. They did not yield basic, desirable, psychometric properties as sub-domains in the overall measure of the social insecurity construct. Nevertheless, they cannot be dismissed as unimportant factors in the SDOH framework. Further research may be warranted in quantifying their relative importance in a more coherent and comprehensive manner for development and measurement of the construct of social insecurity beyond that done in this study.
Although homelessness did not emerge as a top factor, many respondents in Robeson County had been affected by homelessness—an integral factor undergirding housing insecurity.35-38 With our finding of an affirmative response rate of 11.9%, it was suggestive that housing insecurity is more prevalent in Robeson County than other regions of NC. According to 2018 Continuum of Care data, the state of NC had approximately 8,962 homeless on any given day, representing a rate of 0.08% of a total state population of 10,383,620.37-40 Nationally, homelessness rates are reported to be 0.17%. It should be noted that our survey questions asked about homelessness over the prior year rather than currently.
Interestingly, our results suggest that homelessness is a possible risk factor for exposure to crime and gun violence. We observed that homeless respondents reported higher rates of home robbery and gun violence than those who did not report homelessness in the prior year. Of the homeless respondents, 48.6% affirmed that they had ever been robbed, 59.5% ever threatened with a gun, and 21.6% reported having ever been shot with a gun. These numbers were significantly higher on average than those reported in the general population. In fact, these rates were substantially higher than nationally reported rates of violence against homeless persons. The National Coalition for the Homeless reported that in 2016, for example, a total of 122 incidents of violent crime occurred among 578,424 homeless persons—a nationally reported, violent-crimes prevalence rate of 0.02%.41 This rate was in stark contrast to the 21.6% of homeless ED respondents in our study who reported having
Volume 24, NO.3: May 2023 543 Western Journal of Emergency Medicine Gignac et al. Characterizing Social Insecurity in a Rural North Carolina ED
sustained a gunshot wound and 59.5% who had ever been threatened by a gun.
Surprisingly, the data suggests that communication by telephone, possessing a government-issued identification card, and having active utilities (water and electricity) in the home were not major challenges faced by the study population. In fact, 85.9% of respondents reported having a personal cell phone. A plausible explanation for the counterintuitive result could be that many respondents likely qualified for low-cost cell phone service such as Lifeline Support for Affordable Communities under a Federal Communications Commission assistance program. This program, at the study time, was available in all 50 states for people whose income level is at or below 135% of the federal poverty guidelines, and for those who qualified for other federal programs such as Medicaid, Supplemental Nutrition Assistance Program, or free public housing assistance.42-44
Despite high rates of personal cell phone ownership, 21.8% reported times when they did not have access to a phone if needed to make a phone call for health purposes. Notably, a high percentage of participants reported having a government-issued identification card (94.2%), which is required by many healthcare and social institutions. Furthermore, most respondents affirmed that they currently had running water and electricity in their home (98.7%). These results suggest that, although many residents of Robeson County live in poverty, most do not report deficiencies in access to phones and/or utilities.
LIMITATIONS
Several limitations to this study should be noted. As a consented and convenience sampling survey, respondents may have been different from those who did not consent to participate. Consequently, a self-selection bias leading to more socially desirable responses was possible. Moreover, critically ill patients or those who presented with acute complaints were excluded. There was no way to force or coerce non-participants for any information, even their basic demographic information. Hence, we could only state this lack of comparison between participants and non-participants as a study limitation serving as a caution for the interpretation of the results.
Furthermore, participants were not screened for literacy. It is possible that a small number of illiterate participants did not seek verbal assistance from the RAs and provided unreliable responses. Moreover, the instrument used in this study did not demonstrate foolproof, desirable psychometric properties, and no general population sub-domain means existed for context of comparisons and benchmarking. Hence, it was difficult to benchmark a meaningful measure of “insecurity” exactly and realistically with established cut-off points. Additionally, nonEnglish speaking patients were excluded from participation. According to US census data, 7.9% of households in Robeson County speak a language other than English in the home.22 It is plausible that non-English speaking status could be a factor
associated with social insecurity, and this could be an area of future research.
While participants were not surveyed on income level or insurance status, race/ethnicity is a known factor associated with income levels and health insurance status/rates in the US.40-41 Prior works have noted large and pervasive differences over time in income by race/ethnicity, with Whites accruing higher incomes than Blacks, Hispanics, and Native Americans.40 Additionally, Whites have lower rates of uninsured persons compared to other racial/ethnic groups. The rates of uninsured non-Hispanic Blacks are nearly double the rate of uninsured Whites, and the rate of uninsured Hispanics is nearly four times higher than that of Whites.41,43 Demographic data from the study population, and Robeson County in general, suggests that poverty and lack of health insurance likely contribute to social insecurity in the study population. Finally, although the survey used in this study was similar to one used in a published study, neither was validated. In addition, the cross-sectional nature of the study regarding the data collected over a short period may have missed temporal variations that contribute to social insecurity.
Notwithstanding these limitations, this study could serve as a first step to rekindle the conversation about social insecurity among not only ED patients, but in patients throughout the healthcare system. Furthermore, it could provide the foundational framework for the development, construction, and quantification of a more valid measure of social insecurity in the US for rural, underserved populations that are similar to the current study population.
CONCLUSION
This study highlights the social challenges facing ED patients in a rural North Carolina teaching hospital. Food insecurity, transportation difficulties, and exposure to violence stood as the top three of five factors of social insecurity studied. Historically marginalized and minoritized groups, including Native Americans and Blacks, demonstrated overall higher rates of social insecurity and higher indexes on exposure to violence than their White counterparts. Housing security and communication yielded perverse results that warrant further study.
Our findings suggest that multifaceted interventions targeted at violence reduction, easing transportation difficulties, and assuring food security are needed to improve the overall social well-being and health outcomes of Robeson County’s diverse, rural, and medically underserved population. Deliberate and targeted national policies addressing structural racism holistically would be necessary to improve socioeconomic outcomes, overall health, and well-being of individuals and communities, especially the historically marginalized. Finally, a more valid and robust measure of a comprehensively developed construct of social insecurity is warranted.
Western Journal of Emergency Medicine 544 Volume 24, NO.3: May 2023
et al.
Characterizing Social Insecurity in a Rural North Carolina ED Gignac
ACKNOWLEDGMENTS
The authors would like to thank the Campbell University School of Osteopathic Medicine and the UNC-Southeastern Graduate Medical Education Department, for their support and encouragement.
Address for Correspondence: Elizabeth Gignac, DO, Campbell University School of Osteopathic Medicine, 4350 U.S. Hwy 421 S. Lillington, NC 27546. Email: egignac@campbell.edu.
Conflicts of Interest: By the WestJEM article submission agreement, all authors are required to disclose all affiliations, funding sources and financial or management relationships that could be perceived as potential sources of bias. No author has professional or financial relationships with any companies that are relevant to this study. There are no conflicts of interest or sources of funding to declare.
Copyright: © 2023 Gignac et al. This is an open access article distributed in accordance with the terms of the Creative Commons Attribution (CC BY 4.0) License. See: http://creativecommons.org/ licenses/by/4.0/
10. Vornanen R, Törrönen M, Miettinen J, et al. The conceptualising of insecurity from the perspective of young people. social sciences and cultural studies - issues of language, public opinion, education and welfare. INTECHopen 2012:Rijeka, Croatia.
11. Braveman P, Gottlieb L. The social determinants of health: It’s time to consider the causes of the causes. Public Health Rep. 2014;129(Suppl 2):19-31.
12. Kelly MP, Bonnefoy J, Morgan A, et al. The development of the evidence base about the social determinants of health. 2006. Available at: https://citeseerx.ist.psu.edu/document?repid=rep1&type =pdf&doi=3eb19079b7d9afba82462ff30c026bd0c4720626. Accessed February 15, 2018.
13. Link BG, Phelan J. Social conditions as fundamental causes of disease. J Health Soc Behav. 1995;Spec No:80-94.
14. Alderwick H, Gottlieb LM. Meaning and misunderstandings: a social determinants of health lexicon for healthcare systems. 2019. Available at: https://www.milbank.org/quarterly/articles/meaningsand-misunderstandings-a-social-determinants-of-health-lexicon-forhealth-care-systems/. Accessed June 20, 2020.
15. Gottlieb L, Fichtenberg C, Alderwick H, et al. Social determinants of health: What’s a healthcare system to do? J Healthc Manag 2019;64(4):243-57.
REFERENCES
1. Shen YC, Hsia RY. Changes in emergency department access between 2001 and 2005 among general and vulnerable populations. Am J Public Health. 2010;100(8):1462-9.
2. Rust G, Ye J, Baltrus P, et al. Practical barriers to timely primary care access: impact on adult use of emergency department services. Arch Intern Med. 2008;168(15):1705-10.
3. Fishman J, McLafferty S, Galanter W. Does spatial access to primary care affect emergency department utilization for nonemergent conditions? Health Serv Res. 2018;53(1):489-508.
4. Singh GK, Daus GP, Allender M, et al. Social determinants of health in the United States: addressing major health inequality trends for the nation, 1935-2016. Int J MCH AIDS. 2017;6(2):139–64.
5. Bell J, Turbow S, George M, et al. Factors associated with high utilization in a safety net setting. BMC Health Serv Res. 2017;17(1):273.
6. Gignac E, Dogbey G, Capece G, et al. Controlled substance use among psychiatric patients in a rural North Carolina emergency department. West J Emerg Med. 2019;20(2):419-25.
7. Cournane S, Conway R, Byrne D, et al. Social factors determine the emergency medical admission workload. J Clin Med. 2017; 6(6):59.
8. Doran KM, Kunzler NM, Mijanovich T, et al. Homelessness and other social determinants of health among emergency department patients. J Soc Distress Homeless. 2016;25(2):71-7.
9. Billoux A, Verlander K, Anthony S, et al. Standardized screening for health-related social needs in clinical settings: the accountable health communities screening tool. 2017. Available at: https://nam. edu/wp-content/uploads/2017/05/Standardized-Screening-forHealth-Related-Social-Needs-in-Clinical-Settings.pdf. Accessed February 15, 2018.
16. Feldman BJ, Calogero CG, Elsayed KS, et al. Prevalence of homelessness in the emergency department setting. West J Emerg Med. 2017;18(3):366-72.
17. Jackson TS, Moran TP, Lin J, et al. Homelessness among patients in a Southeastern safety net emergency department. South Med J. 2019;112(9):476-82.
18. Francis M. A Narrative inquiry into the experience of being a victim of gun violence. J Trauma Nurs. 2018;25(6):381-8.
19. Coben JH, Dearwater SR, Garrison HG, et al. Evaluation of the emergency department logbook for population-based surveillance of firearm-related injury. Ann Emerg Med. 1996; 28(2):188-93.
20. Kalesan B, Galea S. Patterns of gun deaths across US counties 1999-2013. Ann Epidemiol. 2017;27(5):302-7.
21. County Health Rankings & Roadmaps, University of Wisconsin, “Robeson, NC”. Available at: https://www.countyhealthrankings. org/explore-health-rankings/north-carolina/robeson?year=2015. Accessed February 3, 2023.
22. NC State Center for Health Statistics. County Health Data Book. 2022. Available at: http://www.schs.state.nc.us/data/databook. Accessed November 21, 2017.
23. U.S. Census Bureau Quick Facts. National Statistics. Available at: https://www.census.gov/quickfacts/US. Accessed November 21, 2017.
24. United States Census Bureau, Robeson County, North Carolina. Available at: https://www.census.gov/quickfacts/fact/table/ robesoncountynorthcarolina/PST045216. Accessed November 21, 2017.
25. Bailey ZD, Krieger N, Agénor M, et al. Structural racism and health inequities in the USA: evidence and interventions. Lancet. 2017;389(10077):1453–63
26. Paradies Y, Ben J, Denson N, et al. Racism as a determinant of health: a systematic review and meta-analysis. PLoS One
Volume 24, NO.3: May 2023 545 Western Journal of Emergency Medicine Gignac et al. Characterizing Social Insecurity in a Rural North Carolina ED
Characterizing Social Insecurity in a Rural North Carolina ED Gignac
2015;10(9):e0138511.
27. Cogburn CD. Culture, race, and health: implications for racial inequities and population health. Milbank Q. 2019;97(3):736-61.
28. Williams DR, Lawrence JA, Davis BA. Racism and health: evidence and needed research. Annu Rev Public Health. 2019;40:105-25.
29. US Department of Agriculture. Food Security and Nutrition Assistance. Available at: https://www.ers.usda.gov/data-products/ ag-and-food-statistics-charting-the-essentials/food-security-andnutrition-assistance/#:~:text=The%20prevalence%20of%20food%20 insecurity,had%20very%20low%20food%20security. Accessed February 15, 2018.
30. Ramadurai V, Sharf BF, Sharkey JR. Rural food insecurity in the United States as an overlooked site of struggle in health communication. Health Commun. 2012;27(8):794–805.
31. Caughron JR. An examination of food insecurity and its impact on violent crime in American communities. 2016. Available at: https://tigerprints.clemson.edu/cgi/viewcontent. cgi?article=3571&context=all_theseshttps://tigerprints.clemson.edu/ cgi/viewcontent.cgi?article=3571&context=all_theses. Accessed November 21, 2017.
32. Blankenberger E. Feeding peace: an investigation of the relationship between food insecurity and violence. 2016. Available at: https:// ir.library.illinoisstate.edu/scced/20. Accessed November 21, 2017.
33. North Carolina State Bureau of Investigation. Crime in North Carolina - 2017: Annual Summary Report of 2017 Uniform Crime Reporting Data. 2017. Available at: http://crimereporting.ncsbi.gov/Reports. aspx. Accessed August 21, 2019.
34. Crime in the United States. United State Federal Bureau of Investigation. 2019. Available at: https://ucr.fbi.gov/crime-in-theu.s/2019/crime-in-the-u.s.-2019/topic-pages/tables/table-1. Accessed June 20, 2020.
35. Sayre W. After Matthew and Florence, a mobile park ownership company is hiking rents and issuing evictions. 2019. Available at: https://www.wunc.org/post/after-matthew-and-florence-mobile-park-
ownership-company-hiking-rents-and-issuing-evictions. Accessed June 20, 2020.
36. Shiles B. Work continues on public housing. The Robesonian 2017. Available at: https://www.robesonian.com/news/96800/workcontinues-on-public-housing. Accessed June 20, 2020.
37. HUD Exchange. 2018 Continuum of Care (CoC) Homeless Populations and Subpopulations Report. 2018. Available at: https:// files.hudexchange.info/reports/published/CoC_PopSub_State_ NC_2018.pdf. Accessed June 20, 2020.
38. Census Reporter. Robeson County, NC. Available at: https:// censusreporter.org/profiles/05000US37155-robeson-county-nc/. Accessed June 20, 2020.
39. AccessNC: County profile: Robeson County (NC). Available at: https://accessnc.nccommerce.com/DemoGraphicsReports/pdfs/ countyProfile/NC/37155.pdf. Accessed June 20, 2020.
40. DataUSA. Profile of Robeson County. Available at: https://datausa. io/profile/geo/robeson-county-nc/?compare=united-states#health. Accessed June 20, 2020.
41. National Coalition for the Homeless. Vulnerable to hate: a survey of bias-motivated violence against people experiencing homelessness in 2016-2017. Available at: https://nationalhomeless.org/wp-content/ uploads/2018/12/hate-crimes-2016-17-final_for-web.pdf. Accessed August 3, 2018.
42. Federal Communications Commission. Lifeline Program for LowIncome Consumers. Available at: https://www.fcc.gov/consumers/ guides/lifeline-support-affordable-communications. Accessed August 21, 2019.
43. Akee R, Jones MR, Porter SR. Race matters: income shares, income inequality, and income mobility for all U.S. races. Demography 2019;56(3):999-1021.
44. Cohen RA, Martinez ME, Zammitti EP. Health insurance coverage: early release of estimates from the National Health Interview Survey, January-March 2016. 2016. Available at: https://www.cdc.gov/nchs/ data/nhis/earlyrelease/insur201609.pdf. Accessed November 21, 2017.
Western Journal of Emergency Medicine 546 Volume 24, NO.3: May 2023
al.
et
Gaps in the Identification of Child Race and Ethnicity in a Pediatric Emergency Department
Colleen K. Gutman, MD* ,†
K. Casey Lion, MD, MPH‡,§
Lauren Waidner, BS*
LaShaun Bryan, BS*
Anna Sizemore, BS*
Carolyn Holland, MD, Med* ,†
Cindy Montero, MPH*
Rosemarie Fernandez, MD* ,||
Section Editor: Mandy J. Hill, DrPH, MPH
University of Florida, Department of Emergency Medicine, Gainesville, Florida
University of Florida, Department of Pediatrics, Gainesville, Florida
University of Washington, Department of Pediatrics, Seattle, Washington
Center for Child Health, Behavior, and Development, Seattle Children’s Research Institute, Seattle, Washington
University of Florida College of Medicine, Center for Experiential Learning and Simulation, Gainesville, Florida
Submission history: Submitted October 10, 2022; Revision received January 10, 2023; Accepted February 17, 2023
Electronically published May 3, 2023
Full text available through open access at http://escholarship.org/uc/uciem_westjem
DOI: 10.5811/westjem.59145
Introduction: Race and ethnicity are social constructs that are associated with meaningful health inequities. To address health disparities, it is essential to have valid, reliable race and ethnicity data. We compared child race and ethnicity as identified by the parent with that reported in the electronic health record (EHR).
Methods: A convenience sample of parents of pediatric emergency department (PED) patients completed a tablet-based questionnaire (February-May 2021). Parents identified their child’s race and ethnicity from options within a single category. We used chi-square to compare concordance between child race and ethnicity reported by the parent with that recorded in the EHR.
Results: Of 219 approached parents, 206 (94%) completed questionnaires. Race and/or ethnicity were misidentified in the EHR for 56 children (27%). M isidentifications were most common among children whose parents identified them as multiraci al (100% vs 15% of children identified as a single race, P < 0.001) or Hispanic (84% vs 17% of non-Hispanic children, P < 0.001), and children whose race and/or ethnicity differed from t hat of their parent (79% vs 18% of children with the same race and ethnicity as their parent, P < 0.001).
Conclusion: In this PED, misidentification of race and ethnicity was common . This study provides the basis for a multifaceted quality improvement effort at our institution. The quality of child race and ethnicity data in the emergency setting warrants further consideration across health equity efforts. [West J Emerg Med. 2023;24(3)547–551.]
INTRODUCTION
Race and ethnicity are social constructs that are associated with meaningful health inequities. To identify and address health disparities, it is necessary to have accurate race and ethnicity data. In 2009, the Institute of Medicine released Race, Ethnicity, and Language Data: Standardization for Healthcare Quality Improvement, with recommendations and
best practices for race and ethnicity data collection.1 However, inaccuracies in race and ethnicity data persist in hospital and administrative databases of adult patients.2–4
The causes of inaccuracies in race and ethnicity data are multifactorial. Although self-identified race and ethnicity are considered the gold standard by the Institute of Medicine, patients are not always given the ability to provide self-identified
Volume 24, NO.3: May 2023 547 Western Journal of Emergency Medicine Brief Research Report
* † ‡ § ||
Gaps in the Identifying Child Race and Ethnicity
demographics.1,5–7 This may be more likely in the emergency department (ED), where hospital registration staff must find time to collect patient information and sign consents to care without interrupting urgent and fragmented clinical care. Race and ethnicity that are determined based on staff observation may be particularly inaccurate for children, who may not have the same race and/or ethnicity as their caregiver.8,9
Inaccuracies can be further compounded by limitations in available race and ethnicity categories.1,9,10 Healthcare systems often restrict race and ethnicity data collection to the minimum standard categories required for federal reporting and rarely give the option to select “other” or to select multiple races or “multiracial.”11 Additionally, although the Institute of Medicine supports the option of presenting race and ethnicity within a single question, healthcare systems often separate these into distinct categories as used in federal reporting.1 This format can lead to misidentification of Hispanic individuals who do not otherwise identify with the options listed in a distinct race category.1,12 As part of a quality initiative to improve and standardize accurate demographic data collection, we sought to assess the accuracy of child race and ethnicity data in an academic pediatric emergency department (PED), and to identify risk factors for misidentification.
METHODS
We conducted a cross-sectional analysis comparing child race and ethnicity reported by the parent to that documented in the electronic health record (EHR). This study took place in a single, academic PED with an affiliated onsite children’s hospital. The PED has an annual volume of approximately 26,000 patients. In the EHR (Epic Systems Corporation; Verona, WI), race and ethnicity data are documented separately using the minimum US Office of Management and Budget categories.7 Both fields are required. In each field multiple options can be selected, including an option for “other.” If not already documented from a prior visit within the hospital system, PED registration staff obtain patient race and ethnicity from patient or parent self-report or through staff observation.
Between February–May 2021, three trained research assistants (RA) approached a convenience sample of parents or caregivers (“parents”). Parents of critically ill children were excluded. The RAs were in the PED during afternoons and evenings. Sample size was determined by RA availability during the study period. Parents were approached at any time during the PED visit. The RAs explained the purpose of the study and asked parents to complete a brief, tablet-based questionnaire while the RA remained in the room. Parents who used a language other than English completed the questionnaire verbally with video interpretation. The parent was asked to identify the child’s race and ethnicity from a single question (“What is your child’s race and ethnicity? You can choose as many answers as you want to: American Indian/
Alaska Native; Asian; Black/African American; Hispanic/ Latino; Native Hawaiian/other Pacific Islander; White; other (free-text optional); I don’t want to say; I don’t know”).1 We chose to use a single question with race and ethnicity presented together, an option suggested by the Institute of Medicine, so that parents were not compelled to make selections within a category with which they or their child did not identify.1,8 Parents were also asked to identify their own race and ethnicity in a similar, single-question format.1 Child race and ethnicity were abstracted from the EHR. This study was approved by the University of Florida Quality Improvement Project Registry and determined not to require institutional review board review.
Our primary outcome was EHR misidentification of child race and ethnicity. Child race and ethnicity was considered “misidentified” if the EHR record did not match the parent report. Misidentifications in the EHR included situations in which the parent selected multiple options but not all of those were selected in the EHR, or vice versa. This also included situations in which the parent selected “other” but “other” was not reported in the EHR, or vice versa. Finally, race and ethnicity data are often missing from EHRs, leading to the exclusion of those individuals from equity-focused analyses and research.3 Thus, if EHR race and/or ethnicity was missing but the parent provided a response in the questionnaire, this was considered a misidentification. To assess this approach, we conducted sensitivity analyses in which we excluded those patients with missing race and/or ethnicity. We performed statistical analyses in R (R Core Team, 2021, R Foundation for Statistical Computing, Vienna, Austria). We performed chisquare and bivariate regression analyses to evaluate misidentification by child race and/or ethnicity and age, respectively. We assessed statistical significance at the P = 0.05 level.
RESULTS
Of 219 approached parents, 206 completed a questionnaire (94%). Most parents identified their child as non-Hispanic White (51%) or non-Hispanic Black (26%) (Table 1). Thirty-one parents (15%) identified their child as Hispanic, half of whom did not identify a separate race for their child. Seventeen parents (8.3%) identified their child as multiracial.
Fifty-six children (27%) had misidentified race and/or ethnicity in the EHR. Most misidentifications (89%) were misidentification of race. This includes all 17 multiracial children, most of whom were inaccurately reported as having a single race. Of the 16 Hispanic children who did not have separate race identified by the parent, 70% were misidentified as “other race,” and 30% were misidentified as “White” in the EHR. Six children had misidentified ethnicity, all of whom were identified as Hispanic by the parent and in the EHR as “not Hispanic or Latino.” A full list of misidentified EHR race and ethnicity data is found in Table 2.
Western Journal of Emergency Medicine 548 Volume 24, NO.3: May 2023
Gutman
Child race and ethnicity correct in EHR (n = 150)
(1 – 12)
Child race and/or ethnicity misidentified in EHR (n = 56)
1 Parent did not select “Hispanic” in the single combined race and ethnicity question.
2 Parent selected “Hispanic” in the single combined race and ethnicity question.
3 Child and parent race and ethnicity as reported by the parent. EHR, electronic health record; IQR, interquartile range.
Table 2. Details of ethnicity listed in the electronic health record (EHR) compared to parent report of child race and ethnicity for children with misidentifications in the EHR.
Child race and ethnicity identified by the parent EHR misidentification
Not Hispanic2
Asian “Other Race” (1)
Black/African American “White” (2), “Other race” (1), “Unknown” (1)
Native Hawaiian/other Pacific Islander Unknown (1) White “White + American Indian/Alaska Native” (AIAN) (1), “Asian” (1), “White + Asian + other” (1), “Other race” (1), “Declines to state” (4)
Other3 “White” (1)
Multiracial
AIAN + White “White” (2)
AIAN + Black + White “Black / African American” (1), “Black / African American + White” (1)
Black / African American + White “Black / African American” (3), “White” (3), “Other race” (1), “Unknown” (1), “Declines to state” (1)
Other4 + White “White” (2)
1 Number in parentheses indicates the number of children for each listed EHR race and ethnicity combination.
2 Ethnicity not specified, as all were correctly identified as “not Hispanic or Latino” in the EHR.
3 One parent wrote in “Black white mixed.”
4 One parent wrote in “Native American”; one parent wrote in “Indian.”
5 Ethnicity not specified as all were correctly identified as “Hispanic” in the EHR. EHR, electronic health record; IQR, interquartile range.
Volume 24, NO.3: May 2023 549 Western Journal of Emergency Medicine
Gaps
Gutman
in the Identifying Child Race and Ethnicity
Child
6
3
Child race and ethnicity
Not Hispanic1 American Indian / Alaska Native 0 0 Asian 0 1 (100) Black / African American 50 (92.6) 4 (7.4) Native Hawaiian / other Pacific Islander 0 1 (100) White 96 (92.3) 8 (7.7) Other 0 1 (100) Multiracial 0 15 (100) Hispanic2 No race selected3 0 16 (100) Black / African American 1 (20.0) 4 (80.0) White 3 (37.5) 5 (62.5) Multiracial 0 2 (100) Child and parent race and/or ethnicity
6 (20.7) 23 (79.3)
age in years, median (IQR)
(1 – 8)
as reported by parent, no. (%)
differ,3 no. (%)
Table 1. Patient characteristics stratified by accuracy of demographic data in electronic health records.
Table 2 Continued. Details of ethnicity listed in the electronic health record (EHR) compared to parent report of child race and ethnicity for children with misidentifications in the EHR.
Child race and ethnicity identified by the parent
Hispanic
EHR misidentification
No race selected5 “White” (4), “White + other race” (1), “Other race” (11)
Black/African American
“Not Hispanic or Latino + Black / African American” (1), “Hispanic + other race” (2)
White “Not Hispanic or Latino + White” (3), “Not Hispanic or Latino + other race” (1), “Hispanic + other race” (1)
Multiracial
Black/African American + White
“Not Hispanic or Latino + Black / African American + White” (1), “Hispanic + other race” (1)
1 Number in parentheses indicates the number of children for each listed EHR race and ethnicity combination.
2 Ethnicity not specified, as all were correctly identified as “not Hispanic or Latino” in the EHR.
3 One parent wrote in “Black white mixed.”
4 One parent wrote in “Native American”; one parent wrote in “Indian.”
5 Ethnicity not specified as all were correctly identified as “Hispanic” in the EHR. EHR, electronic health record; IQR, interquartile range.
Misidentifications were most common among children who were multiracial (100%, 95% confidence interval [CI] 77-100%] vs 15%, 95% CI 10-21%) of children identified as a single race, P < 0.001), children who were Hispanic (87%, 95% CI 69-96% vs 17%, 95% CI 12-23%) of nonHispanic children, P < 0.001), and children whose race and/ or ethnicity differed from that of their parent (79%, 95% CI 60-91% vs 18%, 95% CI 13-25%) of children with the same race and ethnicity as their parent, P < 0.001). There was no association between child age and misidentification (odds ratio 1.04, 95% CI 0.99-1.11). No parents selected “I don’t know” or “I don’t want to say” on the questionnaire, and nine children had missing race and/or ethnicity data in the EHR. The results were not changed when these subjects were excluded in sensitivity analyses.
DISCUSSION
Misidentification of child race and ethnicity was common in our PED, findings that remain similar to pediatric administrative-database analyses from the early 2000s. 8 Our findings demonstrate a clear need to develop strategies to enhance precise data collection within our EHR and to facilitate self-report of race and ethnicity. Importantly, such efforts to improve precision must be partnered with analyses that consider complex demographic subgroups. 6
Strategies applied in other healthcare systems have included the following: 1) staff training on self-report of race and ethnicity and education to increase patient awareness; 2) EHR systems that allow the selection of multiple races; 3) EHR alerts when race and/or ethnicity are missing; 4) use of granular race and ethnicity subcategories; and 5) a single-item question for race and ethnicity. 1,4,9,10 Our findings highlight the importance of
this multifaceted approach. All multiracial children in our sample were misidentified in the EHR. Our EHR allows for the selection of multiple races, yet in most of these cases multiracial children were misidentified in the EHR as having a single race. Additionally, by intentionally using a single item for race and ethnicity, we found that half of Hispanic parents did not select an additional race option for their child. Most of these children were categorized in the EHR as “other race,” an all-encompassing category that loses precision and is often excluded entirely from data analysis. 6
We assessed race and ethnicity as a single construct for two reasons. First, as we found in our sample, individuals who identify as Hispanic may not additionally identify with a distinct race category.12,13 Second, this approach was pragmatic. 13 Race and ethnicity are often presented as a single construct in health equity research, which requires researchers to collapse the two variable data that are found in administrative and hospital databases.14 Thus, our approach mirrors the practice of many health equity researchers. By offering choices that reflect the way data will be reported, we allow patients and parents greater selfdetermination in how precisely they will be identified.
LIMITATIONS
This study is subject to limitations. Questionnaires were completed by parents, which may not reflect child self-identification. Race and ethnicity categories used by the US Census Bureau are themselves limited and do not fully capture individual realities. We were unable to determine how EHR data was collected and could not determine which misidentifications occurred at the level of data entry (ie, if race and ethnicity were determined by
Western Journal of Emergency Medicine 550 Volume 24, NO.3: May 2023 Gaps in the Identifying Child Race and Ethnicity Gutman
Gutman Gaps in the Identifying Child Race and Ethnicity
staff observation). Demographics may have been collected during prior visits within the hospital system, so our findings are not sufficient to identify misidentifications that are uniquely due to the PED registration process. Finally, we approached a convenience sample, and responses may have been influenced by the timing and methods of questionnaire administration. As part of a quality improvement initiative, our findings are not intended to be generalizable.
CONCLUSION
Despite representing arbitrary social constructs, accurate race and ethnicity data are essential to identifying and addressing health inequities. Although we found that rigidity within race and ethnicity items in the EHR was an important factor in many misidentifications (ie, the requirement for both a race and ethnicity response), we also found that some features of the EHR were not used (ie, the ability to select multiple responses within a category). This work provides the basis for a multifaceted quality improvement effort at our institution. The quality of child race and ethnicity data in the emergency setting warrants further consideration across health equity efforts.
ACKNOWLEDGEMENTS
The authors would like to thank the University of Florida Department of Emergency Medicine Division of Research and the UF Health Shands Children’s Hospital patients and staff for their contributions and support.
REFERENCES
1. Agency for Healthcare Research and Quality. Race, Ethnicity, and Language Data: Standardization for Health Care Quality Improvement. Available at: http://www.ahrq.gov/research/findings/final-reports/iomracereport/index.html. Accessed July 23, 2020.
2. Lee SJC, Grobe JE, Tiro JA. Assessing race and ethnicity data quality across cancer registries and EMRs in two hospitals. J Am Med Inform Assoc. 2016;23(3):627-34.
3. Lee WC, Veeranki SP, Serag H, et al. Improving the collection of race, ethnicity, and language data to reduce healthcare disparities: a case study from an academic medical center. Perspect Health Inf Manag. 2016;13(Fall):1g.
4. Magaña López M, Bevans M, Wehrlen L, et al. Discrepancies in race and ethnicity documentation: a potential barrier in identifying racial and ethnic disparities. J Racial Ethn Health Disparities 2017;4(5):812-8.
5. Hasnain-Wynia R, Van Dyke K, Youdelman M, et al. Barriers to collecting patient race, ethnicity, and primary language data in physician practices: an exploratory study. J Natl Med Assoc. 2010;102(9):769-75.
6. Jorgensen S, Thorlby R, Weinick RM, et al. Responses of Massachusetts hospitals to a state mandate to collect race, ethnicity and language data from patients: a qualitative study. BMC Health Serv Res 2010;10:352.
7. Klinger EV, Carlini SV, Gonzalez I, et al. Accuracy of race, ethnicity, and language preference in an electronic health record. J Gen Intern Med 2015;30(6):719-23.
8. Weikel BW, Klawetter S, Bourque SL, et al. Defining an infant’s race and ethnicity: a systematic review. Pediatrics. 2022:e2022058756.
9. Chaiyachati BH, Peña MM, Montoya-Williams D. The complicated inadequacy of race and ethnicity data. JAMA Pediatr. 2022;176(7):631-2.
Address for Correspondence: Colleen Gutman, MD, University of Florida, Department of Emergency Medicine, 1329 SW 16th St, Gainesville, FL 32610. Email: ckays21@ufl.edu
Conflicts of Interest: By the WestJEM article submission agreement, all authors are required to disclose all affiliations, funding sources and financial or management relationships that could be perceived as potential sources of bias. This study was supported in part by NCATS KL2TR001429 (to CKG). The NIH and University of Florida Clinical and Translational Science Institute had no role in the design and conduct of the study. There are no conflicts of interest to declare.
Copyright: © 2023 Author. This is an open access article distributed in accordance with the terms of the Creative Commons Attribution (CC BY 4.0) License. See: http://creativecommons.org/ licenses/by/4.0/
10. Pellegrin KL, Miyamura JB, Ma C, et al. Improving accuracy and relevance of race/ethnicity data: results of a statewide collaboration in Hawaii. J Healthc Qual. 2016;38(5):314-21.
11. Cowden JD, Flores G, Chow T, et al. Variability in collection and use of race/ethnicity and language data in 93 pediatric hospitals. J Racial Ethn Health Disparities. 2020;7(5):928-36.
12. Flores G. language barriers and hospitalized children: Are we overlooking the most important risk factor for adverse events? JAMA Pediatr. 2020;174(12):e203238.
13. Mason LR, Nam Y, Kim Y. Validity of infant race/ethnicity from birth certificates in the context of U.S. demographic change. Health Serv Res. 2014;49(1):249-67.
14. Goyal MK, Johnson TJ, Chamberlain JM, et al. Racial and ethnic differences in antibiotic use for viral illness in emergency departments. Pediatrics. 2017;140(4).
Volume 24, NO.3: May 2023 551 Western Journal of Emergency Medicine
Nonfatal Injuries Sustained in Mass Shootings in the US, 20122019: Injury Diagnosis Matrix, Incident Context, and Public Health Considerations
Matthew P. Czaja, MPH*
Chadd K. Kraus, DO, DrPH†
Su Phyo, BS‡
Patrick Olivieri, MD§
Dalier R. Mederos, MD||
Ivan Puente, MD||
Salman Mohammed, BS#
Ross P. Berkeley, MD#
David Slattery, MD#
Thomas H. Gildea, MD¶**
Claire Hardman, BSN, RN††
Brandi Palmer, MS‡‡
Authors continued at end of article
Section Editor: Jacob Manteuffel, MD
Ponce Health Sciences University School of Medicine, Ponce, Puerto Rico
Geisinger Emergency Medicine, Danville, Pennsylvania
Touro University Nevada College of Osteopathic Medicine, Henderson, Nevada
Valley Health Emergency Medicine, Las Vegas, Nevada
Broward Health Medical Center, Division of Trauma and Critical Care Services, Fort Lauderdale, Florida
Kirk Kerkorian School of Medicine at UNLV, Department of Emergency Medicine, Las Vegas, Nevada
St. Louise Regional Hospital, Department of Emergency Medicine, Gilroy, California
Santa Clara Valley Medical Center, Department of Emergency Medicine, San Jose, California
Wright State University Boonshoft School of Medicine, Department of Surgery, Dayton, Ohio
Kettering Health Main Campus, Trauma Research Program, Kettering, Ohio
Submission history: Submitted September 9, 2022; Revision received December 27, 2022; Accepted January 25, 2023
Electronically published May 2, 2023
Full text available through open access at http://escholarship.org/uc/uciem_westjem
DOI: 10.5811/westjem.58395
Introduction: The epidemic of gun violence in the United States (US) is exacerbated by frequent mass shootings. In 2021, there were 698 mass shootings in the US, resulting in 705 deaths and 2,830 injuries. This is a companion paper to a publication in JAMA Network Open, in which the nonfatal outcomes of victims of mass shootings have been only partially described.
Methods: We gathered clinical and logistic information from 31 hospitals in the US about 403 survivors of 13 mass shootings, each event involving greater than 10 injuries, from 2012-19. Local champions in emergency medicine and trauma surgery provided clinical data from electronic health records within 24 hours of a mass shooting. We organized descriptive statistics of individual-level diagnoses recorded in medical records using International Classification of Diseases codes, according to the Barell Injury Diagnosis Matrix (BIDM), a standardized tool that classifies 12 types of injuries within 36 body regions.
Results: Of the 403 patients who were evaluated at a hospital, 364 sustained physical injuries—252 by gunshot wound (GSW) and 112 by non-ballistic trauma—and 39 were uninjured. Fifty patients had 75 psychiatric diagnoses. Nearly 10% of victims came to the hospital for symptoms triggered by, but not directly related to, the shooting, or for exacerbations of underlying conditions. There were 362 gunshot wounds recorded in the Barell Matrix (1.44 per patient). The Emergency Severity Index (ESI) distribution was skewed toward higher acuity than typical for an emergency department (ED), with 15.1% ESI 1 and 17.6% ESI 2 patients. Semi-automatic firearms were used in 100% of these civilian public mass shootings, with 50 total weapons for 13 shootings (Route 91 Harvest Festival, Las Vegas. 24). Assailant motivations were reported to be associated with hate crimes in 23.1%.
Conclusion: Survivors of mass shootings have substantial morbidity and characteristic injury distribution, but 37% of victims had no GSW. Law enforcement, emergency medical systems, and hospital and ED disaster planners can use this information for injury mitigation and public policy planning. The BIDM is useful to organize data regarding gun violence injuries. We call for additional research funding to prevent and mitigate interpersonal firearm injuries, and for the National Violent Death Reporting System to expand tracking of injuries, their sequelae, complications, and societal costs. [West J Emerg Med. 2023;24(X)XXX–XXX.]
Western Journal of Emergency Medicine 552 Volume 24, NO.3: May 2023 * † ‡ § || # ¶ ** †† ‡‡ Original Research
INTRODUCTION
Civilian public mass shootings (CPMS) are increasing in frequency and are the leading cause of potential years of lost life in the United States (US).1 Nonfatal interpersonal firearm injuries outnumber deaths two- to threefold.2 As greater than 75% of all firearm deaths occur prior to hospital arrival, reports that focus on mass shooting deaths provide an incomplete picture of the medical resources required to care for injured victims and provide inadequate information for effective hospital and emergency department (ED) disaster planning.2 While most research on firearm-related injuries, including reports on mass shootings, focus on deaths, less is known about injury patterns and outcomes among survivors, including those injured by non-ballistic means.
Mass shootings are a complex subset of the larger firearm violence epidemic in the US. Some are random, but others are associated with hate crime ideology or a response to bullying or social isolation.3 One factor common to CPMS is the use of automatic or semi-automatic firearms (SAF).3 “Assault rifles,” generally defined as selective-fire rifles that use intermediate power ammunition fed from a detachable magazine (often high capacity), cause greater mortality and morbidity in mass shootings than non-automatic weapons.4 The kinetic firepower and resulting damage of these SAFs is potentially orders of magnitude greater than that of a musket ball used in the late 18th century, at the time the Second Amendment was adopted, and is further compounded by the increased rate of fire of modern weapons.5,6
This is a companion manuscript to the JAMA Network Open paper entitled “Injury Characteristics, Outcomes, and Health Care Services Use Associated with Nonfatal Injuries Sustained in Mass Shootings in the US, 2012-2019.”7 Our report provides a greater level of detail on the injury epidemiology of the 13 mass shootings previously analyzed, by organizing all traumatic diagnoses according to the Barell Injury Diagnosis Matrix (BIDM).8 We also present atraumatic diagnoses and illnesses, including sequelae of trauma. Lastly, this report addresses mass shooting settings, firearm type and legality, and hate crime associations, with expanded discussion of the research processes and limitations.
METHODS
This retrospective case series of 403 patients reports 13 CPMSs with greater than 10 injuries per event from 201219. The study design and data abstraction methods have been reported previously.7 Briefly, we identified these CPMS incidents via public databases, The Violence Project (TVP),9 and Mother Jones, 10 and contacted local champions to report data from 31 hospitals that received injured victims to report data to a central hub. The study was deemed exempt from institutional review board (IRB) approval at the central site. Data were abstracted from primary medical records of victims presenting within 24 hours after the CPMS, and IRB approval was obtained at each spoke center.
Population Health Research Capsule
What do we already know about this issue?
The firearm violence epidemic in the US is exacerbated by increasingly frequent mass shooting, involving significant deaths and a greater number of non-fatal injuries.
What was the research question?
We describe the morbidity (gunshot wounds and other) among mass shooting survivors and discuss the types of firearms used and public health implications.
What was the major finding of the study?
In 13 mass shootings, 887 nonfatal injuries were associated with semi-automatic firearm use. There were 2.88 GSW injuries, and 1.56 nonGSW injuries per patient.
How does this improve population health?
Law enforcement, EMS, and hospital disaster committees may use these insights into mass shooting morbidity for injury mitigation and public policy planning
We used best-practice methods of retrospective chart review.11 We excluded deaths at the scene, in the emergency department (ED), and in the operating room during initial surgery. We included all patients from the CPMS, including those not injured by GSW, as well as uninjured patients presenting for medical complaints. To add context to the injured victims, we summarize the incident-level data retrieved from TVP database on type, number and legality of firearms used, hate crime components, and reported motive.9 We collected Emergency Severity Index (ESI) triage levels on 232 of 403 patient (57.6%). For the other 171 victims, we assigned an ESI based on diagnosis, injury type, and projected resources used as per the definition for each ESI level.12
We compiled patient-level data on ED and inpatient diagnoses from medical records according to the International Classification of Diseases, Ninth Revision, Clinical Modification (ICD-9-CM) and Tenth Revision (ICD-10CM) codes.13,14 We employed the BIDM, a standardized epidemiological tool that presents ICD-9-CM codes describing trauma in a two-dimensional array (matrix) of 36 body region rows and 12 nature-of-injury columns.8 To deal with the ICD10-CM codes in our sample, we used an online converter tool to translate these codes into their ICD-9-CM equivalents.15 For an additional layer of precision, we also referenced the Injury
Volume 24, NO.3: May 2023 553 Western Journal of Emergency Medicine Czaja et al. Nonfatal Injuries Sustained in Mass Shootings in the US, 2012-2019
Nonfatal Injuries Sustained in Mass Shootings in the US, 2012-2019 Czaja et
Mortality Diagnosis Matrix, which is a similar matrix using ICD-10-CM codes.16 We chose to model this study’s CPMS injury matrix on the BIDM given its widespread application on morbidity data, as opposed to mortality/cause-of-death data.17 We made several modifications to the BIDM to more appropriately present CPMS-specific traumatic diagnosis codes. In this study, the mass shooting injury matrix (MSIM) has an additional nature-of-injury column, “Gunshot Wound,” to describe penetrating open wounds caused explicitly by GSWs. Therefore, non-GSW penetrating open wounds, lacerations, and abrasions are described in the column “Laceration and Abrasion.” Such a distinction is not possible in the unmodified BIDM. The BIDM also features three types of traumatic brain injuries (TBI): “Type 1” describes intracranial, and “Type 2” and “Type 3” describe extracranial trauma, with the latter distinguishable only by loss-ofconsciousness status. The MSIM features only two types of TBI, “Intracranial” and “Extracranial.” Next, we removed “Trunk” and “Burns” because our dataset did not contain any of these codes (ie, unspecified thorax trauma). Finally, we also removed “System-wide and Late Effects (Row 36),” as we reported these diagnosis codes separately from the MSIM. For purposes of categorizing firearms used in CPMS in this report, we defined a SAF, whether pistol or rifle, as one that places the subsequent round in the chamber and then requires the user to depress the trigger again to fire the next round.18 Non-SAFs require additional actions by the user to fire the next round, other than pulling the trigger.18 The term “assault weapon” generally refers to a SAF with a detachable, large-capacity magazine and additional components that may include a pistol grip, a forward grip, and/or a flash suppressor.19 We relied on descriptions of the weapons used in mass shootings by TVP9 and did not independently verify the types of weapons used.
RESULTS
This study describes 13 CPMSs from 2012-2019 across nine US states (Table 1). Three of the mass shootings occurred at religious sites, three at bars/nightclubs, and two each at schools and concerts/festivals. All shootings featured SAFs: 9 of 13 (69.2%) involved at least one semi-automatic assault rifle (SAAR), and 4 of 13 (30.8%) only involved semi-automatic pistols (SAP). A total of 50 firearms (3.85 per CPMS) were used by the perpetrators. Excluding the Las Vegas CPMS, which featured 24 firearms, there were 26 firearms used in the other 12 incidents (2.17 per shooting). There were 30 SAARs, 13 SAPs, three shotguns, three other handguns, and one boltaction (non-automatic) rifle.
According to available public data, at least 32 of 50 (64%) firearms were obtained legally for six mass shootings. Only three firearms used in one CPMS were known to have been obtained illegally. Most legally obtained firearms were purchased from a federal licensed dealer, including all 24
firearms used in the Las Vegas CPMS. One legal firearm was bought in a private sale.
Figure 1 shows that the distribution of ESI categories in this study’s 403 mass shooting survivors from disaster situations was skewed to the right, representing substantially higher acuity when compared to a national US sample of 138 million patients in 2017 from the National Center of Health Statistics.20 Figure 2 shows the anatomic distribution of four trauma subtypes: GSW; fracture; neurologic; and vascular trauma, with colored-dot sizes proportional to frequency of injury at each anatomic location.
Mass Shooting Injury Diagnosis Matrix
There were 897 traumatic diagnoses recorded in the MSIM (Table 2) in total, equating to 2.48 per injured patient (364). Of these diagnoses, 725 (80%) were caused by GSWrelated trauma and 172 (20%) were from other blunt trauma (eg, fall, stampede, trampling). There were almost twice as many traumatic diagnoses per GSW patient than for nonGSW mass shooting victims, reflecting the complicated nature of these injuries. The 725 GSW-related diagnoses for 252 GSW patients equates to 2.88/patient vs 172 non-GSW diagnoses for 112 patients, or 1.56/patient. For GSW victims, the most common forms of trauma involved fractures (163) and internal organ injuries (113). For non-GSW victims, lacerations/abrasions (60), soft tissue contusions (55), and musculoskeletal strains (33) accounted for most injuries. For all patients, the most frequent anatomic regions of trauma involved the chest/thorax (113), followed by the abdomen (89), and shoulder/upper arm/axilla (89).
Internal Organs
The most common internal injuries from GSWs were 48 abdominal/retroperitoneal (including kidney), 41 thoracic, 13 intracranial, and 11 urogenital/pelvis. In addition, there were four myocardial infarctions, two injuries from blunt trauma, and two from pre-existing coronary artery disease. These injuries resulted in 64 diagnoses of organ failure and shock: 30 acute blood loss anemia; 11 hemorrhagic shock; 9 acute respiratory failure; and 14 other various organ failure diagnoses.
Musculoskeletal
There were 196 total musculoskeletal diagnoses. The most common were wrist/hand (30), ribs (23), lower leg and ankle (18), upper extremity (17), foot (14), face (12), and skull (8). There were three reported cases of compartment syndrome of the leg associated with GSW trauma.
Neurologic
There were 44 patients with 51 neurologic trauma diagnoses. Thirty-one of these patients (70.4%) had GSW, and 13 diagnoses were related to blunt head trauma (concussions). For GSW victims, there were 24 with peripheral nerve injuries
Western Journal of Emergency Medicine 554 Volume 24, NO.3: May 2023
al.
categories and descriptions are based on information from Mother Jones (MJ) and
bAll firearms used by the perpetrator(s) including those used to target victims and those found on scene even if not discharged. Information abstracted from TVP, MJ, and the public domain. Legal vs nonlegal ownership abstracted only from TVP.
about the perpetrator(s)’ prejudice and motive(s) were abstracted directly from TVP. Mass shootings listed as “Unavailable” were not recorded in the TVP. CPMS, civilian public mass shootings; SAAR, semi-automatic assault rifle; SAP, semi-automatic pistol. Table 1. Incident demographics of the 13 civilian public
Volume 24, NO.3: May 2023 555 Western Journal of Emergency Medicine Czaja et al. Nonfatal Injuries Sustained in Mass Shootings in the US, 2012-2019 Setting Firearms used b Hate crime association c CPMS Name Date Location Category a Description Quantity Description Legally purchased? Prejudice(s) Motive(s) Midland-Odessa 08/31/2019 Midland and Odessa, TX Other Interstate 20 1 One SAAR Yes, Private sale No No Dayton 08/04/2019 Dayton, OH Bar/ Nightclub Ned Peppers Bar 2 One SAAR (AR-15), one shotgun Yes (All), Federally licensed dealer Misogyny No Gilroy Garlic Festival 07/28/2019 Gilroy, CA Concert/ Festival Gilroy Garlic Festival 1 One SAAR (AK-47) Unavailable Unavailable Unavailable Pittsburgh Synagogue 10/27/2018 Pittsburgh, PA Religious locale Tree of Life –Or L’Simcha Congregation 5 Three SAPs (Glock .357), one SAAR (AR-15), one shotgun Unavailable Racism (Jewish), Religious Hatred, Misogyny Targeting racial/ethnic group, Anti- Semitism Jacksonville Landing 08/26/2018 Jacksonville, FL Bar/ Nightclub Good Luck Have Fun Game Bar, Videogame tournament 2 Two SAPs (.45-caliber & 9mm) Unavailable Unavailable Unavailable Marjory Stoneman Douglas High School 02/14/2018 Parkland, FL School Marjory Stoneman Douglas High School 1 One SAAR (M&P15) Yes, Federally licensed dealer Racism, Religious Hatred, Homophobia Unavailable Marshall County High School 01/18/2018 Benton, KY School Marshall County High School 1 One SAP (.22-caliber) Unavailable Unavailable Unavailable Sutherland Springs Church 11/05/2017 Sutherland Springs, TX Religious locale First Baptist Church 3 Two SAPs 22-caliber & 9mm), one SAAR (AR-556) No (All), Unlawful purchas No No Las Vegas 10/01/2017 Las Vegas, NV Concert/ Festival Route 91 Harvest Music Festival 24 22 SAARs (AR-
rifle, one revolver handgun Yes (All), Federally licensed dealer No No Burnette Chapel 09/24/2017 Antioch, TN Religious locale Burnette Chapel Church of Christ 2 Two SAPs (.40-caliber & 9mm) Unavailable Unavailable Unavailable Little Rock Nightclub 07/01/2017 Little Rock, AR Bar/ Nightclub Power Ultra Lounge nightclub 3 Two handguns, one SAAR (AK-47) Unavailable Unavailable Unavailable Fort Lauderdale Airport 01/06/2017 Fort Lauderdale, FL Other Fort Lauderdale- Hollywood International Airport 1 One SAP (9mm) Unavailable No No
public
lay press
15 & AK-47), one bolt-action
aSetting
The Violence Project (TVP),
databases, and
sources/public domain.
cInformation
mass shootings in the United States from 2012-19.
Nonfatal Injuries Sustained in Mass Shootings in the US, 2012-2019 Czaja
1 CPMS associated with antisemitic motive
3 CPMS associated with prejudice
Two SAPs (.40-caliber), one SAAR (M&P15), one 12-gauge shotgun
32 (64%) legal firearms
30 SAARs, 13 SAPs, 3 shotguns, 3 other handguns, 1 other rifle
aSetting categories and descriptions are based on information from Mother Jones (MJ) and The Violence Project (TVP), public databases, and lay press sources/public domain.
bAll firearms used by the perpetrator(s) including those used to target victims and those found on scene even if not discharged. Information abstracted from TVP, MJ, and the public domain. Legal vs nonlegal ownership abstracted only from TVP.
cInformation about the perpetrator(s)’ prejudice and motive(s) were abstracted directly from TVP. Mass shootings listed as “Unavailable” were not recorded in the TVP. CPMS, civilian public mass shootings; SAAR, semi-automatic assault rifle; SAP, semi-automatic pistol.
and six patients with 13 intracranial TBIs (eg, epidural, subdural, subarachnoid, brain parenchymal). One patient had a traumatic spinal cord injury (not recorded in MSIM). The most common peripheral nerve injuries involved the lower extremity (of eight peripheral nerve injuries, four were to sciatic nerves and four were other leg nerve injuries), and the upper arm/axilla and forearm/elbow/wrist (seven each).
Vascular
Vascular injuries were most commonly paired with peripheral nerve injuries (22 with nerve injuries and 12 isolated). There were 34 patients with 34 vascular injuries, comprised of 17 upper extremity, 12 lower extremity, two abdominal, and one neck (two unknown).
Complications/Sequelae
There were 88 diagnoses related to complications and sequelae of trauma: 43 involving foreign bodies; 11 gastrointestinal with ileus/constipation (opioid-induced and other); six with venous thromboembolism; two with ostomies; and two with wound dehiscence during the index hospitalization.
Infectious/Metabolic
There were 20 reported infectious diagnoses among 144 admitted patients (13.9% of all victims) and 37 diagnoses involving metabolic derangements, most frequently hypokalemia (11).
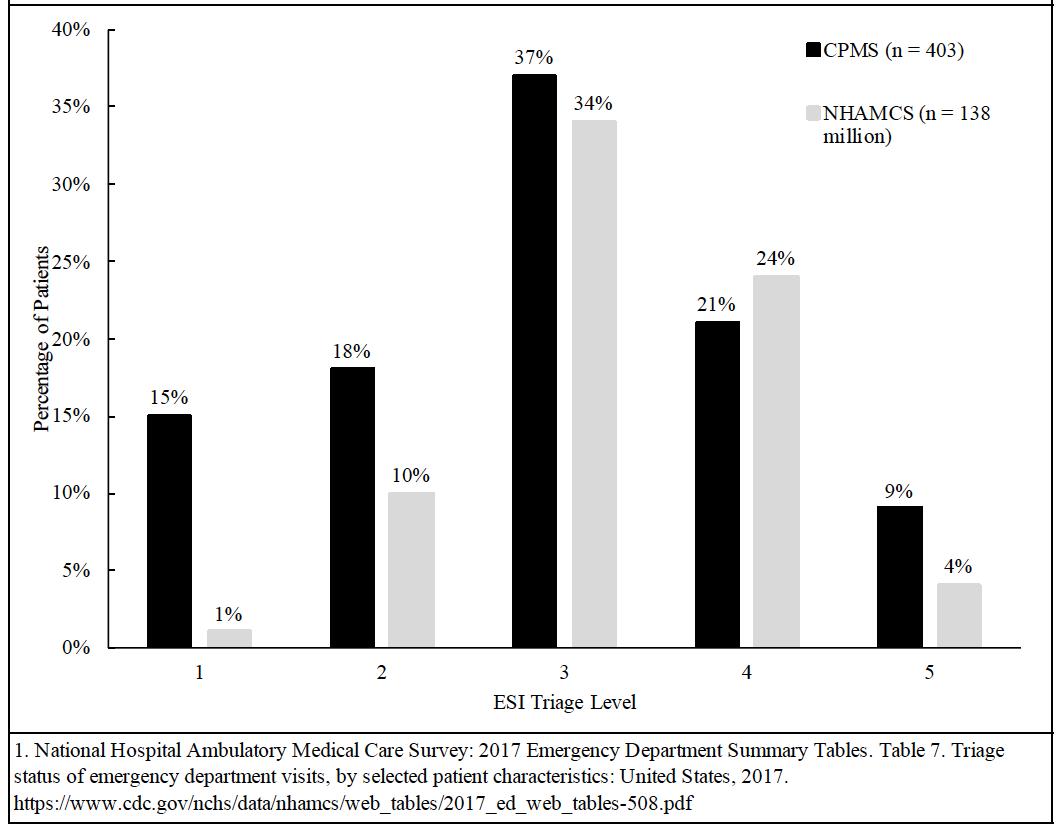
Atraumatic
Thirty-nine patients did not sustain any physical injury, and 21 of these cases (53.8%) involved psychiatric diagnoses. The others had a combination of acute concerns associated with the
Western Journal of Emergency Medicine 556 Volume 24, NO.3: May 2023
al. Setting Firearms used b Hate crime association c CPMS Name Date Location Category a Description Quantity Description Legally purchased? Prejudice(s) Motive(s) Aurora Theater 07/20/2012 Aurora, CO Other Century 16 movie theater, Midnight screening of Dark Night Rises
Yes
Federally licensed dealer No No 13 CPMS Incidents 2012-2019 9 US States 3 religious locales, 3 bars/ nightclubs, 3 other settings, 2 schools, 2 concerts/festivals
et
4
(All),
Table 1. Continued.
Figure 1. Distribution of Emergency Severity Index triage level at the primary receiving hospital for 403 survivors of 13 civilian public mass shootings in the United States (2012-19) compared to data from the 2017 National Hospital Ambulatory Medical Care Survey.
Colored circles are proportional to the number of coded injuries, with black denoting gunshot wounds (n=357), yellow, fracture (n=157), blue, neurologic (n=34), and red, vascular (n=30).
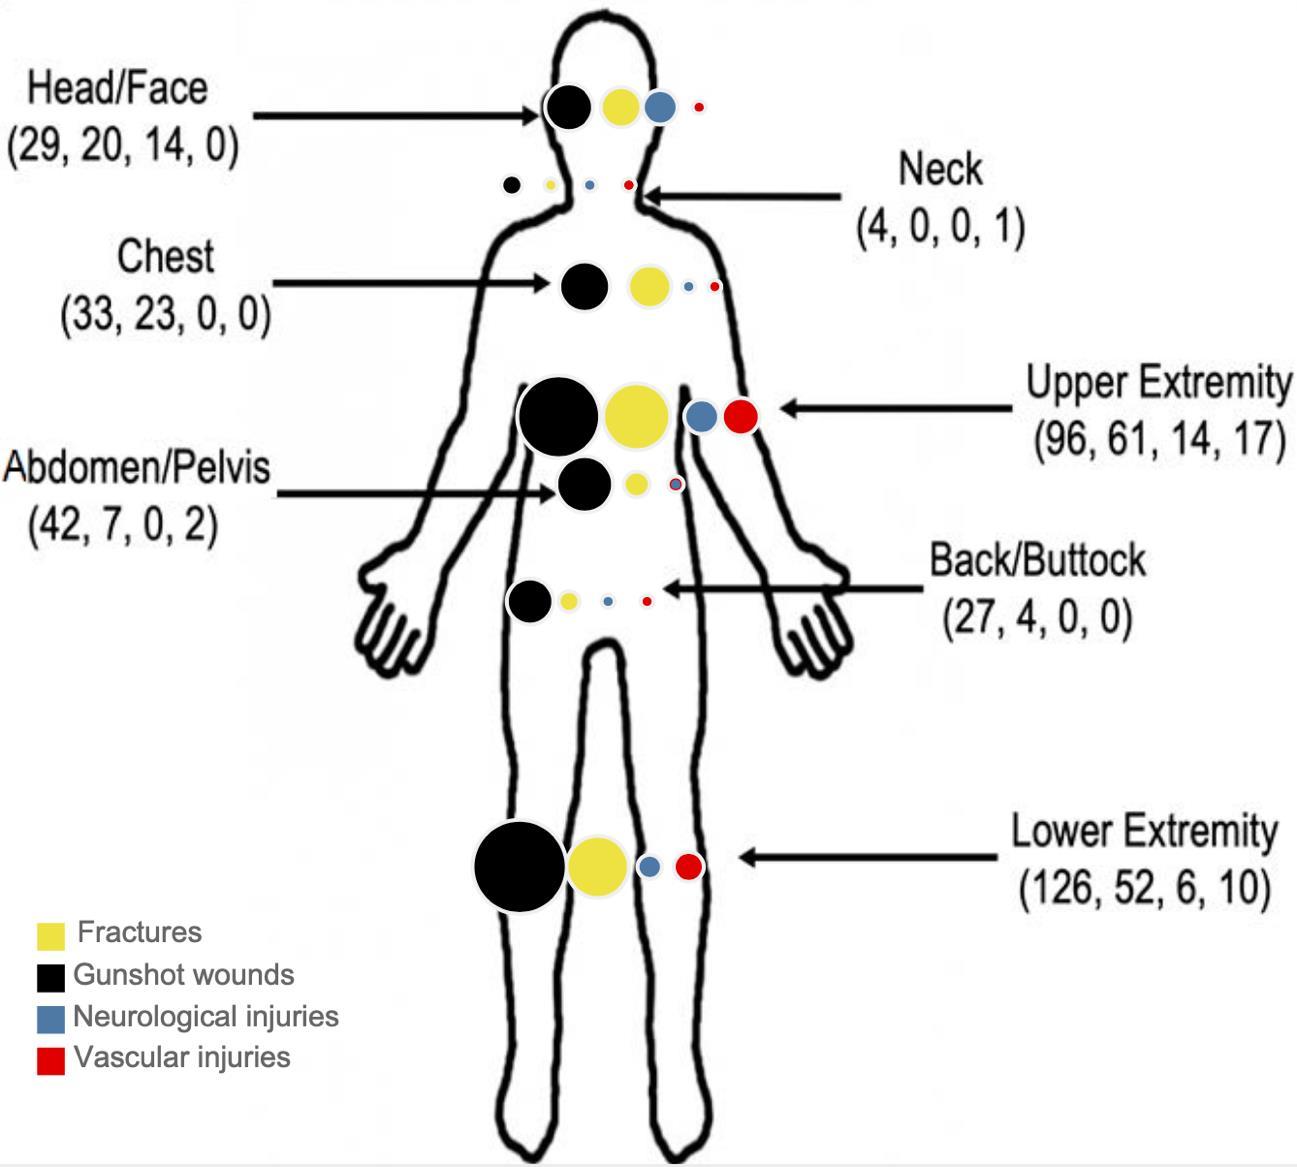
shooting (ie, syncope, hearing loss from gunfire), exacerbations of pre-existing chronic conditions, and occupational exposure to blood products (first responders). Some injured patients concurrently had non-traumatic diagnoses, especially admitted patients. Four patients had asthma exacerbations, four had hearing loss, three had cardiovascular disease (two atraumatic myocardial infarctions and one hypertensive emergency), and three had obstetric concerns.
Psychiatric
Overall, 50 patients had 75 psychiatric diagnoses (1.50 per patient); Twenty-nine of these 50 patients (58.0%) also had physical trauma, and 21 (42.0%) did not have a physical injury. Thirty-five (46.7%) of the psychiatric diagnoses were anxiety/panic/adjustment disorders. Fifteen patients (20%) were diagnosed with acute stress disorder (ASD), seven (9.3%) with major depressive disorder/depressive symptoms, and six (8.0%) with post-traumatic stress disorder (PTSD), indicating a hospital stay longer than 30 days according to the Diagnostic and Statistical Manual of Mental Disorders, Fifth Edition.21
DISCUSSION
This report focuses on injuries and related CPMS conditions, rather than deaths, to broaden and further describe the morbidity of victims, along with the societal and healthcare sequelae. This study is an additional analysis of a prior publication, in which we now report further detail on mass shooting settings, firearm type and legality, reported
hate crime association, non-GSW trauma and illnesses, and research processes and limitations.7
As per Table 1, mass shootings occur in a variety of settings, including concerts, schools, places of worship, social gathering sites like bars, military bases, hospitals, and workplaces.22 Over 90% occur within one mile of places frequented by children (eg, school, park).23 Figure 1 demonstrates that CPMSs survivors skew toward substantially higher acuity for triage severity and anticipated care resources compared with a national comprehensive sample of EDs in the US.20
Prehospital planning and mass casualty incident training simulations are key to preventing loss of life, especially given the shift toward higher acuity. There is ample evidence suggesting that prehospital training programs and tourniquet training for laypersons increase survival.25,26,27 Some public gathering places now have “STOP THE BLEED” kits, analogous to previous deployment of cardiac defibrillators. For example, in 2022 the city of Chicago deployed 550 STOP THE BLEED kits in 350 locations throughout the city.28
Brown and Goodin29 reported that 44% of fatalities and 62% of all CPMS victims were associated with SAAR use. In these 13 CPMSs, there were 157 deaths and 887 nonfatal injuries, all of which were associated with SAF use.7 Nine incidents involved SAAR use, corresponding to 147 of 157 (94%) deaths and 810 of 887 (91%) nonfatal injuries, although approximately one-third of these were non-GSW trauma. The ability to fire many bullets from a high-capacity magazine of a SAF is a direct cause of multiple injuries and deaths, and their lethality far exceeds anything likely imagined by the authors of the Second Amendment.5 Public policy recommendations include restriction on purchase of high-capacity magazines as an important plank in mitigating potential injuries and deaths of mass shootings.30
Policy Implications
High-capacity SAF (which include assault rifles) are used in 20-58% of all firearm mass murders, but are used in a particularly high proportion of public mass shootings.3,4,29 Civilian public mass shootings with SAFs result in substantially more fatal and especially non-fatal victims due to their rapidfire abilities, enabling the perpetrator to indiscriminately target victims in enclosed spaces or large gatherings.3,4,29 The 1994 federal ban on assault weapons and large-capacity (>10 rounds) ammunition magazines had exemptions and loopholes that limited its short-term effects, but its expiration in 2004 was followed by an increase in the use of these weapons in mass shootings and other crimes.31,32 Data suggests that policy measures involving state-level restrictions on large-capacity magazines may reduce mass shootings.4
Evidence from 130 studies in 10 countries demonstrates that, in other nations, the simultaneous implementation of laws targeting multiple firearms restrictions is associated with reductions in firearm deaths.33 Laws restricting the purchase of (eg, background checks) and access to firearms (eg, safer
Volume 24, NO.3: May 2023 557 Western Journal of Emergency Medicine Czaja et al. Nonfatal Injuries Sustained in Mass Shootings in the US, 2012-2019
Figure 2. Anatomic distribution of nonfatal gunshot wounds and other trauma sustained by 403 survivors of 13 civilian public mass shootings in the United States (2012-19).
Nonfatal Injuries Sustained in Mass Shootings in the US, 2012-2019
Table 2. Mass Shooting Injury Matrix (classification of trauma by body region and nature of the injury) sustained by 364 patients injured in 13 civilian public mass shootings in the US (2012-19).*
12
a Intracranial TBI, Fracture (1A) consists of 5 open skull fractures whereas Extracranial TBI, Fracture (2A) consists of 3 closed skull fractures.
b Intracranial TBI, Internal Organ Trauma (1D) consists of 6 cerebral lacerations/hemorrhages/infarctions, 4 subarachnoid hemorrhages, 2 subdural hemorrhages/ hematomas, and 1 epidural hemorrhage/hematoma.
c Head and Scalp, Other & Unspecified (3L) consists of 13 closed head injuries/concussions caused by falls and other non-ballistic trauma.
d Face, Fracture (4A) includes orbital fractures but Eye and Eyelid (Row 5) includes all other trauma to the orbital region: 8 orbital GSWs (5E), 3 orbital contusions (5H), and 1 optic nerve/visual pathway injury (5K).
e Other Head, Face and Neck, Gunshot wound (7E) consists of 1 GSW to the ear.
f Other Head, Face and Neck, Other & Unspecified (7L) consists of 2 dental fractures (1 each by GSW and non-GSW).
Western Journal of Emergency Medicine 558 Volume 24, NO.3: May 2023
Czaja et al. Nature of injury (12 Columns A-L) A B C D E F G H I J K L Body region (33 Rows) Fracture Dislocation Sprain and strain Internal organ trauma Gunshot wound Amputation Vascular trauma Soft tissue contusion Crush Injury Laceration and abrasion Nerve injury Other and unspecified Total diagnoses by body region Traumatic Brain Injury (TBI) 1 Intracranial 5 a13 b--018 2 Extracranial 3 a0---3 Head, Face & Neck 3 Head and Scalp 0-130 5 0 3 0 13 c 34 4 Face d 12 0 070 3 0 4 0 0 26 5 Eye and Eyelidd-80 3 0 0 1 0 12 6 Neck 0441 0 0 1 0 0 10 7 Other and Unspecified 001 e0 0 0 0 0 2 f 3 Spinal Cord Injury (SCI) 8 Cervical SCI 00---0 9 Thoracic/ Dorsal SCI 00---0 10 Lumbar SCI 00---0
Sacral/ Coccygeal SCI 00---0
11
Unspecified SCI 00---0
and Thorax, Fracture (18A) includes open and closed rib fractures counted individually for each rib in the event of multiple fractures.
Internal Organ Trauma (18A) includes pulmonary contusion, hemothorax, pneumothorax, diaphragm injury, and myocardial infarction.
and Retroperitoneum, Internal Organ Trauma (19D) includes visceral trauma to the abdominal and retroperitoneal compartments including stomach, small intestine, large intestine, rectum, anus, liver, gallbladder, pancreas, spleen, and kidneys.
and Urogenital, Internal Organ Trauma (20D) includes visceral trauma to the lower urinary tract (ureter, bladder, and urethra), gonads (ovaries, testes), external genitalia, and uterus.
Upper Arm and Axilla, Fracture (22A) includes all humerus fractures (proximal, mid-shaft, and distal), clavicle, and scapula fractures.
Volume 24, NO.3: May 2023 559 Western Journal of Emergency Medicine Czaja et al. Nonfatal Injuries Sustained in Mass Shootings in the US, 2012-2019 Nature of injury (12 Columns A-L) A B C D E F G H I J K L Body region (33 Rows) Fracture Dislocation Sprain and strain Internal organ trauma Gunshot wound Amputation Vascular trauma Soft tissue contusion Crush Injury Laceration and abrasion Nerve injury Other and unspecified Total diagnoses by body region Vertebral Column Injury (VCI) 13 Cervical VCI 0 0 2----2 14 Thoracic/ Dorsal VCI 1 0 1----2 15 Lumbar VCI 3 0 2----5 16 Sacral/ Coccygeal VCI 0 0 0----0 17 Unspecified VCI 0 0 0----0 Torso 18 Chest and Thorax 23 g 0 2 45 h 330 10 0 0 0 0 113 19 Abdomen-48 332 4 1 1 0 0 89 20 Pelvis and urogenital 7 0 0 11 j 90 0 1 0 0 0 28 21 Back and buttock5270 3 1 1 0 0 37 Upper extremity 22 Shoulder, upper arm and axilla 17 k 2 736 0 13 4 0 3 7 0 89 23 Forearm and elbow 14 2 122 0 3 5 0 9 4 0 60 24 Wrist, hand and fingers 30 0 823 2 1 4 0 8 3 0 79 Table 2. Continued. g Chest
h Chest
i Abdomen
j Pelvis
k Shoulder,
and Thorax,
Nonfatal Injuries Sustained in Mass Shootings in the US, 2012-2019
l Hip, Fracture (26A) consists of femoral neck fractures, including pertrochanteric fractures (greater and lesser trochanter). Upper Leg and Thigh, Fracture (27A) consists of all other femur fractures distal to the femoral neck including mid-shaft and condylar.
m Multiple Body Regions, Fracture (32A) consists of a single diagnosis code describing multiple metacarpal fractures but the total number was unknown. Therefore, one hand fracture (24A) and one multiple fractures (32A) were entered into the matrix.
n Multiple Body Regions, Gunshot Wound (32E) consists of 6 diagnosis codes describing GSWs of multiple sites of the arm or leg but the total number of GSWs was unknown. Therefore, one GSW to unspecified region of arm (25E) or leg (31E) and one multiple GSWs (32E) were entered into the matrix.
o Multiple Body Regions, Soft Tissue Contusion (32H) and Multiple Body Regions, Lacerations and Abrasions (32J) include 3 and 6 discrete diagnosis codes describing multiple injuries, respectively. Unlike multiple fractures and GSWs, multiple contusions and abrasions were only entered into the matrix once.
Western Journal of Emergency Medicine 560 Volume 24, NO.3: May 2023
Czaja et al. Nature of injury (12 Columns A-L) A B C D E F G H I J K L Body region (33 Rows) Fracture Dislocation Sprain and strain Internal organ trauma Gunshot wound Amputation Vascular trauma Soft tissue contusion Crush Injury Laceration and abrasion Nerve injury Other and unspecified Total diagnoses by body region 25 Other and unspecified 0 0 015 0 0 1 0 1 0 0 17 Lower extremity 26 Hip 8 0 27 0 0 1 0 0 0 0 18 27 Upper leg and thigh 8 0 139 0 3 1 0 3 4 0 59 28 Knee 4 0 17 0 2 5 0 4 0 0 23 29 Lower leg and ankle 18 1 732 0 5 3 0 6 1 0 73 30 Foot and toes 14 0 213 0 0 0 0 5 1 0 35 31 Other and unspecified 0 0 028 0 2 0 0 3 2 0 35 Multiple and unspecified 32 Multiple body regions 1 m 0 0 0 6 n 0 0 3 o 0 6 o 0 0 16 33 Unspecified body region 6 0 0 0 0 0 2 0 0 2 1 0 11 Total diagnoses by nature of injury (Percentage of grand total diagnoses [N=897]) 174 (19.4%) 5 (0.5%) 45 (5.0%) 117 (13.0%) 363 (40.5%) 2 (0.2%) 34 (3.8%) 55 (6.1%) 3 (0.3%) 60 (6.7%) 24 (2.7%) 15 (1.7%) N=897 Table
Continued.
2.
Sprain, Strain and Tendon Injury (Column C) consists of 33 musculoskeletal strains and sprains caused by non-ballistic trauma and 12 tendon ruptures/injuries caused by GSWs.
q Internal Organ Trauma (Column D) includes 4 myocardial infarctions, 2 associated with blunt force trauma, and 2 associated with exertion/preexisting coronary disease.
.
storage) are also associated with lower rates of intimate partner homicides and unintentional firearms deaths in children, respectively.33 Furthermore, laws requiring permits to purchase a gun are also associated with a lower incidence of mass public shootings, and bans on large-capacity magazines are associated with fewer fatalities and nonfatal injuries when such events do occur.34
falls/non-ballistic trauma, 1 dental fracture from a fall, and one 1
Our findings from mass shooting events represent a subset of US national firearm injuries and deaths. The US Centers for Disease Control and Prevention established the National Violent Death Reporting System (NVDRS) in 2002, with six states reporting.35,36 Currently all 50 states, the District of Columbia, and Puerto Rico report their data. This robust dataset tracks all types of firearm deaths, including intentional, unintentional, those from interpersonal violence, legal intervention, and undetermined intent. However, the NVDRS does not track nonfatal firearm injuries as described here.36 Research funding to study important aspects of firearm death is now available and has been distributed to 16 projects to date. However, none of these currently funded projects focus on mass shooting intervention or prevention. Ten state government agencies have received funding to enhance death surveillance and reporting, again excluding firearm injuries.
The NVDRS applies the principles of public health research and intervention pioneered by Dr. William Haddon, the first director of the National Highway Safety Administration, whose use of the scientific approach led to dramatically reduced morbidity and mortality of highway crashes over decades. Application of these principles has promise to similarly reduce both injuries and deaths from firearm violence.37
Otherwise, all other visceral trauma was caused by GSWs.
r Other and Unspecified (Column L) consists of 13 closed head injuries from
Anatomic and Organ System Injuries in the Barell Injury Diagnosis Matrix
The BIDM is a reliable and useful format for describing trauma-related morbidity. There is already a NVDRS, and this matrix could form the backbone of an analogous national violent injury reporting system.38 In this study, we modified the BIDM to distinguish between GSW and non-GSW open wounds and penetrating trauma. The ICD system is imperfect, as it was designed for billing purposes rather than clinical research. However, its use here as a clinical surrogate is widespread and relatively straightforward. We call for greater resources and funding to better capture CPMS data in trauma registries and to separate these data from other firearm violence. We also recognize the need for a universal definition for mass shooting for clinicians and public health workers. Finally, there is a need to separately track the GSW vs nonGSW injuries. Although we found most injuries were ballisticrelated, 19.1% of the injuries were not.
Mass Shootings Patient Conditions Apart from Trauma
While we did not collect long-term follow-up data, it is well known that victims of firearm injury and mass shootings
Volume 24, NO.3: May 2023 561 Western Journal of Emergency Medicine Czaja et al. Nonfatal Injuries Sustained
in the US, 2012-2019 Nature of injury (12 Columns A-L) A B C D E F G H I J K L Body region (33 Rows) Fracture Dislocation Sprain and strain Internal organ trauma Gunshot wound Amputation Vascular trauma Soft tissue contusion Crush Injury Laceration and abrasion Nerve injury Other and unspecified Total diagnoses by body region Diagnoses caused by GSW (Percentage of column total) 163 (93.7%) 0 (0.0%) 12 p (26.7%) 113 q (96.6%) 363 (100.0%) 2 (100.0%) 34 (100.0%) 0 (0.0%) 0 (0.0%) 0 (0.0%) 24 (100.0%) 14 r (93.3%) 725 (80.8%) Diagnoses
by nonGSW (Percentage
total) 11 (6.3%) 5 (100.0%) 33 p (73.3%) 4 q (3.4%) 0 (0.0%) 0 (0.0%) 0 (0.0%) 55 (100.0%) 3 (100.0%) 60 (100.0%) 0 (0.0%) 1 r (6.7%) 172 (19.2%) Table 2.
p
in Mass Shootings
caused
of column
Continued.
fracture
GSW
from
Nonfatal Injuries Sustained in Mass Shootings in the US, 2012-2019
suffer from higher rates of psychological illness.39 Children and adolescents may be especially vulnerable, suffering from higher rates of post-traumatic stress, suicide, depression, substance abuse, and anxiety.40 Hospitals should incorporate aftermath services that address the psychological sequelae of a CPMS into their emergency medical systems (EMS) disaster plans.
Psychiatric conditions were common among our patients from mass shootings. We found 12.4% of the victims presented for acute mental health issues; given the chaos of these incidents, the true proportion and impact on mental health is certainly higher. Fifteen patients were formally diagnosed with ASD, and six were diagnosed with PTSD by the time of hospital discharge. These 21 patients formed almost one-third (28%) of all psychiatric diagnoses. As a key difference between ASD and PTSD involves the duration of symptoms (3-30 days vs > 30 days),21 it is plausible that some of the patients with ASD may have subsequently developed PTSD.
Furthermore, the incidence of psychiatric sequelae in our sample is likely under-reported, as some patients never presented with acute psychological distress, and 256 of all 403 patients (63.5%) were discharged from the ED before any detailed evaluation of their emotional state. Therefore, the incidence of 5.2% (21/403) should be considered a minimum proportion. In the acute post-disaster period, one study found 20% of men and 36% of women met criteria for PTSD, the most prevalent psychiatric disorder. One-half of women and one-fourth of men with PTSD also met criteria for other psychiatric diagnoses, most commonly major depression.40 Survivors of GSWs may experience negative psychiatric outcomes for years after.41 The diagnoses not included in the MSIM speak to this point. We found 39 patients with only non-traumatic diagnoses (9.7%) and an additional 50 patients (12.4%) with 75 more psychiatric diagnoses, for a total of 22.1% with only or additional non-injury diagnoses. It is unlikely that all potential psychiatric diagnoses were contemporaneously captured due to the chaos and short evaluation time of many patients; therefore, this report likely underestimates the true number. Vela et al41 evaluated GSW victims (not specifically from CPMS) and found that combined alcohol and substance use increased from 30.8% pre-to 44.0% post-GSW. Subjects up to five years after GSW had lower than comparison population scores on Global Physical Health (45 [11]; P < .001), Global Mental Health (48 [11]; P = .03), and Physical Function (45 [12]; P < .001) on the National Institutes of Health’s Patient-Reported Outcome Measure Information System.42 Furthermore, they found 48.6% of their subjects screened positive for probable PTSD, far greater than the 12.4% found here.
Physical problems for victims of a CPMS last far beyond the acute care/initial hospitalization phase. Although we gathered systematic data on all injured patients during the index ED visit and subsequent hospitalization, and hospital
Czaja et al.
charges for the following week, we recognize that healthcare costs and disability continue. An example from the dataset includes one patient from a CPMS who was shot in the extremity and presented for initial care the next day to his home hospital hundreds of miles away, with a complex longbone fracture. His ongoing care included five major surgeries and follow-up visits for 2.5 years. until ultimately lost to follow-up. He accumulated $450,000 in medical charges, and, at the last documented visit, continued to suffer residual disability with work restrictions involving light duty only. Victims of mass shootings have complex and ongoing care needs. Therefore, this report should be considered an accurate description of only the initial phase of injury care. Further work is needed to better understand the comprehensive consequences of physical and psychological injury.
Communities, individuals, and healthcare workers who fall victim to CPMS can benefit from mental health resources such as critical incident stress debriefing (CISD).43,44 Per the US Department of Labor, CISD is a facilitator-led group process conducted soon after a traumatic event with individuals considered to be under stress from trauma exposure. In addition, psychosocial interventions, such as Psychological First Aid, Skills for Psychological Recovery, and Listen, Protect, and Connect: Psychological First Aid for Children and Parents, have been developed to aid victims.45,46 These programs should be incorporated into hospital- and EMS-level disaster plans to help individuals cope with the aftermath of CPMS.
Emergency Planning
Our results also provide information for emergency planning and resource allocation preparation by community EDs in the event of a mass shooting. Any community ED could face, and should be prepared for, a mass casualty event from a civilian mass shooting. Injured victims could quickly overwhelm the resources of community hospitals that lack the advanced resources of a tertiary trauma or regional referral center. (Community hospitals received 194/403 [48.1%] of the patients in the current study.) Although 14/403 (3.5%) patients were ultimately transferred to centers with advanced resources, the initial stabilization and much of the comprehensive care were provided in non-trauma centers. Therefore, it is critical that these facilities prepare for the types and frequencies of injuries described here.
Future Research
Important foci of research and public policy change include assessment of the potential impact of “smart guns,” which can only be fired by the registered user; increased background checks and waiting periods (including closing socalled “gun-show loopholes” that avoid background checks); appropriate application of concealed weapon permits; removal of tort liability protections for gun manufacturers; restriction of semi-automatic and automatic weapons; and restriction of
Western Journal of Emergency Medicine 562 Volume 24, NO.3: May 2023
* † ‡ § || # ¶ ** †† ‡‡
large-capacity magazines, which is specifically important to mitigate the harm from CPMS described here.
LIMITATIONS
Neighborhood Shootings/Public Databases
This study focuses on mass shootings with >10 injuries, but numerous shootings occur daily (698 in the US in 2021) with multiple victims sustaining considerable morbidity along with death. These daily shootings do not fit within the Congressional Research Service definition of mass shootings, which excludes gang violence and shootings involving criminal profit.47 Furthermore, public databases have varying definitions of mass shootings.48 While the definition used here was purposely narrow to identify a large number of victims at sites with high potential for engaged local champions (see Site Recruitment, below), the injuries from neighborhood gang violence and criminal profit are no less devastating. In fact, these neighborhood shootings have been shown to garner less public attention from the media, another indicator of health and safety inequities in minority communities.49 The injury patterns, outcomes, and resource use reported here are likely generalizable to the larger firearm violence epidemic, with the caveat that neighborhood shootings may be less likely to involve SAFs with high-capacity magazines.
Site Recruitment
Mass shooting site recruitment for this study required local champions at hospitals that treated victims from CPMSs. Some institutions were unwilling to contribute data to the study for fear of public relations damage (personal communication). In addition, some patients presented to non-teaching hospitals, which lacked either research infrastructure or interest to participate. Data on 377 patients (45% of our potential sample) from the Las Vegas Route 91 Harvest Festival CPMS were unobtainable due to site-related limitations.7 This reinforces our call for a national database of mass shooting deaths and injuries, not dependent on local cooperation.
Data Collection
The true number of patients who presented to EDs for 12 of the CPMSs reported here are generally lower than publicly reported databases. By contrast, for the Las Vegas CPMS, local treating physicians reported that many patients were never registered or had incomplete documentation, given the volume, pace of influx, acuity, and arrival without identification.50 Chaos and communication breakdowns are common to all mass shootings, with one study finding that 13 of 17 (76.5%) incidents experienced a communication failure in the aftermath.51 Public databases are based on lay media and have different definitions; thus, the challenges we encountered highlight the importance of accurate information. Data collection was also hindered by age of records, legacy medical records, and IRB-specific restrictions, such as the exclusion of children, pregnant women, and police officers at some sites.
Despite the difficulties in site recruitment and discrepancies with reported statistics, the 403 victims described in this study represent real patients, as opposed to media estimates.
CONCLUSION
Mass shootings are common in the United States. In addition to further research on the human toll of these events, we call for additional study of the psychology of the perpetrators, the forensics of their weapons, abortive/ prevention strategies, and the long-term physical and emotional impact on survivors. We advocate for the addition of firearm-related injuries to the existing infrastructure of the National Violent Death Reporting System. Only with proper research and funding will we best inform public policy to mitigate the enormous consequences of mass shootings.
AUTHORS CONTINUED
Melissa L. Whitmill, MD*
Una Aluyen, MD†
Jeffery M Pinnow, MD‡
Amanda Young, MD§
Carly D. Eastin, MD§
Nurani M. Kester, MD||
Kaitlyn R. Works, MD#
Andrew N. Pfeffer, MD#
Aleksander W. Keller, MD¶
Adam Tobias, MD¶
Benjamin Li, MD**
Brian Yorkgitis, DO††
Soheil Saadat, MD, MPH, PhD‡‡
Mark I. Langdorf, MD, MHPE‡‡
*Kettering Health Main Campus, Division of Acute Care Surgery, Critical Care, and Trauma, Department of Surgery, Kettering, Ohio
†Texas Tech University Health Sciences Center School of Medicine, Department of Emergency Medicine, Odessa, Texas
‡Medical Center Hospital, Department of Emergency Medicine, Odessa, Texas
§University of Arkansas for Medical Sciences, Department of Emergency Medicine, Little Rock, Arkansas
||University of Texas Health Science Center at San Antonio, Department of Emergency Medicine, San Antonio, Texas
#Vanderbilt University Medical Center, Department of Emergency Medicine, Nashville, Tennessee
¶University of Pittsburgh Medical Center, Department of Emergency Medicine, Pittsburgh, Pennsylvania
** Denver Health, Department of Emergency Medicine, Denver, Colorado
††University of Florida College of Medicine, Division of Acute Care Surgery, Department of Surgery, Jacksonville, Florida
‡‡University of California Irvine School of Medicine, Department of Emergency Medicine, Irvine, California
Volume 24, NO.3: May 2023 563 Western Journal of Emergency Medicine Czaja et al. Nonfatal Injuries Sustained in Mass Shootings in the US, 2012-2019
Nonfatal Injuries Sustained in Mass Shootings in the US, 2012-2019 Czaja
Address for Correspondence: Mark I. Langdorf, MD, MHPE, University of California Irvine School of Medicine, Department of Emergency Medicine, 3800 West Chapman Ave., Suite 3200, Orange, CA 92868. Email: milangdo@uci.edu.
Conflicts of Interest: By the WestJEM article submission agreement, all authors are required to disclose all affiliations, funding sources and financial or management relationships that could be perceived as potential sources of bias. No author has professional or financial relationships with any companies that are relevant to this study. There are no conflicts of interest or sources of funding to declare.
Copyright: © 2023 Czaja et al. This is an open access article distributed in accordance with the terms of the Creative Commons Attribution (CC BY 4.0) License. See: http://creativecommons.org/ licenses/by/4.0/
medical record review studies in emergency medicine research. Ann Emerg Med. 2005;45(4):448-51.
12. Gilboy N, Tanabe P, Travers D, et al. Emergency Severity Index Implementation Handbook 2020 edition. A Triage Tool for Emergency Department Care, version 4. 2020. Available at: https://www.ena. org/docs/default-source/education-document-library/triage/esiimplementation-handbook-2020.pdf?sfvrsn=fdc327df_4. Accessed September 9, 2022.
13. National Center for Health Statistics, Centers for Disease Control and Prevention. International Classification of Diseases, Ninth Revision, Clinical Modification (ICD-9-CM). Available at: https://www.cdc.gov/ nchs/icd/icd9cm.htm. Accessed September 9, 2022.
14. National Center for Health Statistics, Centers for Disease Control and Prevention. International Classification of Diseases, Tenth Revision, Clinical Modification (ICD-10-CM). Available at: https://www.cdc.gov/ nchs/icd/icd-10-cm.htm. Accessed September 9, 2022.
REFERENCES
1. Klein J, Prabhakaran K, Latifi R, Rhee P. Firearms: the leading cause of years of potential life lost. Trauma Surg Acute Care Open 2022;7(1):e000766.
2. Kaufman EJ, Wiebe DJ, Xiong RA, Morrison CN, Seamon MJ, Delgado MK. Epidemiologic trends in fatal and nonfatal firearm injuries in the US, 2009-2017. JAMA Intern Med. 2021;181(2):237-44.
3. Fowler KA, Leavitt RA, Betz CJ et al. Examining differences between mass, multiple, and single-victim homicides to inform prevention: findings from the National Violent Death Reporting System. Inj. Epidemiol. 2021;8:49.
4. Koper CS, Assessing the potential to reduce deaths and injuries from mass shootings through restrictions on assault weapons and other high-capacity semiautomatic firearms. Criminol Public Policy 2020;19:147–70.
5. Hargarten SW. The bullets he carried. West J Emerg Med 2020;21(5):1036.
6. Constitution of the United States. Second Amendment. Available at: https://constitution.congress.gov/constitution/amendment-2/ Accessed September 9, 2022.
7. Czaja MP, Kraus CK, Phyo S, et al. Injury characteristics, outcomes, and health care services use associated with nonfatal injuries sustained in mass shootings in the US, 2012-2019. JAMA Netw Open. 2022;5(5):e2213737.
8. Barell V, Aharonson-Daniel L, Fingerhut LA, et al. An introduction to the Barell body region by nature of injury diagnosis matrix. Inj Prev 2002;8(2):91-6.
9. The Violence Project. Mass shooter database Version 3.0. Updated March 2021. Available at: https://www.theviolenceproject.org/massshooter-database/. Accessed September 9, 2022.
10. Follman M, Aronsen G, Pan D. US mass shootings, 1982-2019: data from Mother Jones’ investigation. Mother Jones. 2021. Available at: https://www.motherjones.com/politics/2012/12/mass-shootings-motherjones-full-data/. Accessed September 9, 2022.
11. Worster A, Bledsoe RD, Cleve P, et al. Reassessing the methods of
15. ICD-10-CM to ICD-9-CM Converter. ICD.codes. Available at: https:// icd.codes/convert/icd10-to-icd9-cm. Accessed September 9, 2022.
16. Fingerhut LA, Warner M. The ICD-10 injury mortality diagnosis matrix. Inj Prev. 2006;12(1):24-9.
17. Hedegaard H, Johnson RL, Warner M, et al. Proposed framework for presenting injury data using the International Classification of Diseases, Tenth Revision, Clinical Modification (ICD-10-CM) diagnosis codes. Natl Health Stat Report. 2016;(89):1-20.
18. 18 U.S. Code § 921 (a)(29). Legal Information Institute: Open Access to Law since 1992. Cornell Law School. Available at: https://www.law. cornell.edu/uscode/text/18/921#a_29. Accessed September 9, 2022.
19. Bureau of Firearms, State of California Department of Justice. Senate Bill 23 Assault Weapon Characteristics. Available at: https:// oag.ca.gov/firearms/regs/genchar2. Accessed September 9, 2022.
20. National Hospital Ambulatory Medical Care Survey: 2017 Emergency Department Summary Tables. Table 7. Triage status of emergency department visits, by selected patient characteristics: United States, 2017. Available at: https://www.cdc.gov/nchs/data/nhamcs/web_ tables/2017_ed_web_tables-508.pdf. Accessed September 9, 2022.
21. American Psychiatric Association: Diagnostic and Statistical Manual of Mental Disorders (DSM-5-TR). Available at: https://psychiatry.org/ psychiatrists/practice/dsm. Accessed August 8, 2022.
22. Kelen GD, Catlett CL, Kubit JG, et al. Hospital-based shootings in the United States: 2000 to 2011. Ann Emerg Med. 2012;60(6):790-8.e1.
23. Livingston MD, Rossheim ME, Hall KS. A descriptive analysis of school and school shooter characteristics and the severity of school shootings in the United States, 1999-2018. J Adolesc Health 2019;64(6):797-9.
24. Nance ML, DeSimone JD, Lorch SA, et al. Locations of mass shootings relative to schools and places frequented by children. JAMA Pediatr. 2020;174(11):1109-10.
25. Tobias J, Cunningham A, Krakauer K, et al. Protect Our Kids: a novel program bringing hemorrhage control to schools. Inj Epidemiol 2021;8 Suppl 1:31.
26. Carmichael H, Steward L, Peltz ED, et al. Preventable death and interpersonal violence in the United States: Who can be saved? J
Western Journal of Emergency Medicine 564 Volume 24, NO.3: May 2023
et al.
Trauma Acute Care Surg. 2019;87(1):200-4.
27. Lenz A, Shelton R, Ryznar R, et al. The next nine minutes: lessons learned from the large-scale active shooter training prior to the STEM school shooting. Am J Disaster Med. 2020;15(4):241-9.
28. American College of Surgeons. Press Release: The City of Chicago expands public safety program, installs more than 550 STOP THE BLEED® kits in more than 350 locations throughout the city. Available at: https://www.facs.org/for-medical-professionals/news-publications/ news-and-articles/press-releases/2022/stb-safe-chicago/. Accessed September 9, 2022.
29. Brown JD, Goodin AJ. Mass casualty shooting venues, types of firearms, and age of perpetrators in the United States, 1982-2018. Am J Public Health. 2018;108(10):1385-7.
30. Fernandez J, Nichols T, Basrai Z, et al. California ACEP Firearm Injury Prevention Policy. West J Emerg Med. 2021;22(2):266-9.
31. Brady: United Against Gun Violence. GUN LAWS, LOOPHOLES, AND VIOLENCE. Available at: https://www.bradyunited.org/issue/ laws-and-loopholes. Accessed September 9, 2022.
32. DiMaggio C, Avraham J, Berry C, et al. Changes in US mass shooting deaths associated with the 1994-2004 federal assault weapons ban: Analysis of open-source data. J Trauma Acute Care Surg. 2019;86(1):11-9.
33. Santaella-Tenorio J, Cerdá M, Villaveces A, et al. What do we know about the association between firearm legislation and firearm-related injuries? Epidemiol Rev. 2016;38(1):140-57. Erratum in: Epidemiol Rev. 2017;39(1):171-2.
34. Siegel M, Goder-Reiser M, Duwe G, et al. The relation between state gun laws and the incidence and severity of mass public shootings in the United States, 1976-2018. Law Hum Behav. 2020;44(5):347-60.
35. Nazarov O, Guan J, Chihuri S, et al. Research utility of the National Violent Death Reporting System: a scoping review. Inj Epidemiol. 2019;6:18.
36. Fast Facts: Firearm Violence Prevention. Centers for Disease Control and Prevention. Available at: https://www.cdc.gov/violenceprevention/ firearms/fastfact.html. Accessed September 9, 2022.
37. Lee LK, Douglas K, Hemenway D. Crossing Lines: a change in the leading cause of death among U.S. children. N Engl J Med 2022;386(16):1485-7.
38. National Violent Death Reporting System. Centers for Disease Control and Prevention. Available at: https://www.cdc.gov/ violenceprevention/datasources/nvdrs/index.html Accessed September 9, 2022.
39. Lowe SR, Galea S. The mental health consequences of mass shootings. Trauma Violence Abuse. 2017;18(1):62-82.
40. Cimolai V, Schmitz J, Sood AB. Effects of mass shootings on the mental health of children and adolescents. Curr Psychiatry Rep 2021;23(3):12.
41. Vella MA, Warshauer A, Tortorello G, et al. Long-term functional, psychological, emotional, and social outcomes in survivors of firearm injuries. JAMA Surg. 2020;155(1):51-9.
42. National Institutes of Health Patient-Reported Outcomes Measurement Information System (PROMIS). Available at: https:// commonfund.nih.gov/promis/index. Accessed September 9, 2022.
43. Engel RJ, Lee DHJ, Rosen D. Psychiatric sequelae among community social service agency staff 1 year after a mass shooting. JAMA Netw Open. 2020;3(8):e2014050.
44. Occupational Safety and Health Administration, United States Department of Labor. Critical Incident Stress Guide. Available at: https://www.osha.gov/emergency-preparedness/guides/criticalincident-stress#:~:text=What%20is%20Critical%20Incident%20 Stress%20Debriefing%3F,under%20stress%20from%20trauma%20 exposure. Accessed September 9, 2022.
45. United States Department of Veteran Affairs. Helping Survivors: Long-Term Treatment Interventions Following Disaster and Mass Violence. PTSD: National Center for PTSD. Available at: www.ptsd. va.gov/professional/treat/type/disaster_longterm_tx.asp. Accessed September 9, 2022.
46. Schreiber M, Gurwitch R. Listen, Protect, and Connect, Psychological First Aid for Children and Parents. 2006. Available at: https://www. ready.gov/sites/default/files/documents/files/PFA_Parents.pdf Accessed September 9, 2022.
47. Bjelopera JP, Bagalman E, Caldwell SW, et al. Public mass shootings in the United States: selected implications for federal public health and safety policy. Congressional Research Service Report R43004. 2013. Available at: https://sgp.fas.org/crs/misc/R43004.pdf. Accessed December 25, 2021.
48. Booty M, O’Dwyer J, Webster D, et al. Describing a “mass shooting”: the role of databases in understanding burden. Inj Epidemiol. 2019;6:47.
49. Beard JH, Jacoby SF, James R, et al. Examining mass shootings from a neighborhood perspective: an analysis of multiple-casualty events and media reporting in Philadelphia, United States. Prev Med 2019;129:105856.
50. Association of state and territorial health officials report, december 2018 public health and medical preparedness and response activities at the 2017 Route 91 Harvest Music Festival: a peer assessment report. Available at: https://www.astho.org/ globalassets/report/public-health-and-medical-preparedness-andresponse-activities-at-the-2017-route-91-harvest-music-festival.pdf. Accessed September 9, 2022.
51. Turner CD, Lockey DJ, Rehn M. Pre-hospital management of mass casualty civilian shootings: a systematic literature review. Crit Care 2018;20(1):362. Erratum in: Crit Care. 2017;21(1):94.
Volume 24, NO.3: May 2023 565 Western Journal of Emergency Medicine Czaja et al. Nonfatal Injuries Sustained in Mass Shootings in the US, 2012-2019
Blood Vessel Occlusion by the Layperson Audiovisual Assist
Tourniquet (LAVA TQ) Compared to the Combat Application
Tourniquet: Randomized Controlled Trial
Craig Goolsby, MD,MEd,MHCDS#,*
Nicole Dacuyan-Faucher, MPH#,¶
Keke Schuler, PhD†
Annie Lee, MS‡
Amit Shah, MD§
Jeremy Cannon, MD,SM||
Curt Kothera, PhD§
Section Editor: Gabriel Wardi, MD
Harbor-UCLA Medical Center, Department of Emergency Medicine, Torrance, California
David Geffen School of Medicine at UCLA, Los Angeles, California
The Henry M Jackson Foundation for the Advancement of Military Medicine, Bethesda, Maryland
Uniformed Services University of the Health Sciences, Bethesda, Maryland
InnoVital Systems, Calverton, Maryland
University of Pennsylvania, Department of Surgery, Philadelphia, Pennsylvania
The Lundquist Institute, Torrance, CA
Submission history: Submitted October 10, 2022; Revision received February 10, 2023; Accepted March 2, 2023
Electronically published May 9, 2023
Full text available through open access at http://escholarship.org/uc/uciem_westjem
DOI: 10.5811/westjem.59147
Introduction: While windlass-rod style tourniquets stop bleeding in limbs when used by skilled responders, they are less successful in the hands of the untrained or not recently trained public. To improve usability, an academic-industry partnership developed the Layperson Audiovisual Assist Tourniquet (LAVA TQ). The LAVA TQ is novel in design and technology and addresses known challenges in public tourniquet application. A previously published multisite, randomized controlled trial of 147 participants showed that the LAVA TQ is much easier for the lay public to use compared to the Combat Application Tourniquet (CAT). This study evaluates the LAVA TQ’s ability to occlude blood flow in humans compared to the CAT.
Methods: This study was a prospective, blinded, randomized controlled trial to demonstrate the non-inferiority of the LAVA TQ to occlude blood flow when applied by expert users compared to the CAT. The study team enrolled participants in Bethesda, Maryland, in 2022. The primary outcome was the proportion of blood flow occlusion by each tourniquet. The secondary outcome was surface application pressure for each device.
Results: The LAVA TQ and CAT occluded blood flow in all limbs (21 LAVA TQ, 100%; 21 CAT, 100%). The LAVA TQ was applied at a mean pressure of 366 millimeters of mercury (mm Hg) (SD 20 mm Hg), and the CAT at a mean pressure of 386 mm Hg (SD 63 mm Hg) (P = 0.14).
Conclusion: The novel LAVA TQ is non-inferior to the traditional windlass-rod CAT in occluding blood flow in human legs. The application pressure of LAVA TQ is similar to that used in the CAT. The findings of this study, coupled with LAVA TQ’s demonstrated superior usability, make the LAVA TQ an acceptable alternative limb tourniquet. [West J Emerg Med. 2023;24(3)566–571.]
INTRODUCTION
Immediate hemorrhage control with a limb tourniquet has been life-saving both on and off the battlefield.1,2 The US military estimates that tourniquets saved more than 1,000
lives in Iraq and Afghanistan, and tourniquets are now being used throughout communities and hospitals across the United States.1 The Stop the Bleed (STB) campaign, launched at the White House in 2015, brings these battlefield medical lessons
Western Journal of Emergency Medicine 566 Volume 24, NO.3: May 2023 Original
Research
# * † ‡ § || ¶
Goolsby et al.
Blood Vessel Occlusion by the LAVA TQ Compared to the CAT: Randomized Controlled Trial
home by teaching the public to control hemorrhage prior to the arrival of an ambulance.3,4 Rapid tourniquet application a core STB principle is now the first-line treatment for extremity hemorrhage in mainstream, public education guidelines.5
While the Combat Application Tourniquet (CAT) and other windlass-rod tourniquets can stop bleeding, the public is just 20% successful at applying them without training.6 Even with training, a layperson’s ability to apply tourniquets successfully drops to about 50% mere months after training.7 While widely available windlass-rod style tourniquets, such as the CAT, can stop bleeding when used by skilled responders, they are not intuitively designed. The non-optimized design makes them difficult for the minimally or untrained public to achieve successful extremity hemorrhage control. Multiple studies have shown poor performance by untrained layperson users, as well as rapid skill loss after training.6-8
To boost performance by the lay public, a team of academic and industry partners developed the Layperson Audiovisual Assist Tourniquet (LAVA TQ) the first audiovisual-enabled layperson tourniquet to improve the public’s ability, even if untrained, to save lives from extremity hemorrhage (Figure 1). The design and technology of the LAVA TQ address several known problems with tourniquets applied by the public. The LAVA TQ replaces the sometimesconfusing windlass-rod mechanism found in many standard tourniquets with an intuitive seatbelt design as the tourniquet’s strap and a user-friendly knob for tightening. Like a seatbelt in a vehicle, the LAVA TQ will tighten to snug against the extremity once the belt is clicked into place. This action removes the initial tightening step required in most standard windlass-rod tourniquets, thereby requiring fewer steps to apply. The LAVA TQ guides the user to successful application with a series of lights, color cues, pressure application feedback, and audio instructions.
A recent multisite, international study addressed the usability of the LAVA TQ by showing that the untrained public is much more successful at applying the LAVA TQ compared to a CAT (93% vs 22%) on simulated limbs.9 In this study we compare the ability of the LAVA TQ and CAT to occlude blood flow in human legs. We hypothesized that trained users with medical backgrounds would occlude blood flow during all applications of both the LAVA TQ and CAT on human limbs.
METHODS
This study was a prospective, blinded, randomized controlled trial to assess non-inferiority of the novel LAVA TQ (experimental arm) to occlude blood flow in human volunteers when compared to the CAT (control arm). The Uniformed Services University (USU) Institutional Review Board (IRB) reviewed and approved this study (USUHS.2020-060), and it is registered on the National Library of Medicine’s Clinical Trials website (clinicaltrials.gov, NCT05504733).
We performed an a priori power calculation for a parallel group non-inferiority trial. We assumed that all tourniquet
Population Health Research Capsule
What do we already know about this issue?
A layperson is not as successful in applying the Combat Application Tourniquet (CAT) as a skilled responder.
What was the research question? Is the new Layperson Audiovisual Tourniquet (LAVA TQ) non-inferior to CAT in occluding blood flow in human volunteers?
What was the major finding of the study?
The LAVA TQ and CAT occluded blood flow in all limbs (n=21 LAVA TQ, 100%; n = 21 CAT, 100%).
How does this improve population health? Stop the Bleed advocates for public access to trauma supplies. The easier-to-use LAVA TQ, which occludes blood flow comparably to a CAT, might enhance bystander response.
applications, in both the control (CAT) and experimental (LAVA TQ) study arms, would occlude blood flow. We then calculated a minimum sample size of 13 applications with each device (26 total) to have 80% power to detect a 10%
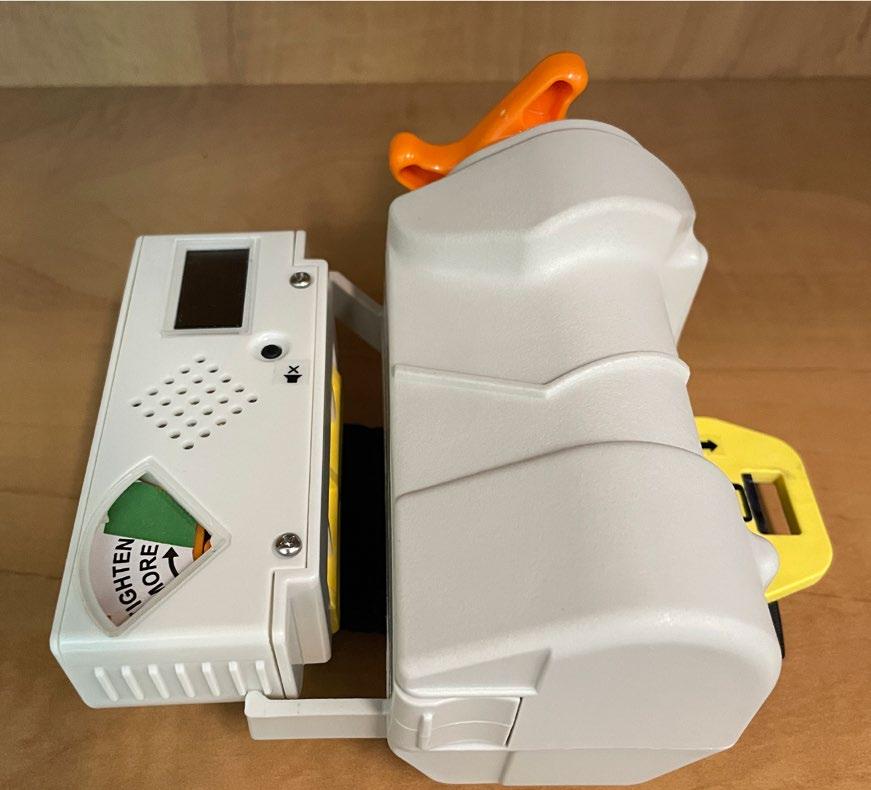
Volume 24, NO.3: May 2023 567 Western Journal of Emergency Medicine
Figure 1. The LAVA TQ*: a user-intuitive tourniquet with a seatbelt design and audiovisual instructions.
*LAVA TQ, Layperson Audiovisual Assist Tourniquet.
Blood Vessel Occlusion by the LAVA TQ Compared to the CAT: Randomized Controlled Trial Goolsby et al. difference (non-inferiority limit) in performance between the two devices. With IRB permission, we enrolled a total of 21 participants to undergo 42 applications (one device on each leg) by medical professionals. The primary outcome was the proportion of CAT applications compared to the LAVA TQ applications that occluded blood flow in human volunteers. The secondary outcome was the surface pressure of an applied CAT tourniquet compared to an applied LAVA TQ tourniquet in human volunteers.
We recruited healthy participants to undergo application of tourniquets to both of their legs. The exclusion criteria were as follows: age <18 or >65 years old; hypertension; prior vascular surgery; peripheral vascular disease; diabetes; prior lower extremity surgery; active lower extremity infection; any hypercoagulable condition; pregnancy; or any condition in which participants felt they could suffer harm from brief tourniquet application. Participants were recruited via email messages sent to members of the USU community, as well as word of mouth. Participants were not compensated. Studies involving military members and students at USU are reviewed and approved by a series of offices, including the Office of Student Affairs and military chain of command to prevent coercion of participants. For this study protocol we obtained all the routine approvals prior to execution.
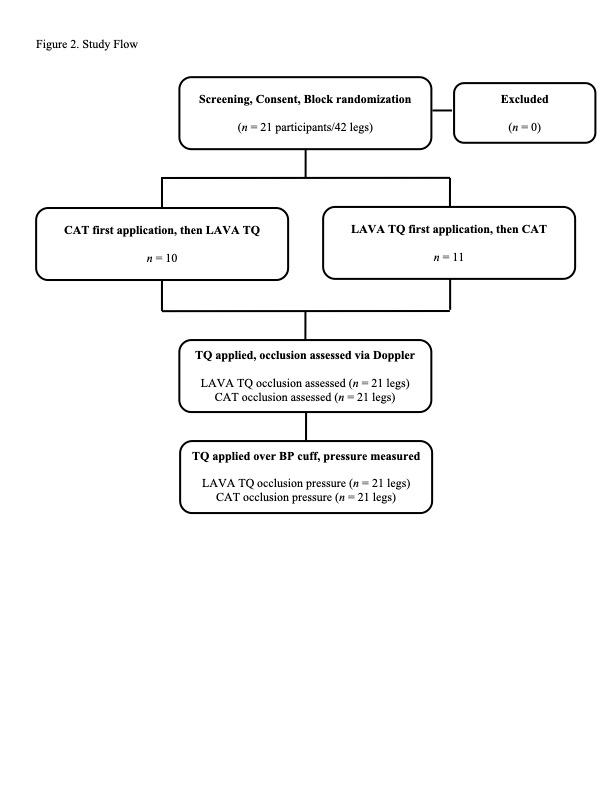
The study team collected all data on May 9, 2022, on the USU campus in Bethesda, Maryland. Twentyone participants arrived at a pre-scheduled time and then completed a screening questionnaire to verify eligibility (Table 1, Figure 2). After completing screening, each participant reviewed and signed an informed consent document that described the study, potential risks, and their ability to withdraw voluntarily at any time.
The study team randomized each participant and assigned them a participant number. The number was not linked to the participant, and no personally identifying data was collected as part of the study. The randomization occurred in blocks with the first 10 participants assigned to begin the study with CAT application, and the next 11 participants assigned to begin the study with the LAVA TQ application. Study observers evaluating blood flow were blinded to the participants’ randomization. Participants completed a pre-study questionnaire consisting of basic demographic information, height, and weight. Then study team members measured and recorded their resting brachial blood pressure and calf circumferences 10 centimeters (cm) distal to the tibial plateau.
Following the enrollment procedures, participants underwent the first part of the study. The participant removed shoes and socks from both feet and removed or moved any clothing distal to their knees. A trained observer then entered the study room and used a handheld Doppler ultrasound to detect the participant’s dorsalis pedis pulse in each foot. The observer used a surgical marker to place an “X” at the location of the detected pulse on the participant’s foot, and then left the room. One of two trained medical professionals, both with
military medical experience and a history of numerous CAT applications, applied either a CAT or LAVA TQ, as determined by randomization, to one of the participant’s legs. The medical professionals had been trained to use LAVA TQ prior to
Western Journal of Emergency Medicine 568 Volume 24, NO.3: May 2023
All (N = 19)a n (%) Age (years), M (range) 28 (22-51) Gender Female 5 (26) Raceb Asian or Pacific Islander 3 (16) Black 0 (0) White 18 (95) Other 1 (5) Ethnicity Hispanic origin 5 (26) Not of Hispanic origin 14 (74) Height (cm), M (range) 175 (152-196) Weight (kg), M (range) 81 (50-132) Right leg circumference (cm), M (range) 38 (27-47) Left leg circumference (cm), M (range) 38 (27-47)
Table 1. Participant demographics.
aTwo participants did not complete the demographic information. bMixed race participants were counted for multiple races. cm, centimeter; kg, kilogram.
Figure 2. Study flow.
LAVA TQ, Layperson Audiovisual Assist Tourniquet; CAT, Combat Application Tourniquet.
Goolsby et al.
TQ, based on randomization, to the participant’s leg with the attached neonatal blood pressure cuff.
Blood Vessel Occlusion by the LAVA TQ Compared to the CAT: Randomized Controlled Trial the study. Neither medical professional was involved in the development of the LAVA TQ nor did they have any financial or intellectual property interest in the device. The medical professionals did not assist with study design.
The medical professionals applied the tourniquet at a standardized location on all participants: 10 cm distal to the tibial plateau. They applied the tourniquet until they thought it was tight enough to stop blood flow. As soon as the tourniquet was applied, the medical professional covered the tourniquet and the participant’s lower leg with a blinding box and asked the observer to return to the room (Figure 3). The observer placed the Doppler ultrasound at the previously marked location of the participant’s dorsalis pulse and annotated a checklist to indicate if a pulse was present. The observer left the room, and the medical professional then removed the blinding box and tourniquet. The medical professional followed the same procedures to place the other type of tourniquet on the opposite leg.
After performing the experiment to determine the ability of the CAT and LAVA TQ to occlude blood flow, the participants underwent a second application of each device to determine their respective surface application pressures. The medical professional placed a neonatal blood pressure cuff (Neonate #1, single hose), which had been connected to an external gas pressure sensor system (Vernier Gas Pressure sensor, LabQuest 3 interface [Vernier Science Education, Beaverton, OR]), on the participant’s anterior lower leg 10 cm distal to the tibial plateau, with the length of the cuff oriented in the limb circumference direction. This blood pressure cuff was then wrapped lightly with an elastic wrap bandage to hold it in place. Then the external pressure gauge was zeroed, and the medical professional applied either the CAT or LAVA
The study team chose a neonatal blood pressure cuff as it fit under the band of either the CAT or LAVA TQ. The medical professional applied the device until they thought it would stop blood and covered the participant’s leg and tourniquet with the same blinding box used previously. The observer then entered the room and used the Doppler ultrasound to confirm the presence or absence of a dorsalis pedis pulse. If the pulse was absent, the medical professional recorded the surface pressure measured by the blood pressure cuff and gauge. If the pulse had been present, the medical professional would tighten and re-check. The observer left the room, and the medical professional removed the box and tourniquet. The medical professional then repeated the same series of steps using the other tourniquet on the participant’s opposite leg.
RESULTS
The 21 study participants had a mean age of 28 years (range 22-51), a mean weight of 81 kilograms (kg) (range 50-132 kg), and 26% were female (Table 1). For the study’s primary outcome, the medical professionals occluded blood flow in all participants in both the experimental LAVA TQ arm (21, 100%), and the control CAT arm (21, 100%) (Table 2). For the study’s secondary outcome of tourniquet application pressure, the LAVA TQ was applied at a mean pressure of 366 millimeters of mercury (mm Hg) (SD 20 mm Hg), and the CAT was applied at a mean pressure of 386 mm Hg (SD 63 mm Hg) (Table 2). The difference in application pressures was not statistically significant (P = 0.14).
DISCUSSION
The novel LAVA TQ is non-inferior to a traditional windlass-rod CAT in occluding blood flow in human legs. For skilled users, the CAT has proven effective at stopping lifethreatening hemorrhage in limbs, and the LAVA TQ is equally effective in occluding blood flow in this experiment in human limbs. While the primary anticipated benefit of the LAVA TQ is enhanced usability compared to the CAT, it is essential to document the device’s performance in occluding blood flow. The use of handheld Doppler ultrasound for measuring blood
Volume 24, NO.3: May 2023 569 Western Journal of Emergency Medicine
Figure 3. Blinding box used to shield the type of tourniquet from an observer who used handheld Doppler ultrasound to confirm the presence or absence of a dorsalis pedis pulse.
LAVA TQ (n = 21) n (%) CAT (n = 21) n (%) P-value Successful occlusion 21 (100) 21 (100) Occlusion pressure (mm Hg), Mean (SD) 366 (20) 386 (63) 0.14
Table 2. Blood flow occlusion in the Layperson Audiovisual Assist Tourniquet vs the Combat Appllcation Tourniquet.
LAVA TQ, Layperson Audiovisual Assist Tourniquet; CAT, Combat Application Tourniquet; mm Hg, millimeters of mercury.
Blood Vessel Occlusion by the LAVA TQ Compared to the CAT: Randomized Controlled Trial Goolsby et al. flow has been validated previously.10,11 Since all blood flow was occluded in both the experimental and control study arms, there is little reason to suspect bias from the blinded observers. None of the study’s observers, participants, or medical professionals have any financial interest in the LAVA TQ.
Tourniquets are now widely recommended for use by the public as the first-line treatment for life-threatening extremity hemorrhage.5,12 While existing standard tourniquets can occlude blood flow, multiple studies have shown that laypersons have difficulty applying them if they have never been trained to apply a tourniquet, if they have not been trained within the prior several weeks, or if they do not have adjunctive aids to assist them.6,13-14 Since most people in the US will not receive ongoing or refresher STB training, finding alternative methods or devices to assist tourniquet application at the point of injury is essential. In fact, using audiovisual instructions to assist tourniquet application was one of the five original goals of the Stop the Bleed campaign.4 The LAVA TQ is the first device to bring this goal to reality, and this study demonstrates that it can accomplish its essential function of stopping blood flow on a human extremity.
While the difference in pressure applied to the limbs when applying either device was not statistically different in this study, other studies have demonstrated significantly higher application pressures for CAT.15 It is important to note that the pressures reported here are not necessarily the minimum pressure required to achieve occlusion (ie, the pressure above which there is an absence of arterial pulse). In this study, medical professionals used their judgment to assess adequate tightness but were not reacting to patient parameters such as ongoing bleeding. It is possible that the measured pressure differences were similar in part because the medical professionals were familiar with the CAT application and applied a similar tightness with the LAVA TQ. It is expected that the greater strap width in the LAVA TQ compared to the CAT will occlude arterial flow at lower application pressures, which might reduce the possibility of nerve injury or other damage compared to traditional windlass-rod designs. Additionally, the LAVA TQ design allows for pressure increase in smaller increments than the CAT, further reducing the risk of over-tightening.
LIMITATIONS
This study has limitations. These tourniquet applications were performed in a laboratory setting, and findings could vary with actual injury. The study does not assess durability factors or usability for either device. Trained professionals applied the devices in this study, rather than the lay public who may use the LAVA TQ eventually. We used professionals to ensure that we could attribute an inability of either device to occlude blood flow to device design, rather than human application error. The neonatal blood pressure cuff measuring system has been described previously but has limitations.15 The use of air in the measurement cuffs, rather than an
incompressible liquid, could cause some variation from the actual pressures applied due to cuff deformation or air leakage. We anticipate that any errors due to cuff performance would affect the LAVA TQ and CAT equally, but this is not certain. Tourniquet application is a painful procedure. We did not survey the participants specifically about application pain of the two tourniquets. However, multiple participants remarked spontaneously to the study team that the LAVA TQ was less painful than the CAT. This is likely due to the wider strap on the LAVA TQ compared to the CAT; this could be a useful area for future investigation.
CONCLUSION
The novel Layperson Audiovisual Assist Tourniquet is non-inferior to the traditional windlass-rod Combat Application Tourniquet in occluding blood flow in human legs when applied by a trained medical professional. The surface application pressure of LAVA TQ is similar to that of the CAT in healthy volunteer study subjects. The findings of this study confirm that the LAVA TQ is an acceptable alternative limb tourniquet for occluding blood flow. Study of the LAVA TQ’s performance in real-world bleeding situations is warranted.
ACKNOWLEDGMENTS
The authors wish to thank Raphaelle Rodzik and Victoria Klimczak of the National Center for Disaster Medicine and Public Health for their assistance with data collection and study execution; HaoPing Chai, David Karasz, Ian McCullough, and Hannah Stewart of Uniformed Services University for their assistance with planning, participant recruitment, and data collection; and James Murphy of InnoVital, Inc. for device design and preparation work.
Address for Correspondence: Craig Goolsby, MD, MEd, MHCDS, Department of Emergency Medicine, Harbor-UCLA Medical Center, 1000 W Carson Street, Bldg N14, Torrance, CA 90502. Email: cgoolsby@dhs.lacounty.gov
Conflicts of Interest: By the WestJEM article submission agreement, all authors are required to disclose all affiliations, funding sources and financial or management relationships that could be perceived as potential sources of bias. This study was funded by the Defense Health Agency’s Transforming Technology for the Warfighter grant [NM91959717] via the Uniformed Services University’s National Center for Disaster Medicine and Public Health. Drs. Goolsby and Kothera declare that they have a provisional patent pending for LAVA TQ.
Copyright: © 2023 Goolsby et al. This is an open access article distributed in accordance with the terms of the Creative Commons Attribution (CC BY 4.0) License. See: http://creativecommons.org/ licenses/by/4.0/
REFERENCES
1. Blackbourne LH, Baer DG, Eastridge BJ, et al. Military medical revolution: prehospital combat casualty care. J Trauma Acute Care
Western Journal of Emergency Medicine 570 Volume 24, NO.3: May 2023
Goolsby et al. Blood Vessel Occlusion by the LAVA TQ Compared to the CAT: Randomized Controlled Trial Surg. 2012;73(6 Suppl 5):S372-7.
2. Scerbo MH, Holcomb JB, Taub E, et al. The trauma center is too late: Major limb trauma without a pre-hospital tourniquet has increased death from hemorrhagic shock. J Trauma Acute Care Surg 2017;83(6):1165-72.
3. Rasmussen TE, Baer DG, Goolsby C. The giving back: battlefield lesson to national preparedness. J Trauma Acute Care Surg 2016;80(1):166-7.
4. JEMS Staff. What the White House’s Stop the Bleed campaign means for EMS. Available at: http://www.jems.com/articles/print/ volume-41/issue-40/special-focus-gearing-up-for-active-shootertactical-high-threat-incidents/what-the-white-house-s-stop-the-bleedcampaign-means-for-ems.html. Accessed July 28, 2022
5. Pellegrino JL, Charlton NP, Carlson JN, et al. 2020 American Heart Association and American Red Cross Focused Update for First Aid. Circulation. 2020;142(17):e287-e303.
6. Goolsby C, Branting A, Chen E, et al. Just-in-time to save lives: a pilot study of layperson tourniquet application. Acad Emerg Med 2015;22(9):1113-7.
7. Goralnick E, Chaudhary MA, McCarty JC, et al. Effectiveness of instructional interventions for hemorrhage control readiness for laypersons in the Public Access and Tourniquet Training Study (PATTS): a randomized clinical trial. JAMA Surgery 2018;153(9):791-9.
8. Ross EM, Mapp JG, Redman TT, et al. The tourniquet gap: a pilot study of the intuitive placement of three tourniquet types by laypersons. J Emerg Med. Mar 2018;54(3):307-14.
9. Goolsby C, Jonson CO, Goralnick E, et al. The untrained public’s ability to apply the Layperson Audiovisual Assist Tourniquet vs a Combat Application Tourniquet: a randomized controlled trial. J Am Coll Surg. 2022;236(1):178-186.
10. Laurentino GC, Loenneke JP, Mouser JG, et al. Validity of the handheld Doppler to determine lower-limb blood flow restriction pressure for exercise protocols. J Strength Cond Res 2020;34(9):2693-6.
11. Swan KG Jr, Wright DS, Barbagiovanni SS, et al. Tourniquets revisited. J Trauma. 2009;66(3):672-5.
12. Singletary EM, Zideman DA, Bendall JC, et al. 2020 International Consensus on First Aid Science with Treatment Recommendations. Resuscitation. 2020;156:A240-a282.
13. Goolsby C, Chen E, Branting A, et al. Analysis of layperson tourniquet application using a novel color-coded device. Disaster Med Public Health Prep. 2016;10(2):274-80.
14. Goolsby C, Rojas LE, Rodzik RH, et al. High-school students can stop the bleed: a randomized, controlled educational trial. Acad Pediatr. 2020.
15. Wall PL, Duevel DC, Hassan MB, et al. Tourniquets and occlusion: the pressure of design. Mil Med. 2013;178(5):578-87.
Volume 24, NO.3: May 2023 571 Western Journal of Emergency Medicine
Socioeconomic Risk Factors for Pediatric Out-of-hospital Cardiac Arrest: A Statewide Analysis
Calvin Lukas Kienbacher, MD, PhD*†
Guixing Wei, PhD‡
Jason Rhodes, MPA§
Harald Herkner, MD, MSc†
Kenneth A. Williams, MD*§
The Warren Alpert Medical School of Brown University, Division of Emergency Medical Services, Department of Emergency Medicine, Providence, Rhode Island
Medical University of Vienna, Department of Emergency Medicine, Vienna, Austria
Brown University, Population Studies and Training Center, Spatial Structures in the Social Sciences (S4), Providence, Rhode Island
Rhode Island Department of Health, Center for Emergency Medical Services, Providence, Rhode Island
Section Editor: Muhammad Waseem, MD
Submission history: Submitted October 6, 2022; Revision received January 17, 2023; Accepted February 2, 2023
Electronically published April 28, 2023
Full text available through open access at http://escholarship.org/uc/uciem_westjem
DOI: 10.5811/westjem.59107
Introduction: Economic hardship is a major threat to children’s health, implying that pediatric outof-hospital cardiac arrest (pOHCA) might be promoted by lower incomes and child poverty. To target resources, it is helpful to identify geographical hotspots. Rhode Island is the smallest state by area in the United States of America. It has one million inhabitants and is comparable to many larger cities worldwide. We aimed to investigate the possible associations of pOHCA with economic factors and the coronavirus 2019 (COVID-19) pandemic. Our goal was to identify high-risk areas and evaluate whether the COVID-19 pandemic had an influence on delays in prehospital care.
Methods: We analyzed all pOHCA cases (patients <18 years of age) in Rhode Island between March 1, 2018–February 28, 2022. We performed Poisson regression with pOHCA as dependent and economic risk factors (median household income [MHI] and child poverty rate from the US Census Bureau) as well as the COVID-19 pandemic as independent variables. Hotspots were identified using local indicators of spatial association (LISA) statistics. We used linear regression to assess the association of emergency nedical services-related times with economic risk factors and COVID-19.
Results: A total of 51 cases met our inclusion criteria. Lower MHIs (incidence-rate ratio [IRR]) 0.99 per $1,000 MHI; P=0.01) and higher child poverty rates (IRR 1.02 per percent; P=0.02) were significantly associated with higher numbers of ambulance calls due to pOHCA. The pandemic did not have a significant influence (IRR 1.1; P=0.7). LISA identified 12 census tracts as hotspots (P<0.01). The pandemic was not associated with delays in prehospital care.
Conclusion: Lower median household income and higher child poverty rate are associated with higher numbers of pediatric out-of-hospital cardiac arrest. [West J Emerg Med. 2023;24(3)572–578.]
INTRODUCTION
Children are among the most vulnerable populations in healthcare. Economic hardship has a significant burden on
their well-being. The United Nations International Children’s Emergency Fund estimates that about a billion children live in poverty around the world.1 Their risk of dying during
Western Journal of Emergency Medicine 572 Volume 24, NO.3: May 2023 * † ‡ § Original Research
childhood is twice as high compared to individuals raised under economically stable conditions.1 In the United States of America (US), up to 20% of children are considered to be poor, which makes them one of the largest groups of destitute people in the country.2 The ongoing coronavirus 2019 (COVID-19) pandemic has further aggravated these issues globally.3
The American Academy of Pediatrics (AAP) defines children as individuals <18 years of age.4 Pediatric outof-hospital cardiac arrest (pOHCA) is an infrequently encountered condition by emergency medical services (EMS).5, 6 An efficient rescue chain including prompt recognition of the condition, Basic Life Support instructions for bystanders prior to the arrival of EMS, proper training, and equipment for the EMS professionals are the cornerstones to improve outcomes, which nevertheless remain poor.5, 7, 8 To target resources, it might be useful for EMS personnel to know areas with higher likelihoods of encountering pOHCA. Identifying structural risk factors within society, such as economic hardship, might be of value for healthcare policymakers. Interventions, including first-aid training, community automatic defibrillator deployment, and prevention efforts may be of higher value in communities with higher prevalence.9
Rhode Island has approximately one million inhabitants and is the smallest state in the US by area. Its demographics and household economic status are near the national average.10 The US Census Bureau publishes the respective data on a census-tract basis (ie, small geographical areas with similar numbers of inhabitants).11 Rhode Island’s overall population density, with suburban and rural areas surrounding the densely populated urban area of the capital, Providence, makes it well comparable to many major cities worldwide. The state’s EMS system includes many different agencies but is regulated by the state Department of Health, which implies mandatory statewide EMS protocols and data reporting. All ambulance agency patient records are automatically uploaded into two databases, a biospatial platform and an EMS data capture tool (ImageTrend Elite, Lakeville, MN), where they are stored under the standardized paradigms of the National EMS Information System.12, 13 This comprises clinical and geospatial information on 911 emergency calls.
Geospatial data can be analyzed using various approaches. These include non-spatial methodology, such as linear and Poisson regression models, and methods of geospatial statistics. One of the latter techniques is the local indicators of spatial association (LISA) test, which focuses on reviewing geographical areas (eg, census tracts) in the context of their surroundings regarding a characteristic (eg, rate of EMS calls).14 It allows identification of clusters with similar properties or outliers with dissimilar properties in immediate neighborhoods. The global Moran’s I is another geospatial test, which facilitates the detection of
Population Health Research Capsule
What do we already know about this issue? Pediatric out-of-hospital cardiac arrest (pOHCA) is a rare but important condition in emergency medicine. Children’s health is associated with socioeconomic status.
What was the research question? Is there an association between median household income and the occurrence of pOHCA?
What was the major finding of the study? Lower median household income and higher child poverty rates are associated with higher numbers of pOHCA (1% per 1,000$ change; P=0.01).
How does this improve population health? Interventions focusing on areas with lower household incomes might help to improve patient care and the prevention of pOHCA.
geographical patterns over the entire map of interest.15 Similar methods have been used in the past to examine the geospatial properties of adult OHCA.16-18
We aimed to investigate whether there is an association between a census tract’s median household income (MHI), child poverty rate, and the occurrence of pOHCA over a fouryear observation period that included two years prior to the COVID-19 outbreak and the first two years of the pandemic. Furthermore, we aimed to elaborate on whether the pandemic was associated with any EMS-related delays of patient care. To our knowledge, no study has yet investigated these issues using a comprehensive, statewide dataset.
METHODS
We conducted a retrospective analysis of all ambulance calls for pOHCA in the state of Rhode Island between March 1, 2018–February 28, 2022. Subjects had to be <18 years of age, according to the AAP’s definition of childhood. 4 The study period corresponds to equal intervals before (March 1, 2018–February 29, 2020) and after (March 1, 2020–February 28, 2022) the beginning of the COVID-19 pandemic.
Records of non-primary responses (eg, interfacility transfers) and mass casualty incidents were excluded. We extracted the patients’ demographics (gender and age) and
Volume 24, NO.3: May 2023 573 Western Journal of Emergency Medicine Kienbacher et al. Socioeconomic Risk Factors for pOHCA: A Statewide Analysis
Socioeconomic Risk Factors for pOHCA: A Statewide Analysis
EMS-related information (geo-coordinates, mission times, clinical data, and the patient report narrative) from the biospatial and EMS data capture platforms. The datasets from these two sources were merged in Microsoft Excel 16.62 (Microsoft Corporation, Redmond, WA) based on the patient-care report number, a unique identifier. All patient care reports including their narratives were manually reviewed by a board-certified EMS physician, who is also a licensed paramedic.
The census tracts’ most recent year (2020) shapefiles, demographic (population <18 years and poverty rates), and economic (median household income [MHI]) information were downloaded from the website of the US Census Bureau.19, 20 We excluded census tracts without any inhabitants <18 years of age (ie, no population at risk, such as water areas, of which there are four). Another two census tracts, which are inhabited but isolated islands, were excluded from geospatial analysis only, as they do not have any adjacent neighbors according to our definition (identifiers of census tracts comprising water: 44005990000, 44009990100, 44009990200; islands: 44005041300, 44009041500). The Providence Airport census tract (identifier 44003980000) was merged with one of its neighbors (identifier 44003021902) for geospatial analysis only, as it doesn’t have any sociodemographic attributes.
The data was imported into ArcGIS Pro 2.9.3 (Esri Corporation, Redlands, CA). All pOHCA cases were assigned to census tracts by their geocoordinates. We calculated rates (ie, the number of pOHCA cases over the four-year observation period divided by the population <18 years of age) for all census tracts and the state of Rhode Island. We investigated differences in MHI, measured in 2020 inflation-adjusted US dollars ($), using a Poisson regression model with the number of pOHCA cases as the dependent and the economic risk factors MHI and child poverty rate, as well as the period of the pandemic, as independent variables. We used the poisson command in Stata 17MP (StataCorp, LLC, College Station, TX), with the exposure option to control for the census tracts’ individual population size. We used the vce [cluster clustvar] option to link census tracts by their geographic identifiers, thereby allowing us to include COVID-19 (before pandemic and pandemic phase) as a variable into the model. Results are presented as incidence-rate ratios (IRR) with their corresponding 95% confidence intervals and P-values. We controlled for the population at risk.
We calculated Global Moran’s I statistics across all eligible census tracts. LISA statistics regarding the pOHCA rate of each census tract were calculated using a rowstandardized, with 499 permutations.21 We used the spatial contiguity Queen criterion (sharing common edges and/ or corners) to define the neighbor relationship. Results are presented graphically on a map.
We defined EMS times as follows:
• Response time: from unit dispatched to arrival at the patient
• On-scene time: from arrival at the patient to leaving the scene
• Transport time: from leaving the scene to arrival at the destination
• Back-to-service time: from patient arriving at destination to unit back to service
• Overall mission time: from dispatch to unit back in service.
Time values of zero were excluded. We calculated differences in medians between before and after the beginning of the COVID-19 pandemic and their corresponding 95% CIs, using quantile regression in Stata 17MP. We used linear regression models with the respective times as the dependent variables. Census tracts neighborhood hotspots (ie, high-low outliers identified by LISA) and the economic risk factors served as independent variables. A two-sided P-value ≤0.05 was considered to be statistically significant.
As data on the geospatial distribution of EMS calls for pOHCA is sparse, we could not perform a formal a priori sample-size calculation. We therefore chose to include all cases within the observation period into our study. The Ethics Committee of the Rhode Island Department of Health approved the study protocol with an exemption from full review (vote #2022-01). Our study was conducted following the principles of the Declaration of Helsinki.
RESULTS
A total of 51 emergency calls, of which 24 were for females (47%) met our inclusion criteria. Twenty-four cases (47%) occurred before and 27 (53%) after the beginning of the COVID-19 pandemic. The median age of the study population was two years (interquartile range [IQR] 0-13). Table 1 provides the baseline characteristics of the study population.
The associated median MHI was $62,589 (IQR 39,754$75,591) and the median child poverty rate 22.1% (IQR 4.9-32.9%). The statewide averages were $71,166 (IQR $51,349-90,795) and 8.8% (IQR 1.4- 23.1%), respectively. We identified four census tracts without any population <18 years of age. In 45 census tracts, pOHCA rates ranged from 6-30 per Pediatric out-of-hospital cardiac arrest cases (N=51)
Female, n (%) 24 (47)
Age, years, median (IQR) 2 (0 to 13)
Before COVID-19, n (%) 24 (47)
Shockable rhythm, n (%) 6 (12)
Biological death on arrival of EMS, n (%) 4 (8)
Western Journal of Emergency Medicine 574 Volume 24, NO.3: May 2023
Kienbacher et al.
Table 1. Baseline characteristics of the study population. IQR, interquartile range; COVID-19, coronavirus 2019; EMS, emergency medical services.
10,000 children. All other census tracts (201) did not observe any cases of pOHCA. We found an overall rate of pOHCA of 1 per 4,000 individuals <18 years of age over the four-year observation period in Rhode Island.
Our Poisson regression analysis showed that lower MHI was associated with higher numbers of pOHCA (IRR 0.99, 95% CI 0.976-0.997), for every $1,000 change in MHI; P=0.01). The same applied to higher child poverty rates (IRR 1.02, 95% CI 1.004-1.03], for every percentage change in child poverty rate; P=0.02) (see Figure 1). The pandemic had no significant association with the occurrence of pOHCA (IRR 1.1, 95% CI 0.6-2; P=0.7).
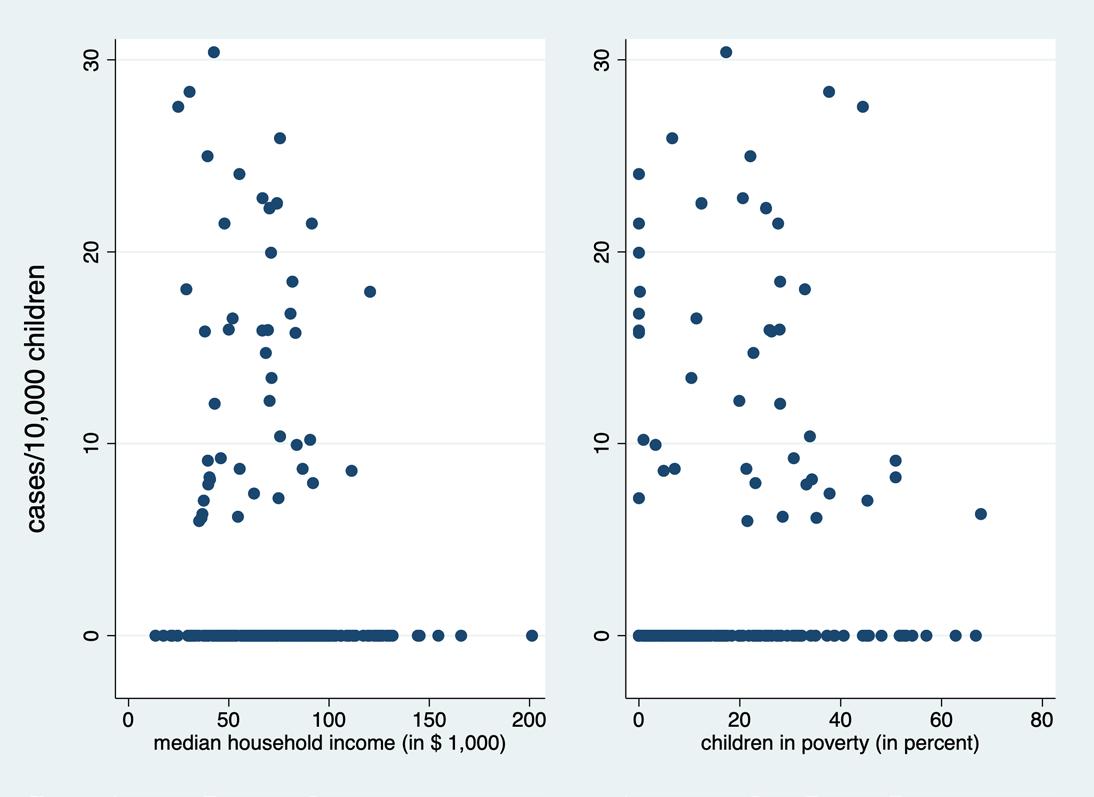
No cases were lost by excluding six census tracts due to their geographical properties. In the 244 census tracts included for geospatial analysis, Global Moran’s I statistics showed a random spatial pattern of pOHCA rates across Rhode Island over the four-year observation period (z-score= -0.08, P=0.93). Focusing on immediate neighborhoods, LISA analysis revealed that 12 census tracts were significant highlow outliers (P<0.01), ie, community hotspots with high rates, surrounded by census tracts with relatively low rates. No low-high outliers, high-high, or low-low clusters were identified (Figure 2). The high-low clusters were concentrated in the northern parts of Rhode Island. This includes the less wealthy regions of the greater city area of Providence, in the northeast, and suburban Kent County in the northwest. The wealthier Newport and Washington counties in the southeast and southwest had cases of pOHCA but hardly any clusters in immediate neighborhoods.

Regarding EMS times, one case (search for a missing child) was excluded from the analysis. In the remaining 50 missions, we did not find any significant differences between
the time periods before and since the beginning of the COVID-19 pandemic in response (median difference 0, 95% CI -1-2 minutes), on-scene (median difference -2, 95% CI -13-9 minutes), transport (median difference -2, 95% CI -6-2 minutes), back-to-service (median difference -4, 95% CI -2921 minutes), or overall mission time (median difference -9, 95% CI -40-21 minutes). Table 2 summarizes our secondary findings. The transport time was log transformed to better fit the linear regression model. Higher MHI was associated with longer transport times (coefficient 0.01, 95% CI 0.0030.019), for every $1,000 change) and higher child poverty rates (coefficient -0.01, 95% CI -0.024- -0.002], for every percentage change) were associated with shorter transport times. The EMS times were not altered by census tracts being community hotspots.
DISCUSSION
Our findings indicate that pOHCA might more frequently occur in census tracts with lower MHI and higher child poverty rates. While the overall distribution of cases follows a random geographical pattern, we were able to identify hotspots on the community level using geospatial analysis techniques. These also concentrate around the less wealthy neighborhoods.
Strengths of our study include the analysis of comprehensive, statewide data over a four-year observation period by a multidisciplinary team. The analyses were conducted by experts in the field and controlled for the population at risk. Furthermore, we are confident that Rhode Island is a good model region for our analyses due to its sociodemographic profile. We did not limit our research
Volume 24, NO.3: May 2023 575 Western Journal of Emergency Medicine Kienbacher et al.
A Statewide Analysis
Socioeconomic Risk Factors for pOHCA:
Figure 1. Association between the rate of pediatric out-of-hospital cardiac arrest, median household income of the prior 12 months in 2020 United States dollars, and child poverty.
Figure 2. High-low outlier census tracts (red) in respect of the rate of pediatric out-of-hospital cardiac arrest in Rhode Island, arrow indicates north. N, north.
question to the whole state; rather, we also took into account differences of immediate neighborhoods. These include urban and suburban areas, which many cities worldwide have.
Most of the previouly published literature on the investigation of socioeconomic risk factors and OHCA focuses on adults. Prior research strongly supports the concept that a higher socioeconomic status is protective in this context, with the outcome being survival.22, 23 Data on the situation in children is still sparse. One trial examined the influence of parental socioeconomic status on the survival of pOHCA, indicating that higher household income and education increase the chances of survival.24 Our findings are also well compatible with those of Salmi et al, who found that children living in poorer economic areas are in general more likely to be encountered by EMS than those living in wealthier areas.25 However, their study includes many disease entities, not solely cardiac arrest.
A few studies aimed to identify geographical hotspots of OHCA using similar means of geospatial statistics. Those studies focused on adults on a census-tract level and show feasibility of the methodology in this context.16-18 Wong et al included cases of pOHCA but provided no subgroup analysis for the pediatric population.26 Our results are consistent with those of Sasson and colleagues, who also found that areas with higher numbers of OHCA tend to have lower household incomes.17 Targeted interventions, including the education of potential bystanders, public access defibrillators and naloxone boxes might improve the care of patients in high-risk areas. Enhancing the economic situation in less wealthy regions, eg, by subsidies and support for unemployed parents, might help to prevent the condition in the first place. Furthermore, broad insurance coverage for regular health care checks for all children would be desirable to detect chronic medical conditions, which increase the risk of early pOHCA.
Interestingly, we did not find any differences in EMS times between the periods before and since the beginning of the COVID-19 pandemic. Contrarily, prior data indicates that on-
scene times might be longer since its onset.27 However, those authors looked at all ambulance missions with lights and sirens, not solely at cardiac arrest, in which the treatment algorithms are well standardized.27 Other factors might be system- specific, such as how long it takes to find the right destination for the individual patient before initiating transport.
Prior research also shows that respiratory issues are the most common reason for cardiac arrest in children, with primary heart problems being rare.7 Noteworthy, shockable rhythms were more common in our population (12%) than expected. The reasons for this discrepancy between the literature and our data remain unclear. Screening of the patient-care report narratives revealed no clearly documented reasons for the cardiac arrest in most of our cases.
LIMITATIONS
Our study has limitations. We used the medians of the 2020 median household incomes of the census tracts as an economic risk factor. This seemed the most appropriate strategy to us, as individual earnings remain unknown. One must, therefore, bear in mind that a census tract’s MHI might differ from that of the family of an individual case. The same applies to the child poverty rate. However, our approach to use census tract-level data is consistent with previously published research and has also been used in the field of cardiovascular medicine.28-31 Furthermore, we took the most recently available (2020) five-year census data as the basis for our calculations. This information might not necessarily reflect the economic situation before or after this year. We believe that incorporating both MHI and the child poverty rate into our model increases the interpretability of the findings.
CONCLUSION
Our results indicate that EMS crews serving the population of less wealthy census tracts might be more likely to face pediatric out-of-hospital cardiac arrest. This finding could have implications for targeted professional and
Western Journal of Emergency Medicine 576 Volume 24, NO.3: May 2023 Socioeconomic Risk Factors for pOHCA: A Statewide Analysis Kienbacher et al. Overall Before pandemic (n=24) Since pandemic (n=27) Before vs since pandemic, median [95% CI] Response time, minutes, median (IQR), n=49 5 (4 to 6) 5 (4 to 7) 4 (3 to 5) 0 [-1, 2] On-scene time, minutes, median (IQR), n=47 14 (7 to 28) 13 (7 to 24) 16 (8 to 30) -2 [-13, 9] Transport time, minutes, median (IQR), n=46 8 (5 to 11) 7 (5 to 10) 9 (6 to 11) -2 [-6, 2] Back-to-service time, minutes, median (IQR), n=46 63 (46 to 83) 60 (40 to 78) 64 (53 to 85) -4 [-29, 21] Overall mission time, minutes, median (IQR), n=50 91 (67 to 121) 83 (55 to 105) 92 (76 to 127) -9 [-40, 21] Table
IQR, interquartile range.
2. Emergency medical service-related times before and since the beginning of the COVID-19 pandemic.
bystanders’ training, as well as community interventions. Prevention strategies might include regular healthcare checks in children and approaches to enhance the economic situation of a region, eg, with subsidy programs. Data on the topic is still scarce.
Address for Correspondence: Prof. Harald Herkner, MD, MSc Medical University of Vienna, Department of Emergency Medicine Währinger Gürtel 18-20 1090 Vienna, Austria. Email: harald. herkner@meduniwien.ac.at
Conflicts of Interest: By the WestJEM article submission agreement, all authors are required to disclose all affiliations, funding sources and financial or management relationships that could be perceived as potential sources of bias. No author has professional or financial relationships with any companies that are relevant to this study. There are no conflicts of interest or sources of funding to declare.
Copyright: © 2023 Kienbacher et al. This is an open access article distributed in accordance with the terms of the Creative Commons Attribution (CC BY 4.0) License. See: http://creativecommons.org/ licenses/by/4.0/
9. Sasson C, Keirns CC, Smith D, et al. Small area variations in out-ofhospital cardiac arrest: Does the neighborhood matter? Ann Intern Med. 2010;153(1):19-22.
10. United States Census Bureau. QuickFacts Rhode Island. Available at: https://www.census.gov/quickfacts/fact/dashboard/RI/ INC110219#INC110219. Accessed May 7, 2021.
11. United States Census Bureau. Glossary. Available at: https://www. census.gov/programs-surveys/geography/about/glossary.html#par_ textimage_13. Accessed July 11, 2022.
12. National Emergency Medical Services Information System (NEMSIS). What is NEMSIS. Available at: https://nemsis.org/what-is-nemsis/. Accessed February 20, 2021.
13. NEMSIS. NEMSIS Data Dictionary. NHTSA v3.4.0. Build 200910. EMS Data Standard. 2020.
14. Anselin L. Local indicators of spatial association—LISA. Geogr Anal 1995;27(2):93-115.
15. Li H, Calder CA, Cressie N. Beyond Moran’s I: testing for spatial dependence based on the spatial autoregressive model. Geogr Anal 2007;39(4):357-75.
16. Nassel AF, Root ED, Haukoos JS, et al. Multiple cluster analysis for the identification of high-risk census tracts for out-of-hospital cardiac arrest (OHCA) in Denver, Colorado. Resuscitation 2014;85(12):1667-73.
REFERENCES
1. United Nations International Children’s Emergency Fund. Child Poverty. Available at: https://www.unicef.org/social-policy/childpoverty. Accessed June 28, 2022.
2. Shrider EA, Kollar M, Chen F, et al. Income and Poverty in the United States: 2020. U.S. Census Bureau. U.S. Department of Commerce. Available at: https://www.census.gov/content/dam/Census/library/ publications/2021/demo/p60-273.pdf. Accessed July 28, 2022.
3. United Nations International Children’s Emergency Fund. Children in monetary-poor households: COVID-19’s invisible victims. Available at: https://blogs.unicef.org/evidence-for-action/children-in-monetarypoor-households-covid-19s-invisible-victims/. Accessed June 28, 2022.
4. American Academy of Pediatrics. Ages & Stages. Available at: https:// www.healthychildren.org/English/ages-stages/Pages/default.aspx. Accessed July 8, 2022.
5. Law AK-K, Ng M-H, Hon K-L, et al. Out-of-hospital cardiac arrest in the pediatric population in Hong Kong: a 10-year review at a university hospital. Pediatr Emerg Care. 2018;34(3):179-84.
6. Lee J, Yang W-C, Lee E-P, et al. Clinical survey and predictors of outcomes of pediatric out-of-hospital cardiac arrest admitted to the emergency department. Sci Rep. 2019;9(1):7032.
7. Topjian AA, Raymond TT, Atkins D, et al. Part 4: Pediatric Basic and Advanced Life Support: 2020 American Heart Association Guidelines for Cardiopulmonary Resuscitation and Emergency Cardiovascular Care. Circulation. 2020;142(16_suppl_2):S469-S523.
8. Van de Voorde P, Turner NM, Djakow J, et al. European Resuscitation Council Guidelines 2021: Paediatric Life Support. Resuscitation. 2021;161:327-87.
17. Sasson C, Cudnik MT, Nassel A, et al. Identifying high-risk geographic areas for cardiac arrest using three methods for cluster analysis. Acad Emerg Med. 2012;19(2):139-46.
18. Lerner EB, Fairbanks RJ, Shah MN. Identification of out-of-hospital cardiac arrest clusters using a geographic information system. Acad Emerg Med. 2005;12(1):81-4.
19. United States Census Bureau. TIGER/Line Shapefiles. Available at: https://www.census.gov/geographies/mapping-files/2020/geo/tigerline-file.html. Accessed June 28, 2022.
20. United States Census Bureau. Explore census data. Advanced search. Available at: https://data.census.gov/cedsci/advanced. Accessed June 28, 2022.
21. esri. ArcGIS Pro. Modeling spatial relationships. Available at: https:// pro.arcgis.com/en/pro-app/latest/tool-reference/spatial-statistics/ modeling-spatial-relationships.htm#GUID-DB9C20A7-51DB-4704A0D7-1D4EA22C23A7. Accessed September 23, 2022.
22. Jonsson M, Härkönen J, Ljungman P, et al. Inequalities in income and education are associated with survival differences after out-ofhospital cardiac arrest: nationwide observational study. Circulation 2021;144(24):1915-25.
23. van Nieuwenhuizen BP, Oving I, Kunst AE, et al. Socio-economic differences in incidence, bystander cardiopulmonary resuscitation and survival from out-of-hospital cardiac arrest: a systematic review. Resuscitation. 2019;141:44-62.
24. Rajan S, Wissenberg M, Folke F, et al. Out-of-hospital cardiac arrests in children and adolescents: Incidences, outcomes, and household socioeconomic status. Resuscitation. 2015;88:12-19.
25. Salmi H, Kuisma M, Rahiala E, et al. Children in disadvantaged neighbourhoods have more out-of-hospital emergencies: a
Volume 24, NO.3: May 2023 577 Western Journal of Emergency Medicine Kienbacher
et al.
Socioeconomic Risk Factors for pOHCA: A Statewide Analysis
Socioeconomic Risk Factors for pOHCA: A Statewide Analysis
population-based study. Arch Dis Child. 2018;103(11):1048-53.
26. Wong PP, Low CT, Cai W, et al. A spatiotemporal data mining study to identify high-risk neighborhoods for out-of-hospital cardiac arrest (OHCA) incidents. Sci Rep. 2022;12(1):3509.
27. Eskol JR, Zegers FD, Wittrock D, et al. Increased ambulance onscene times but unaffected response times during the first wave of the COVID-19 pandemic in Southern Denmark. BMC Emerg Med 2022;22(1):61.
28. Rabi DM, Edwards AL, Svenson LW, et al. Association of median household income with burden of coronary artery disease among individuals with diabetes. Circ Cardiovasc Qual Outcomes
2010;3(1):48-53.
29. Winkleby MA, Cubbin C. Influence of individual and neighbourhood socioeconomic status on mortality among Black, Mexican-American, and White women and men in the United States. J Epidemiol Community Health. 2003;57(6):444-52.
30. Thomas AJ, Eberly LE, Davey Smith G, et al. ZIP-code-based versus tract-based income measures as long-term risk-adjusted mortality predictors. Am J Epidemiol. 2006;164(6):586-90.
31. Parolin Z, Curran M, Matsudaira J, et al. Estimating monthly poverty rates in the United States. J Policy Anal Manage. 2022;41(4):1177203.
Western Journal of Emergency Medicine 578 Volume 24, NO.3: May 2023
Kienbacher et al.
Pediatric Application of Cuffed Endotracheal Tube
Jung Heon Kim, MD*
Jung Hwan Ahn, MD*
Yun Jeong Chae, MD, PhD†
Section Editor: Cristina M. Zeretzke-Bien, MD
Ajou University School of Medicine, Department of Emergency Medicine, Suwon, Korea
Ajou University School of Medicine, Department of Anesthesiology, Suwon, Korea
Submission history: Submitted December 8, 2022; Revision received February 18, 2023; Accepted February 18, 2023
Electronically published April 28, 2023
Full text available through open access at http://escholarship.org/uc/uciem_westjem
DOI: 10.5811/westjem.59560
A young child’s larynx was formerly believed to be narrowest at the cricoid level, circular in section, and funnel shaped. This supported the routine use of uncuffed endotracheal tubes (ETTs) in young children despite the benefits of cuffed ETTs, such as lower risk for air leakage and aspiration. In the late 1990s, evidence supporting the pediatric use of cuffed tubes emerged largely from anesthesiology studies, while some technical flaws of the tubes remained a concern. Since the 2000s, imaging-based studies have clarified laryngeal anatomy, revealing that it is narrowest at the glottis, elliptical in section, and cylindrical in shape. The update was contemporaneous with technical advances in the design, size, and material of cuffed tubes. The American Heart Association currently recommends the pediatric use of cuffed tubes. In this review, we present the rationale for using cuffed ETTs in young children based on our updated knowledge of pediatric anatomy and technical advances. [West J Emerg Med. 2023;24(3)579–587.]
INTRODUCTION
The larynx of children younger than the age of eight (hereafter, “young children”) was thought to be narrowest at the cricoid level, circular in axial section, and funnel shaped. Thus, it was believed that the cricoid level was snugly fit by an uncuffed endotracheal tube (ETT) large enough to allow some air leakage around the tube at 20 centimeters of water (cmH2O) airway pressure (Figure 1A). In contrast, cuffed tubes incurred concerns of cuff-induced pressure exertion on the cricoid mucosa (Figure 1B), which can manifest as post-extubation stridor (PES) and potentially lead to subglottic stenosis. From this perspective, use of uncuffed tubes had been routinely favored for use in young children.1-3
Since 2003, imaging-based studies have clarified that the pediatric larynx is narrowest at the glottis, elliptical in section, and cylindrical in shape, like an adult larynx. This updated anatomic consideration coincided with a shift from the use of uncuffed to cuffed ETTs by anesthesiologists, which had already been initiated in the late 1990s (Figure 1). Initially, this shift was supported by the emerging benefits of cuffed tubes, chiefly cuff-induced adjustable sealing, which has been shown to result in less frequent tube changes (Table 1).1, 2, 4-7 Moreover, the shift was reinforced by contemporaneous technical advances such as high volume-low pressure (HVLP)
polyurethane (PU) cuff.8 Currently, the American Heart Association (AHA) and the European Resuscitation Council recommend that young children be intubated with cuffed tubes.9,10
This topic has been discussed most commonly in the context of pediatric anesthesia or critical care.2, 11 However, there is a paucity of literature relevant to emergency department (ED) settings.12,13 This knowledge gap highlights the need to encourage the pediatric application of cuffed ETTs in ED practice. In this article, we review the literature addressing the use of cuffed tubes in young children based on the updated understanding of laryngeal anatomy and other rationales.
METHODS
We searched PubMed and Scopus for articles in English using the keywords “intubation,” “cuffed,” and “child,” which had been published from 1997–2022. Of the searched items, we preferentially selected systematic reviews, narrative reviews, original articles, and editorials that describe the pediatric application of cuffed ETTs. Given the paucity of literature relevant to emergency settings, we had to include many articles authored by anesthesiologists. However, we excluded articles not focused on the benefits of cuffed tubes
Volume 24, NO.3: May 2023 579 Western Journal of Emergency Medicine * † Review Article
(A
B)
glottis-elliptical-cylinder (C and D) laryngeal configuration. In addition, this schema depicts the myths 1 (A) and 2 (B) and recently discovered features (C and D). Each inset shows a transverse section with a tube shaft inserted at each level (marked in black). The cricoid cartilage is drawn as a blue-gray ring (insets in A and B) or V-shaped lamina (insets in C and D [upper]). B exemplifies an erroneously high cuff location caused by a Murphy eye (asterisks). C illustrates the posterolateral compression by the tube shaft. The compression is considered stronger than previously expected, given the shift in laryngeal configuration. C also shows that the tip of movable, uncuffed tube can injure the tracheal wall, which can be minimized by the added stability provided by a cuff. D depicts a high volume-low pressure cuff without a Murphy eye placed at an appropriate location, which results in stabilization of the tip by the cuff, less leak through the cuff, less pressure on the subglottis by the tube shaft (upper inset) and on the trachea by the cuff (lower inset). Airway injury may be further prevented by the posterior trachea, which distends when intracuff pressure increases. Numbers in millimeters indicate the inner diameters of the tubes.
or the updated knowledge of the laryngeal anatomy in young children. We added manually searched articles regarding the updated laryngeal anatomy, other articles, textbooks, and guidelines. In total, this narrative review covered 66 articles (Supplement Figure 1), including three systematic reviews, two guidelines, four textbooks, 13 narrative reviews, seven randomized controlled trials, 12 experimental studies, 14 observational studies, four surveys, five editorials, one letter, and one case report.
DISCUSSION
Updated Laryngeal Anatomy: From the Cricoid-CircularFunnel to the Glottis-Elliptical-Cylinder
The dogma of cricoid-circular-funnel shape was prevalent in pediatric practice due to a key article on infant laryngeal configuration that was based on autopsies showing the cricoid as the narrowest level in 15 children aged 4 months–14 years.14,15 A cadaveric glottis is more distensible than live human glottis owing to the laxity of devitalized tissue and the use of wax or plaster to fill up the larynx. In the autopsies,
the glottis was probably overestimated relative to the circumferentially fixed cricoid.
Imaging-based studies on 86‒401 live children have resulted in a revised understanding of pediatric laryngeal configuration from the cricoid-circular-funnel shape to the glottis-elliptical-cylinder shape (Table 2).16-20 The first refutation to the dogma came from Litman et al16 who measured laryngeal dimensions on magnetic resonance imaging. The measurement revealed a longer anteroposterior diameter than the transverse diameter (ie, elliptical), an increase in transverse diameter as we move caudad, and a linear association of age with the diameters at all levels. This means that the cylindrical larynx, with the glottis being the narrowest, grows proportionally without a configurational transition from the funnel to the cylinder. Subsequently, the implications have been confirmed by plain radiography, computed tomography (CT), and bronchoscopy.17-20 The CTbased studies proved differential sections per level: the more cephalad, the more elliptical (Figure 2).18-20
Holzki et al21,22 criticized the updated anatomy,
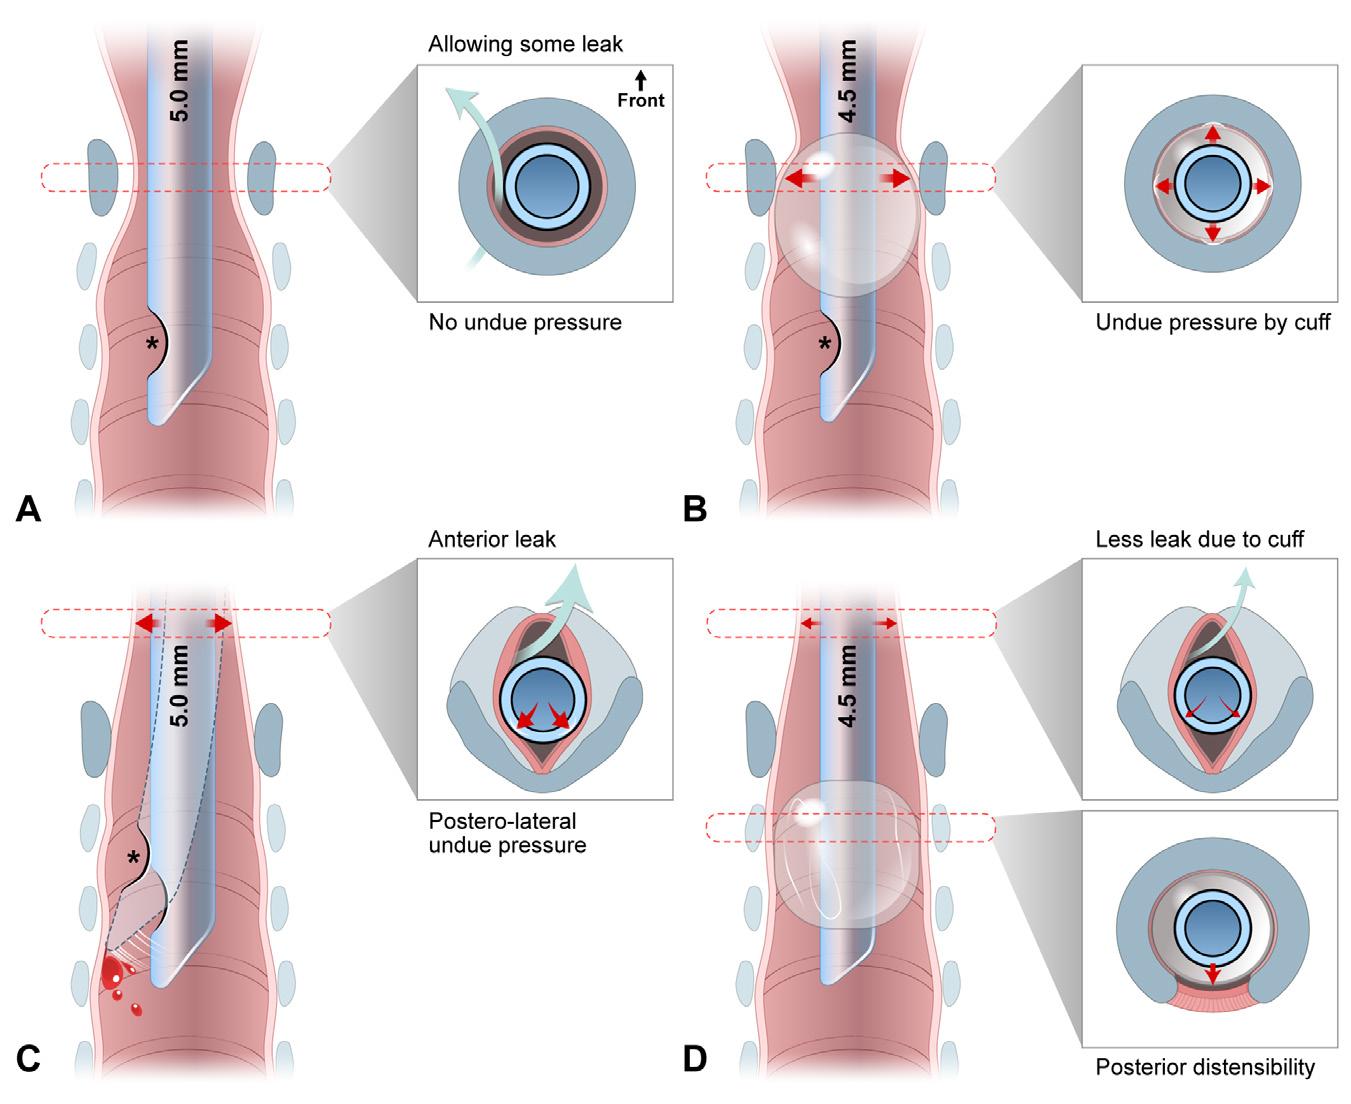
Western Journal of Emergency Medicine 580 Volume 24, NO.3: May 2023 Pediatric Application of Cuffed Endotracheal Tube Kim et al.
Figure 1. Schematic representation of shifts from uncuffed (A and C) to cuffed (B and D) endotracheal tubes, and from cricoid-circularfunnel
and
to
Table
Variable Feature*
Emerging benefits† Improved seal and less need for tube change
Remark
Cuff size is adjustable to variable tracheal sizes at same age Adjustable fit
Lower rate of oversized intubation
Similar incidence of severe injury (eg, PES) Cuffed, 2.4%–4.4% vs uncuffed, 3.0%–4.7%
Lower incidence of minor injury (eg, sore throat)‡
Tube shaft-induced posterolateral compression of the glottissubglottis
Cuff-induced separation of tube tip and the trachea prevents tracheal injury
Established benefits§
Less leakage
Less aspiration
More reliable delivery/monitoring of tidal volume/capnography
Less consumption of/pollution by anesthetics
Lower rate of ventilator-associated pneumonia
Limitations Need for intracuff pressure monitoring† Safe range: <20‒25 cmH2O (ideally, using cuff manometer)
0.5‒1.0 mL of air may be sufficient to inflate cuffs of 3.0‒5.0 mm ID tubes
Available down to size 3.0 mm ID
Higher airway resistance due to 0.5 mmsmaller ID
Higher cost
Still recommended to use uncuffed tubes in <3 kg neonates
Compensated by pressure-support ventilation
Difficult suctioning
Compensated by less need for tube change and more reliable ventilation
*Listed in the order of relevance in emergency settings, rather than of frequency.
†The benefits have become known since the mid-1990s. Although the benefits are of cuffed tubes per se, they have been reinforced, and a lower intracuff pressure is enabled by the use of high volume-low pressure, polyurethane cuffs.
‡Refer to Figure 1C.
§Known before the mid-1990s and thereafter, accumulation of relevant evidence. ID, inner diameter; PES, post-extubation stridor; cmH2O, centimeters of water; mL, milliliter; kg, kilogram; mm, millimeter.
Author Study design and setting Narrowest dimension
Litman et al (2003)16
Dalal et al (2009)17
Wani et al (2016)18
Mizuguchi et al (2019)19
Kim et al (2022)20
N = 99, 2 mo-13 y (mean, 61.6 mo), MRI under PSA, and 1 center in the United States
N = 128, 6 mo-13 y (mean, 70.8 mo), bronchoscopy under anesthesia/ paralysis, and 2 centers in the U.S.
N = 130, 1 mo-10 y (mean, 47.4 mo), CT under PSA, and 1 center in Saudi Arabia
N = 86, 1 mo-15 y (median, 53 mo), CT ± PSA, and 1 center in Japan
N = 401, 1 mo-4 y (median, 26.0 mo), plain radiography, and 1 center in Korea
AP-to-transverse ratio Association/correlation of diameter with age
Transverse glottic diameter* >1 at all levels† Linear association in all diameters at all levels
Transverse glottic diameter
CSA: 30.0 mm2 (glottis) vs. 48.9 mm2 (cricoid)
Transverse glottic diameter
CSA: 55.9 mm2 (subglottis) vs. 57.1 mm2 (cricoid)
Transverse subglottic diameter
Transverse glottic diameter*
CSA: 26.5 mm2 (glottis) vs. 40.5 mm2 (cricoid)
>1 at all levels† Linear association in CSA at all levels
1.2 at the subglottis‡
1.0 at the cricoid‡
1.5 at the subglottis§
1.1 at the cricoid§
2.9 at the glottis‡
1.1 at the cricoid‡
Correlation in all diameters at all levels
Correlation in transverse glottic diameter
Correlation in all diameters at all levels
*In the two studies, the glottis and subglottis were defined separately. Otherwise, the two levels were defined interchangeably. †Unavailable detailed numerical data.
‡Calculated with the reported mean or median values.
§The ratios remained generally constant per age group.
MRI, magnetic resonance imaging; PSA, procedural sedation and analgesia; CT, computed tomography; CSA, cross-sectional area; AP, anteroposterior; mm2 , square millimeter.
Volume 24, NO.3: May 2023 581 Western Journal of Emergency Medicine
et al.
Kim
Pediatric Application of Cuffed Endotracheal Tube
1. Comparative benefits and limitations of cuffed endotracheal tubes over uncuffed tubes.1,2,4-7,33,34
Table 2. Literature on imaging-based, updated understanding of laryngeal anatomy.16-20
proposing that movable vocal cords make the fixed cricoid the functionally narrowest laryngeal level and insisting that the cricoid is most prone to endoscopy-proven airway injury. This criticism is refuted by the following evidence: 1) autopsy reports show the narrowest level is at the glottis21,23; 2) the subglottis, which is less distensible than the glottis, has a smaller cross-sectional area (CSA) and volume than the cricoid20,24; 3) injury usually occurs in the posterolateral portions of the glottis or subglottis, relatively sparing the cricoid level25-28; and 4) the conus elasticus, a soft tissue extending from the lower border of the vocal cords to the upper border of the cricoid, is prone to edema in cases of intubation or croup, owing to its lax attachment.20,28,29 This feature makes the subglottis an obstruction-prone level. (5) On optical coherence tomography, airway wall thickness was correlated with intubation duration at the glottis and subglottis, not at the upper trachea.27 Hence, we speculate that some level between the glottis and subglottis is functionally narrowest in the larynx.
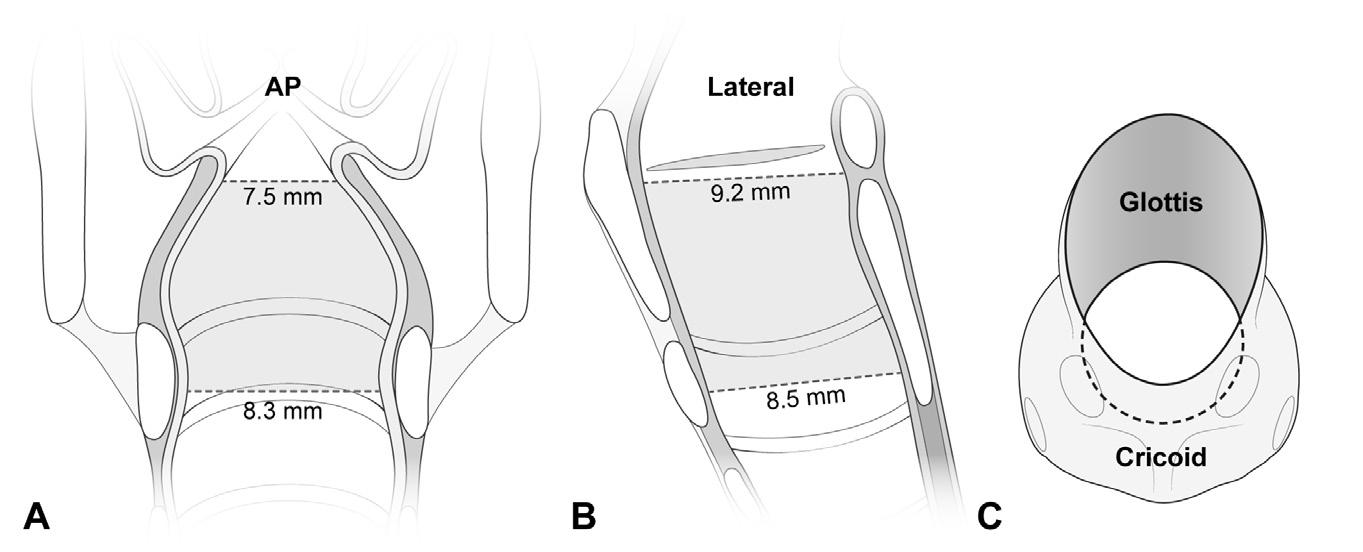
Briefly, the larynx in a young child is proportionally smaller than the adult larynx with the glottis or subglottis being the most injury-prone level. This update makes a valid rebuttal to the groundwork for the well-established use of uncuffed ETTs in young children.
Myth Breakers: Benefits of Cuffed Tubes
The known benefits of cuffed ETTs involve lower risk for air leakage and aspiration around the cuffs, favoring their use in endotracheal intubation for older children and adults (Table 1).1,2 In young children, uncuffed tubes are often selected, whereas cuffed tubes were rarely used and restricted primarily to those with reduced lung compliance.30 The persistence of this choice was exemplified by a French survey in 1999 showing that only 25.4% of anesthesiologists used cuffed tubes in >80% of pediatric cases.31 At that time in EDs, cuffed tubes were probably used less frequently. This preference
may have been affected by two myths derived from the false laryngeal configuration:
Myth 1. Uncuffed tubes snugly fit the circular larynx (Figure 1A).
Myth 2. Cuffs injure the cricoid mucosa (Figure 1B). These myths were modified by the knowledge of the elliptical section of the larynx and the unexpectedly lower incidence of cuffed ETT-induced airway injury.
In a rebuttal to myth 1, a snugly fit, uncuffed ETT can incur ischemia by compressing the posterolateral mucosa, with a leak via anterior space (Figure 1C).32 To reduce such pressure, the tube should be relatively smaller in diameter than the snugly fitting size.32 This need can be met by using a cuffed tube, of which inner diameter (ID) is 0.5 millimeters (mm) smaller than a same age group-matched uncuffed tube (Figure 1D; cf, Cole and Duracher formulae in Supplement Table 1). If a cuffed tube is appropriately positioned, the tube shaft and cuff come in contact with the glottic-subglottic and tracheal mucosae, respectively. Thus, in the larynx, the relatively narrower tube shaft lowers risk for compression.
Contrary to myth 2, PES or other croup symptoms occur comparably in both types of ETTs (cuffed, 2.4%‒4.4% vs uncuffed, 3.0%‒4.7%).33,34 The occurrence of airway injury is associated not with the cuff per se, but with the following factors: intubation duration; tube size; traumatic intubation; intracuff pressure (Pcuff); poorly designed or fit tube; movement of tube; low birth weight; infection; and shock.5,11,30,35 Further, sore throat more commonly occured with uncuffed tubes (cuffed, 7.7%–19.4% vs uncuffed, 32.4%–36.6%), indicating greater vulnerability to such minor injuries.36-38 This finding may be related to the contact of the tube tip with the tracheal wall, in addition to the posterolateral compression and frequent tube change mentioned above (Figure 1C).2,34,39,40
The tip-induced injury may deteriorate by movement of the tip during ventilation.35,39,40 If a cuffed tube is used, the cuff separates the tip and tracheal wall (Figure 1D).32-34;39, 40
Western Journal of Emergency Medicine 582 Volume 24, NO.3: May 2023 Pediatric Application of Cuffed Endotracheal Tube Kim et al.
Figure 2. A laryngeal configuration based on the computed tomography-measured transverse diameters on AP view (A) and AP (ie, sagittal) diameters on lateral view (B).18 It is narrowest in the transverse diameter at the glottis (A). Looking down the larynx at 45° from above, elliptical section is noted at the glottis (C). The ellipticity means a potential for uncuffed tube-induced posterolateral compression (See Figure 1C).
Modified from Kim et al.20 AP, anteroposterior.
Additional benefits of cuffed ETTs need to be mentioned (Figure 1D). Two randomized controlled trials compared the two types of tubes in 488 (age ≤8 years) and 2,246 (≤5 years) anesthetized children, respectively.33,34 As per the trials, uncuffed tubes required more frequent changes (cuffed, 1.2%–2.1% vs uncuffed, 22.8%–30.8%).33,34 Moreover, the need for fewer cuffed tube changes was demonstrated by a 0.17 relative risk (95% confidence interval 0.07–0.41).4 This benefit may stem from the cuff volume, which is adjustable to seal the trachea when its diameter varies with airway pressure, sedation, muscle relaxation, or the patient’s position.30,40 This adjustability contrasts with the fixed outer diameter of uncuffed tubes.
To prevent cuff-induced tracheal injury, Pcuff should be limited to <20‒25 cmH2O, since 20 cmH2O is presumed to be a capillary perfusion pressure in the tracheal mucosa.9,41 Theoretically, the posterior distensibility of the trachea may contribute to injury prevention (Figure 1D). Krishna et al42 showed 14, 23, and 45 cmH2O mean Pcuff of 5.0, 4.5, and 4.0 mm ID cuffed tubes, respectively, in a 10-mm ID, circumferentially fixed model trachea. In the tracheas of children aged 4‒8 years, the mean Pcuff was 27 (5.0), 25 (4.5), and 31 cmH2O (4.0 mm).42 This slower increase in Pcuff in vivo indicates a pressure-buffering role of the posterior distensible trachea.
Technical Flaws of Cuffed Tubes: Until the Early 2000s
Despite the benefits of cuffed tubes, concerns remained over their design, size, and material until the early 2000s. Compared to uncuffed tubes, cuffed tubes have an estimated 22%–52% margin of safety against intra-laryngeal cuff location and endobronchial intubation.43 Among the 11 cuffed tubes available in 2002, all cuffs of 3.0‒5.0 mm ID tubes were located in the larynx with the tube tips at the mid-trachea.44 This erroneously high cuff location was related to the elongated shape of the cuff or the presence of distal Murphy eye (Figure 1B). Only five of the 11 products had depth marks, which should be leveled to the glottis to place the cuff below the cricoid. If a 3.0 mm ID tube was inserted with the mark at the glottis, three of the five products had their tips at the carina, indicating a too high location of the marks.44 Until the 1990s, a cuffed tube of size <5.0 mm ID was less available.40
Given the association between high Pcuff and airway injury, since the mid-1990s, HVLP cuffs have replaced high-pressure cuffs.36 With this change, there was increased clinical interest in studying to what degree high cuff volume is appropriate while limiting Pcuff. At Pcuff of 20 cmH2O, CSA (or diameter) of the cuff should cover 120%–150% of CSA (or diameter) of the age group-related, maximally sized trachea.1,45 This high volume enables the cuff surface to drape along the tracheal wall, enhancing the sealing effect.46 As of 2002, most cuffs had CSAs that failed to meet the 120%–150% requirement.44 The 3.0–4.5 mm ID and 5.0–7.0 mm ID ETTs covered 71.4%–141.6% and 114.5%‒301.0% of the tracheal CSAs, respectively.44 This
indicates that the size was too small for children <5 years, and too large for older ones (Duracher’s, Supplement Table 1).44 A polyvinylchloride (PVC) cuff may create folds and channels on its surface, leading to leakage or airway injury.1 A 3.5–6.0 mm ID PVC cuffed tube (Mallinckrodt HiLo [Mallinckrodt Medical, Athlone, Ireland]) showed a median Pcuff of 23 cmH2O (maximum, 120 cmH2O) with only 40.8% of Pcuff <20 cmH2O.47
Contemporaneous Technical Advances in Cuffed Tubes
PU emerged as an HVLP cuff material while conventional PVC was still being used. Advances in the design, size, and material of cuffed tubes is represented by the MicrocuffTM (Microcuff GmbH, Weinheim, Germany), a PU-cuffed ETT released in 2004. This product features a short, distally located, cylindrical, 10 micrometer (µm)-thick cuff (cf, PVC, 50‒80 µm), absence of Murphy eye, properly located depth mark, and a size ranging from 3.0–7.0 mm ID (for children weighing ≥3.0 kilograms [kg]).1,8,48,49 The PU cuff enabled sealing with a mean Pcuff of 9.7 cmH2O with 1.6% and 1.8% oversize and PES rates, respectively.8
PU is a better cuff material than PVC in meeting the 120%–150% requirement of HVLP cuffs and maintaining low Pcuff. Fischer et al50 compared two PU cuffs (Microcuff and Parker ThinCuff PTCL [Parker Medical, Danbury, CT]) and three PVC cuffs of 3.0–7.0 mm ID tubes at 20 cmH2O Pcuff, in terms of sealing the age group-related maximally sized tracheas. As a result, the PU and PVC cuffs covered 110%‒129% and 68%‒157% of the tracheal diameters, respectively. Of note, the PVC cuffs of 3.0–4.5 mm ID tubes tended to insufficiently seal the trachea (68%–114%). A study comparing one PU cuff (Microcuff) and three PVC cuffs of 4.0 mm ID tubes in 80 children 2–4 years old showed a median Pcuff of 11 cmH2O in the PU cuff, in contrast to 21–36 cmH2O in the PVC cuffs.51 Compared to PVC cuffs, PU cuffs have a smaller difference between measured and manufacturerprovided cuff diameters, and expand more symmetrically.50 Compared to PVC cuffs, ultrathin PU cuffs result in fewer or finer folds and channels, preventing leakage and aspiration.49,52 Consistent with the benefits of cuffed tubes and the updated anatomy, technical advances in cuff tube design have facilitated their application in young children.
Current Recommendations for Cuffed Tubes
Cuffed ETTs have gained popularity in anesthesia worldwide. Approximately 70%–90% of Dutch and 50%–80% of British anesthesiologists preferred cuffed tubes for children aged 1 month‒8 years.53 Another survey showed that using the tubes in ≥50% of occasions for those with the same age range was reported in 74%–85% of the Society of Pediatric Anesthesia members, of whom 88% were from the United States.54 These proportions contrast with the 25.4% of anesthesiologists surveyed in 1999.31 As of 2019, in an academic hospital in Maryland, it was decided to discontinue use of uncuffed tubes in the operating rooms.55
Volume 24, NO.3: May 2023 583 Western Journal of Emergency Medicine
Kim et al. Pediatric Application of Cuffed Endotracheal Tube
The current guidelines are consistent with the updated anatomy and technical advances, promoting the pediatric application of cuffed tubes in EDs. The 2020 American Heart Association recommendation for use of cuffed ETTs facilitates the translation of the tubes from operating rooms into emergency departments.9 In addition, cuffed tubes are recommended for children except “small” infants by the 2021 European Resuscitation Council guidelines.10 The most recent emergency medicine textbooks recommend cuffed tubes or at least highlight their benefits, whereas a representative textbook of pediatrics does not discuss the topic (Supplement Table 2 lists textbook descriptions).56-59
Is the Anesthesiologic Evidence Applicable to EDs?
Unlike elective intubation under anesthesia, emergency intubation features urgency, lack of nil per os, greater frequency of crash airways, shorter length of induction, longer intubation duration, and variable skill levels of intubators. In EDs, critically ill or injured children should be stabilized with first-pass success of intubation and positive pressure ventilation. Cuffed tubes require fewer tube changes due to the adjustability of the cuffs. Even if a tube smaller than the best fitting size is intubated (ie, undersized intubation), which leads to excessive leakage at 20 cmH2O Pcuff, a cuffed tube expedites positive pressure ventilation by temporarily hyperinflating the cuff and permitting high Pcuff, or vice versa, permitting some leakage around the cuff.12 After stabilization, it may be replaced with a larger tube. Undeniably, airway resistance could rise more acutely in a 0.5 mm ID smaller cuffed tube than in an uncuffed tube.42 Such an issue can be eased by applying pressure-controlled ventilation or, if spontaneous ventilation is possible, pressure-support ventilation.6 Essentially, uncuffed tubes require more frequent tube changes as compared with cuffed tubes. If undersized, uncuffed tubes more easily develop an unacceptable degree of leakage or aspiration, incurring inaccurate delivery of tidal volume or occurrence of ventilator-associated pneumonia.7,37
With increased awareness of pediatric laryngeal anatomy and technical advances, cuffed ETTs are becoming the norm for emergency intubation in young children.9,10 Hence, we recommend the preferential use of cuffed tubes in EDs while awaiting ED-based evidence.
Three Caveats
First, it is recommended to monitor Pcuff of <20‒25 cmH2O using a cuff manometer (Table 1). Although the monitoring is associated with a reduction of PES from 21.8% to 9.9%,60 a cuff manometer is rarely available in EDs. Instead, many emergency physicians slowly inflate cuffs until the cessation of audible leakage around the cuffs, despite the unreliability of this maneuver.56 Compared to the maneuver, Pcuff estimation by palpating the cuffs is related to even higher Pcuff 61 As an interim measure in the case of the unavailability of a manometer, it may be acceptable to slowly put 0.5
milliliters (mL) of air (maximum 1 mL) using a 1-mL syringe until the leaking stops. This maneuver is supported by 0.6 mL of air required to achieve 20 cmH2O Pcuff of a 3.0 mm ID Microcuff tube in a model trachea and the association between 0.9 mL median air volume and 12 cmH2O median Pcuff in 44 children with a median age of three years.62,63
Second, small-sized ETTs (eg, <5.0 mm ID) need more judicious cuff inflation and size estimation, or the use of PU cuffs. If a formula is used, we recommend the Duracher formula instead of Khine’s (Supplement Table 1).62 In children weighing ≥3.0 kg, the small size of cuffed tubes might lead to inadvertent undersize, inducing inevitable rises in airway resistance and Pcuff. This scenario is plausible given the association of a 0.5 mm decrease in the ID of tubes with higher mean Pcuff (Khine-estimated, 25 cmH2O vs 0.5 mm smaller tube, 37 cmH2O),42 and more frequent PES, hoarseness or sore throat if estimated by Khine’s than by Duracher’s formula.62 Undersized intubation may predispose children to an obstruction by mucus plugging or if bronchoscopy is required, a need for tube change to a larger size.
Third, in neonates or infants weighing <3.0 kg, it remains prudent to use uncuffed ETTs. In this population, a 3.0 mm ID cuffed tube may still be too large for their airways and cause airway injuries more frequently than an uncuffed tube. The injury is more likely to occur when cuffed tubes are inserted into infants with low birth weight or the tracheal wall is in contact with the wrinkled edge of a deflated cuff.64,65 In those infants weighing 2–3 kg, cuffed tubes may be chosen in >50% of occasions at ≥2.7 kg weight.11,66 Reportedly, a 2.5 mm ID Mircocuff tube is currently under development.11
LIMITATIONS
First, there might have been a potential exclusion of articles mentioning the pediatric difficult or crash airway situations during the exclusion process of searched articles. Despite the insufficient evidence, we speculate that the use of cuffed ETTs may be beneficial in those situations. Second, the impact of sedatives or neuromuscular blocking agents on leakage or aspiration was not detailed given that regardless of the choice between cuffed and uncuffed tubes, the drugs are used during rapid sequence intubation or critical care.
CONCLUSION
A young child’s larynx features the glottis as the narrowest level, elliptical section, and cylindrical shape. This updated anatomic consideration and technical advances are facilitating the use of HVLP cuffed ETTs, particularly tubes with PU cuffs. In emergency intubation of young children, cuffed tubes are preferred to uncuffed tubes while monitoring low Pcuff, judiciously inflating cuffs of small-size tubes, and continuing to use uncuffed tubes in neonates or infants weighing <3.0 kg.
ACKNOWLEDGMENTS
The authors would like to thank Woohyun Cho, the Office of Biostatistics, Medical Information and Media Center, Ajou
Western Journal of Emergency Medicine 584 Volume 24, NO.3: May 2023
Kim et al.
Pediatric Application of Cuffed Endotracheal Tube
University School of Medicine, Suwon, Korea.
Address for Correspondence: Yun Jeong Chae, MD, PhD, Ajou University School of Medicine, Department of Anesthesiology, 164 World cup-ro, Yeongtong-gu, Suwon 16499, Korea. Email: yjchae06@aumc.ac.kr
Conflicts of Interest: By the WestJEM article submission agreement, all authors are required to disclose all affiliations, funding sources and financial or management relationships that could be perceived as potential sources of bias. No author has professional or financial relationships with any companies that are relevant to this study. There are no conflicts of interest or sources of funding to declare.
Copyright: © 2023 Kim et al. This is an open access article distributed in accordance with the terms of the Creative Commons Attribution (CC BY 4.0) License. See: http://creativecommons.org/ licenses/by/4.0/
REFERENCES
1. Weiss M, Dullenkopf A. Cuffed tracheal tubes in children: past, present and future. Expert Rev Med Devices. 2007;4:73-82.
2. Tobias JD. Pediatric airway anatomy may not be what we thought: implications for clinical practice and the use of cuffed endotracheal tubes. Paediatr Anaesth. 2015;25:9-19.
3. De Orange FA, Andrade RG, Lemos A, Borges PS, Figueiroa JN, Kovatsis PG. Cuffed versus uncuffed endotracheal tubes for general anaesthesia in children aged eight years and under. Cochrane Database Syst Rev. 2017;11:Cd011954.
4. Shah A, Carlisle JB. Cuffed tracheal tubes: guilty now proven innocent. Anaesthesia. 2019;74:1186-90.
5. Bhardwaj N. Pediatric cuffed endotracheal tubes. J Anaesthesiol Clin Pharmacol. 2013;29:13-8.
6. Thomas J, Weiss M, Cannizzaro V, Both CP, Schmidt AR. Work of breathing for cuffed and uncuffed pediatric endotracheal tubes in an in vitro lung model setting. Paediatr Anaesth. 2018;28:780-7.
7. Miller MA, Arndt JL, Konkle MA, et al. A polyurethane cuffed endotracheal tube is associated with decreased rates of ventilatorassociated pneumonia. J Crit Care. 2011;26:280-6.
8. Dullenkopf A, Gerber AC, Weiss M. Fit and seal characteristics of a new paediatric tracheal tube with high volume-low pressure polyurethane cuff. Acta Anaesthesiol Scand. 2005;49:232-7.
9. Topjian AA, Raymond TT, Atkins D, et al. Part 4: Pediatric Basic and Advanced Life Support: 2020 American Heart Association Guidelines for Cardiopulmonary Resuscitation and Emergency Cardiovascular Care. Circulation. 2020;142:S469-s523.
10. Van de Voorde P, Turner NM, Djakow J, et al. European Resuscitation Council Guidelines 2021: Paediatric Life Support. Resuscitation. 2021;161:327-87.
11. Klabusayová E, Klučka J, Kratochvíl M, et al. Airway management in pediatric patients: cuff-solved problem? Children (Basel) 2022;9:1490.
12. Clements RS, Steel AG, Bates AT, Mackenzie R. Cuffed endotracheal tube use in paediatric prehospital intubation: challenging the
doctrine? Emerg Med J. 2007;24:57-8.
13. Miller KA, Nagler J. Advances in emergent airway management in pediatrics. Emerg Med Clin North Am. 2019;37:473-91.
14. Bayeux R. Laryngeal intubation in croup [Tubage du larynx dans le croup]. Presse Medicale 1897;6:29-33.
15. Eckenhoff JE. Some anatomic considerations of the infant larynx influencing endotracheal anesthesia. Anesthesiology. 1951;12:40110.
16. Litman RS, Weissend EE, Shibata D, Westesson PL. Developmental changes of laryngeal dimensions in unparalyzed, sedated children. Anesthesiology. 2003;98:41-5.
17. Dalal PG, Murray D, Messner AH, Feng A, McAllister J, Molter D. Pediatric laryngeal dimensions: an age-based analysis. Anesth Analg. 2009;108:1475-9.
18. Wani TM, Bissonnette B, Rafiq Malik M, et al. Age-based analysis of pediatric upper airway dimensions using computed tomography imaging. Pediatr Pulmonol. 2016;51:267-71.
19. Mizuguchi S, Motomura Y, Maki J, et al. Tracheal size and morphology on the reconstructed CT imaging. Pediatr Crit Care Med 2019;20:e366-e71.
20. Kim Y, Park JE, Kim JH. Plain radiographic analysis of laryngeal dimensions in young children: normal versus croup. Children 2022;9:1532.
21. Holzki J, Brown KA, Carroll RG, Coté CJ. The anatomy of the pediatric airway: Has our knowledge changed in 120 years? A review of historic and recent investigations of the anatomy of the pediatric larynx. Paediatr Anaesth. 2018;28:13-22.
22. Holzki JF, Laschat M, Puder C. The pediatric larynx: a complicated organ. Anesth Analg. 2010;110:1509-10; author reply 11.
23. Eckel HE, Koebke J, Sittel C, Sprinzl GM, Pototschnig C, Stennert E. Morphology of the human larynx during the first five years of life studied on whole organ serial sections. Ann Otol Rhinol Laryngol 1999;108:232-8.
24. Wani TM, Rafiq M, Talpur S, Soualmi L, Tobias JD. Pediatric upper airway dimensions using three-dimensional computed tomography imaging. Paediatr Anaesth. 2017;27:604-8.
25. Benjamin B. Prolonged intubation injuries of the larynx: endoscopic diagnosis, classification, and treatment. Ann Otol Rhinol Laryngol Suppl. 1993;160:1-15.
26. Reidenbach MM, Schmidt HM. Anatomical aspects of postintubational subglottic stenosis. Clin Anat. 1995;8:273-80.
27. Sharma GK, Ahuja GS, Wiedmann M, et al. Long-range optical coherence tomography of the neonatal upper airway for early diagnosis of intubation-related subglottic injury. Am J Respir Crit Care Med. 2015;192:1504-13.
28. Lambercy K, Pincet L, Sandu K. Intubation related laryngeal injuries in pediatric population. Front Pediatr. 2021;9:594832.
29. Darras KE, Roston AT, Yewchuk LK. Imaging acute airway obstruction in infants and children. Radiographics. 2015;35:2064-79.
30. Fine GF, Borland LM. The future of the cuffed endotracheal tube. Paediatr Anaesth. 2004;14:38-42.
31. Orliaguet GA, Renaud E, Lejay M, et al. Postal survey of cuffed
Volume 24, NO.3: May 2023 585 Western Journal of Emergency Medicine
et al. Pediatric Application of Cuffed Endotracheal Tube
Kim
Pediatric Application of Cuffed Endotracheal Tube Kim et al. or uncuffed tracheal tubes used for paediatric tracheal intubation. Paediatr Anaesth. 2001;11:277-81.
32. Motoyama EK. The shape of the pediatric larynx: cylindrical or funnel shaped? Anesth Analg. 2009;108:1379-81.
33. Khine HH, Corddry DH, Kettrick RG, et al. Comparison of cuffed and uncuffed endotracheal tubes in young children during general anesthesia. Anesthesiology. 1997;86:627-31; discussion 27A.
34. Weiss M, Dullenkopf A, Fischer JE, Keller C, Gerber AC. Prospective randomized controlled multi-centre trial of cuffed or uncuffed endotracheal tubes in small children. Br J Anaesth. 2009;103:867-73.
35. Taylor C, Subaiya L, Corsino D. Pediatric cuffed endotracheal tubes: an evolution of care. Ochsner J. 2011;11:52-6.
36. Calder A, Hegarty M, Erb TO, von Ungern-Sternberg BS. Predictors of postoperative sore throat in intubated children. Paediatr Anaesth 2012;22:239-43.
37. Chambers NA, Ramgolam A, Sommerfield D, et al. Cuffed vs. uncuffed tracheal tubes in children: a randomised controlled trial comparing leak, tidal volume and complications. Anaesthesia 2018;73:160-8.
38. El-Boghdadly K, Bailey CR, Wiles MD. Postoperative sore throat: a systematic review. Anaesthesia. 2016;71:706-17.
39. Flynn PE, Black AE, Mitchell V. The use of cuffed tracheal tubes for paediatric tracheal intubation, a survey of specialist practice in the United Kingdom. Eur J Anaesthesiol. 2008;25:685-8.
40. James I. Cuffed tubes in children. Paediatr Anaesth. 2001;11:259-63.
41. Thomas R, Rao S, Minutillo C. Cuffed endotracheal tubes for neonates and young infants: a comprehensive review. Arch Dis Child Fetal Neonatal Ed. 2016;101:F168-74.
42. Krishna SG, Hakim M, Sebastian R, Dellinger HL, Tumin D, Tobias JD. Cuffed endotracheal tubes in children: the effect of the size of the cuffed endotracheal tube on intracuff pressure. Paediatr Anaesth 2017;27:494-500.
43. Ho AM, Aun CS, Karmakar MK. The margin of safety associated with the use of cuffed paediatric tracheal tubes. Anaesthesia 2002;57:173-5.
44. Weiss M, Dullenkopf A, Gysin C, Dillier CM, Gerber AC. Shortcomings of cuffed paediatric tracheal tubes. Br J Anaesth 2004;92:78-88.
45. Dave MH, Frotzler A, Spielmann N, Madjdpour C, Weiss M. Effect of tracheal tube cuff shape on fluid leakage across the cuff: an in vitro study. Br J Anaesth. 2010;105:538-43.
46. Guyton D, Banner MJ, Kirby RR. High-volume, low-pressure cuffs. Are they always low pressure? Chest. 1991;100:1076-81.
47. Felten ML, Schmautz E, Delaporte-Cerceau S, Orliaguet GA, Carli PA. Endotracheal tube cuff pressure is unpredictable in children. Anesth Analg. 2003;97:1612-6.
48. Cox RG. Should cuffed endotracheal tubes be used routinely in children? Can J Anaesth. 2005;52:669-74.
49. Dullenkopf A, Gerber A, Weiss M. Fluid leakage past tracheal tube cuffs: evaluation of the new Microcuff endotracheal tube. Intensive Care Med. 2003;29:1849-53.
50. Fischer M, Grass B, Kemper M, Weiss M, Dave MH. Cuffed pediatric
endotracheal tubes-Outer cuff diameters compared to age-related airway dimensions. Paediatr Anaesth. 2020;30:424-34.
51. Dullenkopf A, Schmitz A, Gerber AC, Weiss M. Tracheal sealing characteristics of pediatric cuffed tracheal tubes. Paediatr Anaesth 2004;14:825-30.
52. Mariyaselvam MZ, Marsh LL, Bamford S, Smith A, Wise MP, Williams DW. Endotracheal tubes and fluid aspiration: an in vitro evaluation of new cuff technologies. BMC Anesthesiol. 2017;17:36.
53. Boerboom SL, Muthukrishnan SM, de Graaff JC, Jonker G. Cuffed or uncuffed endotracheal tubes in pediatric anesthesia: a survey of current practice in the United Kingdom and The Netherlands. Paediatr Anaesth. 2015;25:431-2.
54. Sathyamoorthy M, Lerman J, Okhomina VI, Penman AD. Use of cuffed tracheal tubes in neonates, infants and children: a practice survey of members of the Society of Pediatric Anesthesia. J Clin Anesth. 2016;33:266-72.
55. Shaffner DH, McCloskey JJ, Schwartz JM. Cuffed endotracheal tube use in children: Times (and minds) are ‘a changing. Pediatr Crit Care Med. 2019;20:789-90.
56. Hansen ML, Eriksson C. Intubation and ventilation of infants and children. In: Tintinalli JE, Ma OJ, Yealy DM, Meckler GD, Stapczynski JS, Cline DM, Thomas SH, editors. Tintinalli’s Emergency Medicine: A Comprehensive Study Guide. 9th ed. New York: McGraw-Hill Education; 2020. p. 710-9.
57. Nagler J, Mick NW. Airway management for the pediatric patient. In: Walls RM, Hockberger RS, Gausche-Hill M, Bakes K, Baren JM, Erickson TB, Jagoda AS, Kaji AH, VanRooyen M, Zane RD, editors. Rosen’s Emergency Medicine: Concepts and Clinical Practice. 9th ed. Philadelphia (PA): Elsevier; 2018. p. 1994-2004.
58. Nagler J, Donoghue AJ, Yamamoto LG. Airway. In: Shaw KN, Bachur RG, Chamberlain J, Lavelle J, Nagler J, Shook JE, editors. Fleisher and Ludwig’s Textbook of Pediatric Emergency Medicine, 8th ed, 2021. Philadelphia (PA): Wolters Kluwer; 2021. p. 34-42.
59. Hartman ME, Cheifetz IM. Pediatric emergencies and resuscitation. In: Kliegman RM, St Geme III JW, Blum NJ, Shah SS, Tasker RC, Wilson KM, editors. Nelson Textbook of Pediatrics. 21th ed. Philadelphia (PA): Elsevier; 2020. p. 530-47.
60. Schneider J, Mulale U, Yamout S, Pollard S, Silver P. Impact of monitoring endotracheal tube cuff leak pressure on postextubation stridor in children. J Crit Care. 2016;36:173-7.
61. Al-Metwalli RR, Al-Ghamdi AA, Mowafi HA, Sadek S, Abdulshafi M, Mousa WF. Is sealing cuff pressure easy, reliable and safe technique for endotracheal tube cuff inflation? A comparative study. Saudi J Anaesth. 2011;5:185-9.
62. Manimalethu R, Krishna S, Shafy SZ, Hakim M, Tobias JD. Choosing endotracheal tube size in children: Which formula is best? Int J Pediatr Otorhinolaryngol. 2020;134:110016.
63. Bernet V, Dullenkopf A, Maino P, Weiss M. Outer diameter and shape of paediatric tracheal tube cuffs at higher inflation pressures. Anaesthesia. 2005;60:1123-8.
64. Sathyamoorthy M, Lerman J, Asariparampil R, Penman AD, Lakshminrusimha S. Stridor in neonates after using the Microcuff®
Western Journal of Emergency Medicine 586 Volume 24, NO.3: May 2023
Kim et al.
and uncuffed tracheal tubes: a retrospective review. Anesth Analg 2015;121:1321-4.
65. Sathyamoorthy M, Lerman J, Lakshminrusimha S, Feldman D. Inspiratory stridor after tracheal intubation with a MicroCuff® tracheal
Pediatric Application of Cuffed Endotracheal Tube
tube in three young infants. Anesthesiology. 2013;118:748-50.
66. Zander D, Grass B, Weiss M, Buehler PK, Schmitz A. Cuffed endotracheal tubes in neonates and infants of less than 3 kg body weight-A retrospective audit. Paediatr Anaesth. 2021;31:604-10.
Volume 24, NO.3: May 2023 587 Western Journal of Emergency Medicine
Effects of Non-physician Practitioners on Emergency Medicine Physician Resident Education
Andrew W. Phillips, MD, MEd*
Jeremy P. Sites, MD, MEd‡
Faith C. Quenzer, DO, MPH||
Daniel M Lercher, MD§
Section Editor: David
Lee, MD
DHR Health Research Institute, Edinburg, Texas
University of Kentucky, Department of Pediatrics, Pediatric Critical Care, Lexington, Kentucky
University of North Carolina at Chapel Hill, Division of Pediatric Critical Care Medicine, Chapel Hill, North Carolina
San Diego State University, School of Public Health, Division of Epidemiology and Biostatistics, San Diego, California
Submission history: Submitted September 4, 2022; Revision received January 28, 2023; Accepted February 4, 2023
Electronically published May 3, 2023.
Full text available through open access at http://escholarship.org/uc/uciem_westjem
DOI: 10.5811/westjem.58759
Introduction: The effects of non-physician practitioners (NPP) such as physician assistants and nurse practitioners on the education of emergency medicine (EM) residents have not previously been specifically evaluated. Emergency medicine societies have made policy statements regarding NPP presence in EM residencies without the benefit of empiric studies.
Methods: A cross-sectional, mixed methods questionnaire with strong validity evidence was distributed to current EM residents who were members of a large national society, the American Academy of Emergency Medicine Resident and Student Association (AAEM/RSA), between June 4–July 5, 2021.
Results: We received 393 partial and complete responses, representing a 34% response rate. A majority of respondents (66.9%) reported that NPPs have a detracting or greatly detracting impact on their education overall. The workload in the emergency department was reported generally as lighter (45.2%) to no impact (40.1%), which was cited in narrative responses as an aspect of both enhancing and detracting from resident physician education. Non-physician practitioner postgraduate programs in EM were associated with a 14x increase in the median number of procedures forfeited over the course of the prior year (median = 7.0 vs 0.5, P<.001). Among respondents, 33.5% reported feeling “not confident at all” in their ability to report concerns about NPPs to local leadership without retribution, and 65.2% reported feeling “not confident at all” regarding confidence in the Accreditation Council for Graduate Medical Education to satisfactorily address concerns about NPPs raised in the end-of-year survey.
Conclusion: Resident members of the AAEM/RSA reported having concerns about the effects of NPPs on their education and their confidence in being able to address the concerns. [West J Emerg Med. 2023;24(3)588–596.]
INTRODUCTION
The emergency physician trainee educational environment of both emergency department (ED) and off-service rotations has changed over the last decade with a rapid increase in staffing by non-physician practitioners (NPP), often nurse practitioners and physician assistants.1–3 Recently the American
Academy of Emergency Medicine Resident and Student Association (AAEM/RSA), as well as several other EM and EM resident societies, published policy statements detailing concerns and best practices for the presence of NPPs—and their postgraduate training programs—in EDs with emergency medicine (EM) residents.4,5 However, there is scant literature
Western Journal of Emergency Medicine 588 Volume 24, NO.3: May 2023 * ‡ § || Original Research
assessing the effects of NPPs on physician resident education across the breadth of medicine and no literature specific to EM.
Most prior studies evaluating the impact of NPPs on physician trainee education are from surgical specialties, which consistently report reduced workload, primarily due to reduced documentation responsibilities. Findings are mixed with respect to the impact on residents’ education, with conflicting reports of better operative experiences because of fewer floor pages vs forfeiting some operative procedures to NPs and PAs.6–8
One survey across an entire academic institution found that NPs reported contributing positively to the education experience of resident physicians.9 Another study found a generally positive impact on intensive care unit fellow education according to fellowship directors.10 Notably, the residents and fellows whose education was being assessed were not included in either study.
Additionally, an important development across US academic medical centers that has not been captured in any prior studies of resident education to date in any specialty is the increasing number of institutions that now host postgraduate training programs for NPPs.4 Early studies have started to evaluate such programs in EM but once again without the perspectives of physician residents, leaving a primary stakeholder unaddressed.11,12 Our primary objective in this study was to establish how EM residents perceive the effects of NPPs on their education, both while on service in the ED and off service. Our secondary objective was to establish whether those perceptions are associated with the presence vs absence of NPP postgraduate training programs in EM.
METHODS
In-depth paradata are available in Appendix A. Best practices for survey research were followed and reported using recommended reporting guidelines.13,14 The study was confirmed to be exempt by the Washington Hospital Health System Institutional Review board.
Participants and Eligibility
The sampling frame was EM residents at US (state and territory) Accreditation Council for Graduate Medical Education (ACGME)-accredited programs who are members of the American Academy of Emergency Medicine Resident and Student Association (AAEM-RSA), drawn from its files. Residents in combined programs, such as EM/internal medicine, were included as well. Personal leave was not an exclusion criterion since items assessed perspectives over varying amounts of time.
Survey Method and Validity Evidence
Our primary objective was to capture the physician residents’ perspectives of the effects of NPPs on their education, which is intangible and, thus, best suited for a survey approach.15 The instrument was built using established best practices including expert and stakeholder involvement, layout recommendations,
Population Health Research Capsule
What do we already know about this issue?
Non-physician practitioners (NPPs) are a growing part of the workforce in emergency departments with emergency medicine (EM) residency programs.
What was the research question?
What is the impact of NPPs on resident education from the EM resident’s perspective?
What was the major finding of the study?
66.9% of residents reported a detracting impact on their education. Presence of an NPP postgraduate program was associated with 14x increase in resident-forfeited procedures.
How does this improve population health?
Excellent physician education is critical to addressing population health needs throughout the country.
cognitive interviews, pilot testing, and nonresponse bias analysis.16,17 Appendix A contains all relevant paradata.
We applied Messick’s validity framework consistent with recommendations by the American Association of Public Opinion Research.18 Appendix A includes a full validity evaluation, and Appendix B is the final instrument. Educational items were drawn from an existing instrument with good validity evidence,8 while gender and race/ethnicity demographics items were drawn from publicly available Association of American Medical Colleges records 19 The procedure list was drawn from the ACGME requirements,20 and designations of unsupervised NPP practice laws were drawn from a published third-party review study.21 A complete list of existing instruments that we considered for use, along with our rationale for inclusion or exclusion in this study, is available in Appendix A.
The survey was open from June 4–July 5, 2021 and distributed electronically via Qualtrics (Qualtrics International, Inc., Provo, UT) with four reminders and an electronic prenotification the week before the initial invitation, all consistent with best practices.17 Although the cohort was AAEM/RSA resident physicians, neither AAEM/RSA as an organization, nor its employees or representatives, were involved in any part of this study including instrument creation and analysis, other than simply distributing the instrument to its members.
Statistical Analysis
We used skewness and kurtosis to assess whether items met normal distribution requirements for parametric analyses.22 The
Volume 24, NO.3: May 2023 589 Western Journal of Emergency Medicine Phillips et al. Effects of Non-physician Practitioners on EM Physician Resident Education
Mann-Whitney U test, chi-square, and Fisher exact tests were used to compare the frequencies of events and scale ratings against the presence of an NPP postgraduate training program, postgraduate year status, and the existence of state laws regarding NPP supervision. We used the Spearman correlation coefficient to assess correlations.
Per published recommendations, we determined a priori to assess for nonresponse bias with both a wave analysis and demographics comparison (Appendix A).17 Qualitative analysis was conducted using a holistic coding approach.23 Two authors simultaneously developed codes and applied them accordingly (Appendix A). We followed reporting guidelines from Academic Medicine for surveys and qualitative data.13,24
RESULTS
Respondents
We received 393 partial and complete responses of 1,168 invitations that were confirmed received and viewed, yielding a 34% response rate. Table 1 shows the respondents’
demographics. State representation is in Appendix C. No empirical evidence for nonresponse bias using two independent analyses was found (Appendix A).
General Education and Work Experience
Detailed responses to Likert-type items are in Table 2; histograms are shown in Appendix D. Residents reported a generally unchanged or lighter workload and generally unaffected documentation time due to NPPs in the ED. In contrast, more than two-thirds of residents reported a negative impact of NPPs in the ED on their education. Residents reported having limited confidence in the local and national institutions responsible for ensuring the quality of residents’ medical education with respect to the presence of NPPs in the ED. One-third of residents reported feeling no confidence at all in being able to report concerns about the presence of NPPs in the ED without retribution.
Enhancing and Detracting Educational Impact of Nonphysician Practitioners
Responses to the two narrative items evaluating how NPPs in the ED enhance and detract from EM resident education are characterized in Table 3.
Procedure Experiences in the Emergency Department and Off Service
Appendix E shows the complete numeric breakdown of procedure types and the number of each of those procedures forfeited in the ED and off-service, in addition to histograms for the same information. Table 4 describes the reasons why procedures were forfeited. All narrative responses and their final codes are in Appendix F.
Across all procedures, 264 residents (57.2%) reported at least one procedure for their patient being performed by an NPP during an ED rotation and 220 (59.5%) during an off-service rotation. The median number of procedures being performed by an NPP on residents’ patients in the ED was 2.00, while the off- service median was 2.5. The total number of forfeited procedures correlated inversely with the perception of overall impact on education (ie, forfeited procedures were associated with the perception of detraction from education), rs=.381, P<.001, r2=0.14. Almost one-third (30.5%) of 269 responding residents reported at least one instance during an EM rotation of a patient being preferentially assigned to an NPP. Slightly fewer (25% of 200) reported at least one such instance while off service.
*Total n for each item varies due to item nonresponse.
Conversely, 53.3% of 246 respondents reported having at least one patient preferentially assigned to them (physician resident) in lieu of an NPP because of the educational value during an EM rotation. Only 26.1% of 203 respondents reported the same on an off-service rotation. Additionally, of 280 residents who responded to the survey, 15% reported that an NPP taught or supervised them for at least one procedure in the ED, whereas 213 (38%) reported at least one such occurrence while on an off-service rotation.
Western Journal of Emergency Medicine 590 Volume 24, NO.3: May 2023
Phillips et al.
Effects of Non-physician Practitioners on EM Physician Resident Education
Category No. (%) Postgraduate year 1 94 (32.1%) 2 89 (30.4%) 3 75 (25.6%) 4 32 (10.9%) 5 3 (1.0%) Gender Male 187 (65.4%) Female 99 (34.6%) Race/ethnicity Asian 31 (11.0%) Black 12 (4.3%) Hispanic, Latino, other, Pacific Islander 12 (7.4%) White 195 (69.1%) Other race/ethnicity 19 (6.7%) Unknown race/ethnicity 3 (1.1%) Non-US citizen or non-permanent resident 1 (0.4%) State NPP supervision laws Independent 80 (29.7) Supervised 189 (70.3) Post-Graduate program for NPs and/or PAs Yes 133 (22.9) No 214 (36.8) Don’t know 32 (5.5)
Table 1. Demographic features of survey respondents.
NPP, non-physician practitioner; PA, physician assistant.
Table 2. Likert-type responses to items assessing the impact of non-physician practitioners in the emergency department on general education and work experience. Effect on resident workload in the emergency department (n=392)
Confidence in ability to report concerns about NP/PA presence to local leadership without retribution
Confidence in the ACGME to satisfactorily address concerns about NP/PA presence reported in the annual end-of-year survey (n=379)
confident at all A little confident
*Percentage values are reported as a function of the total item responses. NP, nurse practitioner; PA, physician assistant.
When asked why procedures were forfeited, unit culture was independently cited significantly more frequently for offservice rotations than for ED rotations (28.0% vs 19.7%, ��2 (1, n=132)=10.696, P<.01, Cramer’s V=0.285). “Intimidation” as a theme was expressed only in the ED responses.
Presence of EM Postgraduate Training Programs for Nonphysician Practitioners
The presence of a postgraduate training program for NPPs was not significantly associated with residents’ impression of the overall impact of NPPs on their education (P=.26, Fisher exact test) or on their confidence in being able to report concerns about NPPs to local leadership without retribution (��2 (4, n=347)=1.290, P=.87). However, EM residents were significantly more likely to have forfeited at least one procedure on their patients than those without such programs on both EM rotations (69% vs 50%, ��2 (1, n=264)=9.160, P<.01, Cramer’s V=.186) and off-service rotations (68.8% vs 54.3%, ��2 (1, n=220)=4.422, P=.04, Cramer’s V=.142). Significantly more total procedures in the ED were forfeited as well by residents whose institutions hosted an NPP postgraduate EM program (median = 7.0) compared to not [median =0.5, U(Nwith=100, Nwithout=164)=6,070.5, z=-3.687, P<.001, η2=.052], a factor of 14x, and trended similarly for reports of off-service procedures [median =7.5 with vs 2.0 without, U(Nwith=80, Nwithout=140)=4,769.0, z=-1.894, P=.06].
Twice as many residents reported forfeiting at least one educational ED patient encounter at programs with an associated
NPP postgraduate program than those without (43.6% vs 21.3%, ��2 (1, n=249)=13.965, P<.001, Cramer’s V=0.237), but the reverse was not true for patients being preferentially assigned to residents (59.3% vs 47.6%, ��2 (1, n=229)=2.970, P=.09). The presence of an NPP postgraduate EM program was not significantly associated with the incidence of teaching or supervision by an NPP in the ED (18.8% vs 11.7%, with and without, respectively, ��2 (1, n=259)=2.483, P=.12).
EM Resident Postgraduate Training Status
Postgraduate year (PGY) status was not associated with a difference in probability of having forfeited a procedure to an NPP in the ED but was during off-service rotations, with 63.0%, 70.9%, and 47.1% of PGY 1, 2, and 3+, respectively, reporting at least one forfeiture, ��2 (2, n=237)=10.101, P<.01, Cramer’s V=0.206. There was no significant difference in the incidence of forfeiting at least one highly educational patient to NPPs across PGY status in the ED [30.0%, 29.1%, 30.4% for PGY 1, 2, 3+, respectively, ��2 (2, n=251)=0.036, P=.98] or off-service rotations [20.6%, 9.5%, 9.0% for PGY 1, 2, 3+, respectively, ��2 (2, n=199)=1.081, P=.58].
DISCUSSION
A substantial majority of EM residents in AAEM-RSA reported that NPPs in the ED have a detracting or greatly detracting impact on their education. The presence of an EM NPP postgraduate training program was associated with a significantly greater median number of forfeited procedures
Volume 24, NO.3: May 2023 591 Western Journal of Emergency Medicine Phillips et al. Effects of Non-physician Practitioners on EM Physician Resident Education
Much lighter Lighter No impact Heavier Much heavier 1.3 45.2 40.1 12.2 1.3 Effect on
documentation
(n=392) Greatly decrease Decrease No effect Increase Greatly increase 1.0 4.8 80.6 11.5 2.0 Effect
Greatly detract Detract No impact Enhance Greatly enhance 11.8 45.0 24.8 18.2 0.3 Effect
(n=393) Greatly detract Detract No impact Enhance Greatly enhance 19.3 47.6 29.8 3.1 0.3
(n=379) Not
at all A little
Moderately confident Quite confident Extremely confident 33.5 26.4 17.9 15.8 6.3
resident
time
on patient care in the emergency department (n=391)
on resident education
confident
confident
Not
Moderately
Quite confident Extremely confident 65.2 24.8 7.1 2.1 0.8
confident
Effects of Non-physician Practitioners on EM Physician Resident
Table 3. Ways in which non-physician practitioners enhance and detract from resident education in the emergency department. Theme No. (%) Example(s)
Enhance No enhancement
Offload lower acuity patients
Miscellaneous
197 (62.9%) “There is no conceivable way that the presence of NP/PA enhances resident education.”
56 (17.9%) “[NPPs] frequently run fast track, which opens the opportunity to see sicker patients without being overloaded with lower acuity complaints.”
34 (10.9%) “We work very independently from the PAs/NP in our department. They cover the ED during resident conference days, so in that way they allow us time for education. However, at our particular institution they do not move patients through the department at quite the same speed as the physicians and so often we come onto shift after conference to a very busy board.”
Resource/Experienced for advice 24 (7.7%) “They have knowledge of the system when you’re starting out.”
“Some PAs have previous experience of working other specialties and can provide clinical insight as well as tips/tricks.”
Practice overseeing NPP
14 (4.5%) “Enhances my sense of the dynamic between attending practitioners and APPs, something I am sure I will deal with later in my career.”
“....practice leading APP practitioners before graduation.”
31
29
“I end up teaching them. I taught one how to do a pelvic exam!”
in the ED take up time and energy from Attending Physician [sic] who need to supervise them. This is time that could be directed at resident education and supervision.”
“Aggressively lobbying leadership for autonomy.”
“They are in a parallel training environment with different standards and often give sub-par advice or worse, aggressive sub-par advice because they consider themselves more advanced.”
NPP, non-physician practitioner; APP, advanced practice practitioner; PA, physician assistant; NP, nurse practitioner.
but not with effects of NPPs on resident perception of education. Additionally, more than one-third of residents reported feeling “not confident at all” that they could approach local leadership about NPP concerns without facing retribution, and almost two-thirds of residents were “not confident at all” that the ACGME would satisfactorily address concerns about NPPs impacting resident education as reported in the oversight body’s year-end survey.
Of further interest are the measures that were not statistically significant. For example, the data do not
show that more experienced senior residents are the ones primarily forfeiting procedures; rather, there was no significant difference by PGY status. Additionally, a higher number of forfeited procedures was significantly associated with a negative effect of NPPs on education, and NPP postgraduate programs were significantly associated with a higher number of forfeited procedures. Nonetheless, NPP postgraduate programs were not significantly associated with a difference in the overall perception of NPP effects on resident education. This finding suggests there is at least
Western Journal of Emergency Medicine 592 Volume 24, NO.3: May 2023
Phillips et al.
Education
patient encounters for learning
(47.7%) “[NPPs]
Fewer procedural opportunities 122 (37.5%) “None.” No detraction 72 (22.2%) “None.” Miscellaneous 36 (11.1%) “I’m
Detract Fewer
155
take all the procedures without seeing the patients.”
expected to spend time educating NP/PA students to train my replacements.”
Monopolizing attending time
(9.5%)
Hostile learning environment
“APPs
(8.9%) “Talk
down to residents…”
APPs generally from the trauma service covering during surgical conferences generally will not defer to ED residents for procedures during trauma resuscitations”
“PA/NP insisted that it was their procedure, and I did not think I was in a position to speak back to them.” Direct
the PA ‘fellow’ to get more experience.”
“The NP/PA asked the attending to do the procedure as part of their training, but they could not take the patient as a primary because of their current volume load.”
“Some attendings preferred to work with nonphysician [practitioners] who they had more experience with than a resident who they only knew for a short period.”
“Because the attending was busy and couldn’t supervise.” None 63 (32%) “None.”
NP/PA had priority due to attending comfort with them.”
“More training.”
Direct competition/trainee 29 (16.4%) “CRNA took anesthesia intubations and only let CRNA students intubate over EM residents.”
“For their educational value.”
NPP stole procedure 7 (4.0%) “There was no reason-they stole it.”
Unit culture 52 (29.7%) “They worked on the unit and oversaw procedures.”
“My senior resident in the MICU was not credentialed to do central lines, fellow/attending were not in house overnight. NPs are not technically allowed to supervise us so she put the central lines in overnight.”
Miscellaneous
28 (15.0%) “Division of labor. I was doing other stuff.”
“I was staffing the PA/NP.” No reason
51 (29.0%) “None”
“No reasons”
NPP, non-physician practitioner; APP, advanced practice practitioner; PA, physician assistant; NP, nurse practitioner; ICU, intensive care unit; CRNA, certified registered nurse anesthetist.
Volume 24, NO.3: May 2023 593 Western Journal of Emergency Medicine Phillips et al. Effects of Non-physician Practitioners on EM Physician Resident Education
Example(s) Emergency department
“Off-service
“They
Table 4. Reasons procedures were forfeited by emergency medicine residents to non-physician practitioners in the emergency department and while off-service.
Theme No. (%)
NPP does not offer 20 (10.2%)
Intimidation 15 (7.6%)
just push their way in and tend to have the support of the administration.”
“For
competition/trainee 61 (31%)
Unit culture 32 (16.7%) “Customary
at that institution. I was a rotator.”
Miscellaneous 18 (9.1%) “Time.”
Off-service
“ICU,
Attending comfort with NPP 14 (7.9%)
NPP more experienced 14 (7.9%) “The PA/NP was more experienced.”
one mitigating factor of NPP postgraduate programs that balances the loss of procedures.
Of note, forfeited procedures reported here are for those patients the residents were primarily managing, procedures for whom the residents were ostensibly responsible. The number of such forfeited procedures was moderately associated with residents’ perception of educational effects, accounting for 14% of the variance; nevertheless, the confluence of data suggests a phenomenon that is far more complex than frustration over fewer opportunities for procedures.
The narrative responses were telling with respect to the hidden curriculum, which is generally described as a construct for the effects of tacit learning as a confluence of culture, structures, and institutions.25 Intimidation and unitculture themes suggest a new facet for a hostile learning environment and conditions that appear to leave physician trainees feeling defenseless. The example quotation from Table 4—“They just push their way in and tend to have the support of the administration” points to a structured, even if unintentional, hidden curriculum that is a hindrance to physician resident education.
The narrative responses also described a loop of exclusion in which residents were told at times that they were required to forfeit their procedure so an NPP could have more experience but also reported times in which they were required to forfeit their procedure because the NPP had more experience than the resident. Findings from the Kang et al study alluded to a similar phenomenon in the operating room for junior residents,8 and it is thus not surprising that narrative responses described problematic relationships with NPPs on off-service rotations as well, putting at jeopardy the value-add of off-service rotations for EM residents.
Comparison to the study of surgical residents by Kang and colleagues bears striking contrasts across items that were replicated in our instrument.8 A full 88% of their respondents reported that NPPs made their workload lighter or much lighter, compared to 46.5% in our study. Similarly, 86% of surgical residents reported that NPPs enhanced or greatly enhanced care, whereas only 18.5% of emergency physicians shared the same opinion in the ED setting. Finally, 47% of surgical residents felt that NPPs enhanced or greatly enhanced their education (with 47% reporting no impact), whereas 66.9% of EM residents reported that an NPP presence detracted or greatly detracted from their education (with 29.8% reporting no impact), which is essentially the inverse of the surgical findings. The perceived workload and educational benefits found in the surgical specialties are not translated in EM from the perspective of EM residents.6,8 The specialized and largely procedural nature of surgical education is distinct from the breadth of case exposure required for EM education. The contrast makes clear that surgical and EM resident cohorts are different, and conclusions cannot be inferred across the two groups.
The conflicting findings in the surgical literature of reduced workload on the one hand but reduced procedural
opportunities on the other was present in EM residents’ responses as well. One of the most frequently cited educational enhancements provided by NPPs in the ED (17.9%) was reduced workload via fewer lower acuity patients to see, thereby allowing an educational emphasis for residents on more complex patients. By the same token, however, one of the most frequently cited detractions from education as a result of NPPs in the ED (47.7%) was the reduction of cases, including lower acuity cases.
As EM societies grapple with this issue, identifying institutional features of the reported positive interactions will be essential to inform best practices to improve the team relationship.4 Within that context, two aspects of structured interaction between NPPs and EM residents must be independently addressed: 1) NPPs in the ED as staff; and 2) NPPs as postgraduate trainees. One resident response in particular was telling with regard to the potential negative impact of the postgraduate programs on physician residents, given the recent report of a novel, parallel track postgraduate physician assistant program:11 “They are in a parallel training environment with different standards and often give [physician residents] sub-par advice or worse, aggressive sub-par advice because they consider themselves more advanced.” It is likely sentiments such as these from physician residents that have led to the AAEM-RSA calling for the cessation of NPP postgraduate programs.26
LIMITATIONS
Our survey asked the survey participants for recall over the course of a full year, which raises the potential for recall bias; however, none was found on the pilot test/retest analysis, supporting item reliability. An additional limitation is that our sampling frame was of a group that did not include every resident in the US and whose members are part of a specific EM society. It is notable that the sampling frame still represents almost three-fifths of all EM residents in the US, a large group indeed. Additionally, most AAEM-RSA members have membership through their programs, suggestive of those programs supporting less involvement of NPPs in resident education if consistent with AAEM and AAEM-RSA position statements. Thus, our findings would be underestimates of the detracting educational effects of NPPs on resident education and of forfeited procedures. It is also worth noting that the other major resident societies, the Emergency Medicine Residents’ Association and the American College of Osteopathic Emergency Physicians’ Resident Student Organization, also signed on to the letter regarding NPP involvement in resident education, underscoring that there is clearly not a bias of our particular cohort.4
Importantly, in this study we evaluated how many procedures and patient opportunities were lost but did not count how many were experienced in total, which is an undoubtedly larger and similarly consequential number. Fourteen lost procedures in a year could represent any
Western Journal of Emergency Medicine 594 Volume 24, NO.3: May 2023
Education Phillips et al.
Effects of Non-physician Practitioners on EM Physician Resident
percentage; the denominator is unknown. Finally, our study focused on the educational aspect of NPPs in the ED from the perspective of EM residents. Staffing models must also account for throughput, cost, and myriad other factors.
Future Study
Although our study focused on physician residents because they were not previously studied, all stakeholders including physician residents, attendings, staff NPPs and NPPs in postgraduate programs, medical directors, and department administrators must be included in addressing what residents report to be a hindrance in their education. Additional study and intervention are warranted regarding residents’ lack of confidence in local leadership and the ACGME. Finally, the findings in this study provide tangible evidence of the theoretical concerns raised by the major EM societies.
CONCLUSION
A strong majority of resident members of AAEM-RSA report that non-physician practitioners in the ED have a detracting impact on their overall education and opportunities for learning cases and procedures, at least in part because of preferential treatment of NPPs. Educational enhancement was reported but limited. Residents overwhelmingly do not have confidence in local or national authorities to address potential concerns about NPPs in the ED impacting their education.
assistant and nurse practitioner utilization in academic medical centers. Am J Med Qual. 2019;34(5):465-72.
4. Moreno LA, Aintablian H, Sutter RE, et al. Joint Statement Regarding Post-Graduate Training of Nurse Practitioners and Physician Assistants. 2020. Available at: https://www.aaem.org/UserFiles/file/ AllEMorgjointstatementrepostgradtrainingofNPandPAs.pdf Accessed April 4, 2023.
5. American Academy of Emergency Medicine. Updated position statement on non-physician practitioners. 2020. Available at: https:// www.aaem.org/resources/statements/position/updated-advancedpractice-providers Accessed April 4, 2023.
6. Eaton B, Hessler L, O’Meara L, et al. The impact of advanced practice providers on the surgical resident experience: Agree to disagree? Am J Surg. 2019;217(6):1107-11.
7. Kahn SA, Davis SA, Banes CT, et al. Impact of advanced practice providers (nurse practitioners and physician assistants) on surgical residents’ critical care experience. J Surg Res. 2015;199(1):7-12.
8. Kang R, Columbo JA, Kunkel ST, et al. Residents’ impressions of the impact of advanced practice providers on surgical training. J Am Coll Surgeons. 2018;226(6):1036-43.
9. Bahouth M, Esposito-Herr MB, Babineau TJ. The expanding role of the nurse practitioner in an academic medical center and its impact on graduate medical education. J Surg Educ. 2007;64(5):282-8.
10. Joffe AM, Pastores SM, Maerz LL, et al. Utilization and impact on fellowship training of non-physician advanced practice providers in intensive care units of academic medical centers: a survey of critical care program directors. J Crit Care. 2014;29(1):112-5.
Address for Correspondence: Andrew W. Phillips, MD, MEd, staff physician, DHR Health Research Institute, 5323 S McColl Rd, Edinburg, TX 78539. Phillips.EM.CCM@gmail.com.
Conflicts of Interest: By the WestJEM article submission agreement, all authors are required to disclose all affiliations, funding sources and financial or management relationships that could be perceived as potential sources of bias. No author has professional or financial relationships with any companies that are relevant to this study. There are no conflicts of interest or sources of funding to declare.
Copyright: © 2023 Phillips et al. This is an open access article distributed in accordance with the terms of the Creative Commons Attribution (CC BY 4.0) License. See: http://creativecommons.org/ licenses/by/4.0/
11. Tsyrulnik A, Goldflam K, Coughlin R, et al. Implementation of a physician assistant emergency medicine residency within a physician residency. West J Emerg Med. 2021;22(1):45-8.
12. Tsyrulnik A, Goldflam K, Coughlin R, et al. Response to “Implementation of a physician assistant emergency medicine residency within a physician residency.” West J Emerg Med 2021;22(1):49.
13. Gehlbach H, Artino AR. The survey checklist (manifesto). Acad Med. 2018;93(3):360-6.
14. Phillips AW, Durning SJ, Artino AR. (2021). Survey Methods for Medical and Health Professions Education: A Six-Step Approach New York, NY: Elsevier.
15. Phillips AW. Proper applications for surveys as a study methodology. West J Emerg Med. 2017;18(1):8-11.
REFERENCES
1. Chekijian SA, Elia TR, Horton JL, et al. A Review of interprofessional variation in education: Challenges and Considerations in the Growth of Advanced Practice Providers in Emergency Medicine. AEM Educ Train. 2021;5(2):e10469.
2. Moote M, Krsek C, Kleinpell R, et al. Physician assistant and nurse practitioner utilization in academic medical centers. Am J Med Qual 2011;26(6):452-60.
3. Moote M, Krsek C, Kleinpell R, et al. Republished: Physician
16. Artino AR, Rochelle JSL, Dezee KJ, et al. Developing questionnaires for educational research: AMEE Guide No. 87. Med Teach 2014;(36):463-74.
17. Phillips AW, Reddy S, Durning SJ. Improving response rates and evaluating nonresponse bias in surveys: AMEE Guide No. 102. Med Teach. 2016;38(3):217-28.
18. Cook DA, Kuper A, Hatala R, et al. When assessment data are words: Validity evidence for qualitative educational assessments. Acad Med. 2016;91(10):1359-69.
19. AAMC. Report on residents. 2020. Available at: https://www.aamc. org/data-reports/students-residents/report/report-residents Accessed
Volume 24, NO.3: May 2023 595 Western Journal of Emergency Medicine
Resident Education
Phillips et al. Effects of Non-physician Practitioners on EM Physician
Effects of Non-physician Practitioners on EM Physician Resident Education
April 4, 2023.
20. ACGME. Emergency medicine defined key index procedure minimums. 2017. Available at: https://www.acgme.org/Portals/0/ PFAssets/ProgramResources/EM_Key_Index_Procedure_ Minimums_103117.pdf?ver=2017-11-10-130003-693 Accessed April 4, 2023.
21. Rappleye E. 28 States with full practice authority for NPs. Becker’s Hospital Review. 2019. Available at: https://www. beckershospitalreview.com/hospital-physician-relationships/28states-with-full-practice-authority-for-nps.html?oly_enc_ id=4391H9381767E4I Accessed April 4, 2023.
22. Kim HY. Statistical notes for clinical researchers: assessing normal
distribution using skewness and kurtosis. Restor Dent Endod 2013;38(1):52-4.
23. Saldana J. (2013). The Coding Manual for Qualitative Researchers 2nd ed. New York, NY: Sage.
24. O’Brien BC, Harris IB, Beckman TJ, et al. Standards for reporting qualitative research: A synthesis of recommendations. Acad Med 2014;89(9):1245-51.
25. Martimianakis MA, Michalec B, Lam J, et al. Humanism, the hidden curriculum, and educational reform. Acad Med. 2015;90(11):S5-13.
26. Aintablian H. An open letter to the specialty of emergency medicine. 2021. Available at: https://www.aaemrsa.org/about/positionstatements/specialty-of-em Accessed April 4, 2023.
Western Journal of Emergency Medicine 596 Volume 24, NO.3: May 2023
Phillips et al.
Effectiveness of Hospital-directed Wellness Interventions in COVID-19: A Cross-sectional Survey
Adrian Cotarelo, MD, MHS*†‡
Mary McLean, MD*§||
Nishad Rahman, MD*#¶
Alina Mitina, DO*
Brenda Alves, BA***
Miriam Kulkarni, MD*||
St. John’s Riverside Hospital, Department of Emergency Medicine, Yonkers, New York
Fire Department of the City of New York, FDNY Office of Medical Affairs, Brooklyn, New York
Northwell Health at North Shore/Long Island Jewish Medical Center, Department of Emergency Medicine, Long Island, New York
AdventHealth Orlando, Department of Emergency Medicine, Orlando, Florida
Lake Erie College of Osteopathic Medicine, Erie, Pennsylvania
LifeBridge Health, Department of Emergency Medicine, Baltimore, Maryland
United States Acute Care Solutions, Department of Clinical Innovation, Canton, Ohio Pace University College of Health Professions, Physician Assistant Studies Program, Pleasantville, New York
Section Editor: Jacob Manteuffel, MD
Submission history: Submitted May 11, 2022; Revision received January 31, 2023; Accepted January 24, 2023
Electronically published March 22, 2023
Full text available through open access at http://escholarship.org/uc/uciem_westjem
DOI: 10.5811/westjem.57306
Introduction: Hospitals have implemented various wellness interventions to offset the negative effects of coronavirus disease 2019 (COVID-19) on emergency physician morale and burnout. There is limited high quality evidence regarding effectiveness of hospital-directed wellness interventions, leaving hospitals without guidance on best practices. We sought to determine intervention effectiveness and frequency of use in the spring/summer 2020. The goal was to facilitate evidence-based guidance for hospital wellness program planning.
Methods: This cross-sectional observational study we used a novel survey tool piloted at a single hospital and then distributed throughout the United States via major emergency medicine (EM) society listservs and closed social media groups. Subjects reported their morale levels using a slider scale from 1 (lowest) to 10 (highest) at the time of the survey and, retrospectively, at their respective COVID-19 peak in 2020. Subjects also rated effectiveness of wellness interventions using a Likert scale from 1 (not at all effective) to 5 (very effective). Subjects indicated their hospital’s usage frequency of common wellness interventions. We analyzed results using descriptive statistics and t-tests.
Results: Of 76,100 EM society and closed social media group members, 522 (0.69%) subjects were enrolled. Study population demographics were similar to the national emergency physician population. Morale at the time of the survey was worse (mean [M] 4.36, SD 2.29) than the spring/summer 2020 peak (M 4.57, SD 2.13) [t(458)=-2.27, P=0.024]. The most effective interventions were hazard pay (M 3.59, SD 1.12), staff debriefing groups (M 3.51, SD 1.16), and free food (M 3.34, SD 1.14). The most frequently used interventions were free food (350/522, 67.1%), support sign display (300/522, 57.5%), and daily email updates (266/522, 51.0%). Infrequently used were hazard pay (53/522, 10.2%) and staff debriefing groups (127/522, 24.3%).
Conclusion: There is discordance between the most effective and most frequently used hospital-directed wellness interventions. Only free food was both highly effective and frequently used. Hazard pay and staff debriefing groups were the two most effective interventions but were infrequently used. Daily email updates and support sign display were the most frequently used interventions but were not as effective. Hospitals should focus effort and resources on the most effective wellness interventions. [West J Emerg Med. 2023;24(3)597–604.]
Volume 24, NO.3: May 2023 597 Western Journal of Emergency Medicine * † ‡ § || # ¶ ** Original Research
Effectiveness of Hospital-directed Wellness Interventions in COVID-19
INTRODUCTION Background
Burnout was already an issue for half of United States (US) emergency physicians (EP) in the years leading up to the coronavirus disease 2019 (COVID-19) pandemic.1-6 A national survey conducted from 2011–2014 revealed that physicians in frontline specialties are at greatest risk of burnout,7 and a 2018 review suggested that healthcare organizations already had insufficient basic resources to support physician wellness.8 Attempts have been made to ameliorate this concerning trend. Particularly among emergency medicine (EM) residency programs, over 162 unique wellness interventions have been described. The most commonly addressed themes of these interventions were program factors such as culture; environmental and clinical factors; and wellness activities, practices, and resources.9 Despite the implementation of these numerous interventions, a review study found that prior to the COVID-19 pandemic there has been little high mquality literature assessing the effectiveness of wellness interventions targeting EM residents.10
During the 2020 COVID-19 surges, EPs reported increased work-related anxiety, emotional exhaustion, and burnout.11 Despite these reports, the EP burnout rate showed a modest increase from 43% in 20196 to 44% in the fall 2020.12 However, the issue of burnout has worsened markedly since then, even as the initial COVID-19 surges have waned.13-14 Among EM residents who worked during surges, 35% experienced acute post-traumatic symptoms.15 Common causes have been found to center around the themes of moral distress regarding patient deaths, resource allocation/scarcity, personal safety, economic insecurity, social/family life disruption, stigmatization of healthcare workers, and a sense of powerlessness.16
Recent COVID-19 pandemic-era literature has discussed how best to mitigate this issue. Some have recommended taking steps to improve healthcare workers’ exercise, food, and diet practices,17 but as Li-Sauerwine et al discuss,9 these recommendations are limited to personal factors as indicated by the National Academy of Medicine Model of Clinician Well-Being and Resilience.8 Specifically among EM residency programs, many have implemented additional wellness interventions beyond the minimum requirements of the Accreditation Council for Graduate Medical Education (ACGME),18 such as obtaining outside food donations, holding virtual social gatherings, and establishing new wellness/respite spaces.19 However, lack of high quality evidence on intervention effectiveness leaves hospitals and residency programs to guess which methods will work.
One study conducted in November 2020 revealed that several themes increased feelings of joy and fulfillment for frontline healthcare workers, including meaningful practitioner-patient interactions, team camaraderie, teaching/ mentoring, physical activity, and time with family/friends.20 Thus far in the COVID-19 pandemic, the best evidence-based
Population Health Research Capsule
What do we already know about this issue? Hospitals implemented wellness interventions to offset the effects of COVID-19 on physician morale, but there is little evidence-based guidance on their effectiveness.
What was the research question?
What is the perceived effectiveness of hospital-directed wellness interventions on emergency physicians’ morale?
What was the major finding of the study? Hazard pay, debriefing groups, and free food were the most effective interventions. Of these three, only free food was frequently implemented.
How does this improve population health? This study provides guidance for hospitals to refocus their wellness planning efforts to use the most effective interventions.
recommendations for hospital wellness interventions have been to focus on the following resources: social, leadership, financial, and mental health support; meeting safety needs; and providing childcare options.21 One specific intervention—a facilitated physician peer-support group model—was piloted across 10 hospitals and showed promise in improving anxiety, depression, distress, and burnout.22 However, no study has asked participants to rate the effectiveness of hospital wellness interventions during the COVID-19 pandemic era.
OBJECTIVES
We aimed to assess the effectiveness and use of hospitaldirected wellness interventions from the perspective of EPs in the first surges of the COVID-19 pandemic in the US. The goal was to provide evidence-based recommendations for future hospital wellness plans both during and after COVID-19 surges. The hypotheses were that some hospitaldirected wellness interventions are significantly more effective to subjects’ personal well-being than others; that some highly effective interventions are infrequently used; and that some ineffective interventions are frequently used.
METHODS Human Subjects
This study was approved as exempt by the institutional review board. Study procedures were disclosed to subjects
Western Journal of Emergency Medicine 598 Volume 24, NO.3: May 2023
Cotarelo et al.
prior to answering an informed consent question at the beginning of the survey. The survey was anonymous.
Study Setting and Population
This cross-sectional survey used convenience sampling in a virtual setting. No incentives were offered. Those who took the survey included EP attendings, fellows, and residents practicing or training in the US and outlying territories. Included were subjects who completed the “Information, Consent, and Demographics” page of the survey and answered at least one question in the “Wellness Initiatives” page. We analyzed the subjects’ data only for the questions the participants answered. We excluded subjects who completed only the “Information, Consent, and Demographics” section.
Survey Development and Pilot Testing
Survey content was developed by author team consensus, with additional guidance from a townhall-style discussion with 25 attending and resident EPs at the primary institution on May 20, 2020. All attendees at this townhall had the lived experience of practicing medicine in the emergency department and/or intensive care unit during spring 2020 in Westchester County, NY, which was the second hardest hit county in New York State as of July 1, 2020, based on COVID-19 case numbers per capita.23 Two senior authors were also members of regional groups of academic institutions that had met and discussed EP wellness challenges and hospital responses.
See Appendix A for the recruitment script. See Appendix B for the complete survey tool including informed consent. In addition to hospital demographic information, we included questions about hospital-directed wellness interventions. Subjects’ reports of intervention effectiveness on their own personal wellness were assessed using a Likert scale from 1 (not at all effective) to 5 (very effective). We assessed the subjects’ reports of their personal morale levels using a slider scale from 1 (lowest) to 10 (highest) at time of survey and, retrospectively, at the first US COVID-19 surge peak in spring/summer 2020. Subjects were also given the opportunity to contribute freetext comments on wellness interventions they wish had been offered, other things that may have improved morale, and additional suggestions or comments. We collected this freetext data for the purpose of future thematic analysis (a planned future direction for this research group), but this data was not employed in the present study.
The survey was sent to a pilot group of resident and attending physicians at a single hospital for clarity and usability feedback, and for preliminary analysis, prior to national-scale distribution. No clarity or usability issues were cited, and no changes to the survey instrument were required prior to national distribution.
Study Protocol and Statistical Analysis
We used the electronic platform SurveyMonkey (SurveyMonkey Enterprise, San Mateo, CA) to construct and distribute the survey. In deciding on survey distribution methods,
we aimed to reach the largest and most diverse group of EPs possible. To achieve this aim, we used listservs associated with The American College of Emergency Physicians (ACEP), the Council of Residency Directors in Emergency Medicine (CORD), and the Society for Academic Emergency Medicine (SAEM), and posts on two closed Facebook social media groups EMDocs and Emergency Physician Forum. These organizations and groups had a collective membership of 76,100 members at the time of data collection from July 25–August 9, 2020. (See Appendix C for medical society listserv and closed Facebook group membership numbers at the time of survey distribution and active data collection.).
Recruitment occurred online via listserv email invitations and closed social media group posts, including ACEP, CORD, SAEM, and the closed Facebook groups EMDocs and Emergency Physician Forum. We determined these platforms to be the most accessible for the wider population of EPs. On average, two contacts were attempted on each of these five platforms. We analyzed data with descriptive statistics and paired t-tests using R version 3.6.1 for Windows (R Foundation for Statistical Computing, Vienna, Austria). In reporting results of the study, we used the recommendations outlined by STROBE (Strengthening the Reporting of Observational studies in Epidemiology). See Appendix D for the STROBE checklist used.
RESULTS Pilot Data
Of 16 pilot subjects who completed the survey from June 29–July 10, 2020, two (12.5%) were attending physicians and 14 (87.5%) were resident physicians. Preliminary analyses of pilot data showed the most effective interventions to be hazard pay (mean [M] 4.5, SD 0.78), free food at work (M 4.2, SD 0.97), and staff debriefing groups (M 3.4, SD 1.3). Also, morale was reported to be lower at the time of the pilot survey (M 3.8, SD 2.3) than during the first peak (M 5.1, SD 2.3). The pilot population and main population demographics were dissimilar in terms of practice location and breakdown of participant level of training. However, the major study outcomes of personal morale and perceived intervention effectiveness were found to follow the same patterns. Thus, we incorporated the pilot data into the main analysis.
Enrollment and Demographics
A total of 566 subjects logged into the survey, and 522 subjects were enrolled. The barriers to calculating a response rate are discussed in the “Limitations” section of this paper. The enrollment flowsheet is shown in Figure 1. Study group demographic characteristics are shown in Table 1. Participation by US region is depicted in Figure 2.
Main Results
Morale at the time of the survey (M 4.36, SD 2.29) was significantly worse than morale during the initial spring/summer surge (M 4.57, SD 2.13); [t(458)=-2.27, P=0.02). See Table 2 for
Volume 24, NO.3: May 2023 599 Western Journal of Emergency Medicine
et al.
Cotarelo
in COVID-19
Effectiveness of Hospital-directed Wellness Interventions
frequency and effectiveness of hospital wellness interventions. See Figure 3 for the ranking of hospital wellness interventions based on participant reports of effectiveness on their personal wellness. See Table 3 for analyses of hazard pay amounts, the details of which are provided because hazard pay was ranked as the most effective hospital-directed wellness intervention.
DISCUSSION
Effectiveness of Interventions
The most effective intervention was found to be hospitalsponsored hazard payment. This was also one of the least
ENC,


frequently used interventions. It appears to be a relatively novel intervention, and we were unable to find any previous research regarding the effectiveness of such hospitalsponsored hazard pay. Subjects’ reported hazard payment amounts ranged remarkably. It is interesting to note that 48% of the subjects who reported a non-zero payment and answered the hazard pay sufficiency question felt the amount was sufficient. Attending and fellow physicians found hazard pay amounts to be sufficient more frequently than resident physicians, but the mean hazard pay reported by attendings and fellows was higher than for residents.
Notably, we found that staff debriefing groups were also a highly effective intervention, although this was only reported by 25% of the subjects. This is a low-cost intervention that could be quickly implemented and should be within the capacity of every hospital. This is consistent with the work of Schneider and Weigi, who found that peer support and pay were associated with improved practitioner well-being,25 and with other studies that have found peer support groups to be effective in supporting practitioner wellness.26 The results of this study support the use of peer support groups to promote wellness during pandemics or other times of stress. The only other interventions that had greater-than-average effectiveness ratings were free food at work and “thank you” cards.
The most frequent interventions were free food, support sign display, and daily email updates. These interventions may require very few hospital resources to accomplish. For example, it is possible that free food at work may have been subsidized by numerous different sources, including the hospital itself or by local community members or businesses that wished to show appreciation. It is important to acknowledge that any food provided by the hospital itself
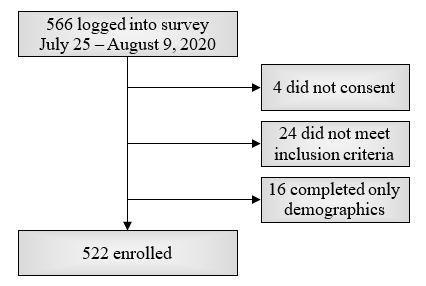
Western Journal of Emergency Medicine 600 Volume 24, NO.3: May 2023 Effectiveness of Hospital-directed Wellness Interventions in COVID-19 Cotarelo et al.
Figure 1. Enrollment flowsheet. Included were consenting EP attendings, fellows, and residents currently practicing or training in the US and outlying territories who answered questions in both the “Demographics” and “Wellness Initiatives” sections of the survey.
Measure n (%) Level of training Attending 436 (83.52%) Fellow 16 (3.07%) Resident 70 (13.41%) Hospital setting Urban 279 (53.45%) Suburban 171 (32.76%) Rural 64 (12.26%) Other 8 (1.53%) Hospital type Academic/university 213 (40.80%) Community 268 (51.34%) County 22 (4.21%) Other 19 (3.63%)
Table 1. Study population demographic characteristics. “Other” hospital types include military, Veterans Administration, and all other reported types.
Figure 2. Subjects by United States region. Regional breakdown based on prior emergency physician workforce studies. Puerto Rico was included in the South Atlantic region.
East North Central; ESC, East South Central; MA, Mid Atlantic; NE, Northeast; SA, South Atlantic; WNC, West North Central; WSC, West South Central.
Cotarelo et al.
Effectiveness of Hospital-directed Wellness Interventions in COVID-19
Table 2. Descriptive data on frequency and effectiveness of hospital-directed COVID-19 wellness interventions, as reported by emergency physicians in the United States.
Effectiveness (1-5)
*“Public acknowledgment/displays” includes applause for hospital staff, military jets overhead, emergency medical services/fire department/police display of lights/sirens, etc.
†“Daily email updates” are emails to employees by hospital administration or other staff. COVID-19, coronavirus disease 2019.
counseling on demand available to their residents.18 Also among the least effective interventions was the practice of playing a “victory” song overhead in the hospital for COVID-19 patient successes, purported to boost morale. We had a particular interest in this intervention because of the potential for overhead “victory” songs to interrupt conversations at inopportune times (eg, during delivery of bad news to loved ones of patients).
External Validity
Not At All < Effectiveness > Very Figure 3. Ranking of hospital-directed wellness intervention effectiveness on a Likert scale from 1 (not at all effective) to 5 (very effective). Error bars represent the 95% confidence interval. COVID-19, coronavirus disease 2019.
(not by the community in the outpouring of support during the surges) may have had different effects on physician wellness; however, this was not something the survey tool assessed.
Among the least effective interventions was the presence of psychiatric/psychological support services. Only 36% of subjects reported having psychiatric or counseling services made available to them by their hospital. This was surprising because providing counseling services is frequently recommended to improve physician wellness after exposure to stressful or traumatic events. In fact, residency programs are required by the ACGME to make
The survey instrument content was not based on any prior validated assessment but was developed by consensus of EP residents and attendings with the lived experience of working during a significant COVID-19 surge and was piloted prior to national distribution. The survey items were carefully constructed and closely related to the research questions.
In terms of population validity, while we do believe that using large medical societies and closed social media groups as key recruitment platforms maximized inclusivity, this brings external validity into question because not all EPs are members of medical societies or closed social media groups. The study sample was, however, largely representative of the overall US EP population in terms of the demographic characteristics collected. At the time of data collection, there were 8,642 EM residents27 and 48,835 active EPs in the US.24 The regional distribution and urban rural distribution of subjects adequately mirrors the demographics of the EM workforce as described in Table 4. No information on breakdown of greater population hospital type was available.
Volume 24, NO.3: May 2023 601 Western Journal of Emergency Medicine
Intervention Frequency (%) Median Mean (SD) Hazard pay 53 (10.2%) 4 3.59 (1.12) Staff debriefing groups 127 (24.3%) 4 3.51 (1.16) Free food at work 350 (67.1%) 3 3.34 (1.14) Community “thank you” card display 254 (48.7%) 3 3.21 (1.11) Public acknowledgment/displays* 231 (44.3%) 3 2.96 (1.24) Daily email updates† 266 (51.0%) 3 2.90 (1.25) Support sign display 300 (57.5%) 3 2.87 (1.14) Celebrating COVID-19 discharges 92 (17.7%) 3 2.85 (1.23) Psychiatric/psychological services 188 (36.0%) 3 2.55 (1.12) “Victory” song overhead 100 (19.2%) 2 2.09 (1.12) Other support 17 (3.26%) N/A N/A No support 23 (4.41%) N/A N/A
1 2 3 4 5 Victory song overhead Psychiatric/psychological services Celebrating COVID-19 discharges Support sign display Daily email updates Public acknowledgement/displays Community thank-you card display Free food at work Staff debriefing groups Hazard pay
Effectiveness of Hospital-directed Wellness Interventions in COVID-19
that EPs have experienced the highest burnout rate of all medical specialties.
Although the US case positivity rate was drastically different between Ebola and COVID-19, we do speculate that the Ebola scare was a significant factor in the 2015 and 2016 burnout rates. Even with low case positivity rates in the US, the Ebola epidemic took a psychological toll on healthcare workers.29 The reason for the delayed rise in burnout after these pandemic/epidemic scares is likely multifactorial. The American Psychological Association (APA) argues that although longer work hours and home demands have been commonplace since the first surges, these stressors have now become persistent and indefinite, and exposure to such chronic states of stress increases the risk of burnout.30 The APA also cites public resistance to COVID-19 prevention measures as another potential persistent stressor that may affect frontline workers in particular.30
*Greater population level of training was based on 2020 Accreditation Council for Graduate Medical Education reports.27 †Greater population region was based on the 2020 Workforce report.24
‡Greater population geographic setting was based on the 2020 Workforce report,24 which uses only urban or rural categories, consistent with modern Urban Influence Codes.28 Subjects reporting suburban setting are categorized as urban. EP, emergency physician.
Lastly, we used a specific disaster, the COVID-19 pandemic, to measure EP personal morale and perceived effectiveness of hospital-directed wellness interventions. However, we do believe our findings have transferability to other contexts such as future epidemics, pandemics, natural disasters, and other situations that increase stressors on EPs and put them at higher risk of burnout and low morale.
Big-picture Meaning
Trends in the burnout rates for EPs can be followed over the past decade from large annual survey reports. The reports reveal two peaks in EP burnout, both closely trailing epidemic/pandemic scares in the US. The first peak was in 2016, two years after the Ebola virus was detected in the US. (EP burnout rates were 52% in 2014,1 55% in 2015,2 and 59% in 20163 – an all-time high for EM at the time –before dropping to 45% in 20174). The trend following the COVID-19 pandemic has mirrored the trend following the Ebola epidemic, with EP burnout rates at 44% in 2020,12 60% in 2021,13 and 65% in 2022.14 This 2022 figure is another all-time high, and 2022 is the second year in a row
Although our subjects were surveyed at varied times relative to their local COVID-19 surge, the majority did report that their morale at the time of the survey was worse than during their respective surge peak. This information, and the annual EP survey of burnout trends, not only suggests that there is a correlation between low morale/ high burnout and epidemic/pandemic scares, but also that the detrimental psychological effects on physicians last long after disease incidence wanes. While overall hospital admission rates for COVID-19 are significantly lower than peak rates,31 the pandemic has been ongoing now for more than two years, with unprecedented effects on clinician wellness. Our study shows that common hospital-directed wellness interventions vary greatly in effectiveness, and continued research is necessary to identify targeted interventions that can assist hospitals in supporting their EPs as the pandemic continues, even as COVID-19 rates continue to decrease in the US.
LIMITATIONS
The survey was an original and unvalidated tool. Although it was piloted at a single, suburban community hospital to glean preliminary evidence of response process validity and improve the survey prior to national distribution, the pilot group was not representative of the main study population in terms of attending/resident breakdown. However, data trends for main outcomes were similar between the pilot and main study populations. One limitation in survey tool clarity that was not brought up in the pilot is that subjects may have had different definitions of “informal staff-debriefing groups,” which may have impacted the reported frequency and effectiveness of this intervention.
Subjects were surveyed during a discrete two-week timeframe, but surges at their hospitals peaked on various dates. Thus, there was potential for varied degrees of recall bias, particularly regarding retrospective morale levels. The effectiveness of interventions may also vary based on
Western Journal of Emergency Medicine 602 Volume 24, NO.3: May 2023
Cotarelo et al.
Demographic characteristic Study population (%) EP workforce (%) Level of training* Attending (Including Fellows) 87 85 Resident 13 15 Region† New England 5 6 Mid Atlantic 17 12 East North Central 15 15 West North Central 9 6 South Atlantic 20 20 East South Central 5 5 West South Central 9 11 Mountain 7 9 Pacific 13 17 Geographic Setting‡ Urban 86 92 Rural 14 8
Table 4. Study population vs emergency physician workforce demographics.
their timing relative to peaks and valleys in COVID-19 incidence; this was not possible to measure with the methodology used.
Study enrollment was voluntary (specifically, a voluntary response sampling method was used), and thus the survey results were vulnerable to self-selection bias (ie, some participants were inherently more likely to volunteer). In using this method, subjects with strong feelings about hospital-directed wellness interventions may have been more likely to participate, and subjects with neutral feelings may have been unintentionally excluded. We believe this source of bias would have increased the variability of reports of morale and intervention effectiveness (stronger subject opinions on both sides). Similarly, non-response bias may also have resulted from failure to enroll potential subjects who had experienced the peak of their local surge closer to the two-week survey administration period and were working longer hours or otherwise preoccupied. Given the trend in reported morale levels, the potential exclusion of these subjects may have biased our sample toward increased changes in pre/post-surge morale reports, as well as decreased absolute morale levels at the time of survey administration. Our sample also included a heterogeneous group of attendings, fellows, and residents with different wellness needs.
We were unable to precisely calculate response rate. Medical society members do not necessarily check organizational message boards, and may ignore, delete, or opt out of listserv emails. The rate of dual membership in these medical societies and groups could not be determined, thereby further limiting our response rate calculation; however, we acknowledge that dual membership is common and, thus, we speculate that we reached out to far fewer than 76,100 potential subjects. To mitigate this issue, future studies will use a more structured method of direct email contact and open rate tracking to obtain response-rate denominators. Further research will also employ thematic analysis of the free-text commentary provided by subjects in this survey, the results for which were extensive but outside the scope of the present study. Further research is also necessary to directly measure the effect of these interventions on burnout (rather than subjective effectiveness ratings).
CONCLUSION
There is discordance between the most effective and most frequently used hospital-directed wellness interventions. Only free food was both highly effective and frequently used. Hazard pay and staff debriefing groups were the two most effective interventions but were infrequently used. Daily email updates and support sign display were the most frequently used interventions but were not as effective. Hospitals should consider the relative effectiveness of these wellness interventions when deciding where to focus their efforts and resources.
Address for Correspondence: Adrian Cotarelo, MD, MHS, Fire Department of the City of New York/Northwell Health, 9 Metrotech Center, Brooklyn, NY 11201. Email: acotarelo@northwell.edu.
Conflicts of Interest: By the WestJEM article submission agreement, all authors are required to disclose all affiliations, funding sources and financial or management relationships that could be perceived as potential sources of bias. No author has professional or financial relationships with any companies that are relevant to this study. There are no conflicts of interest or sources of funding to declare.
Copyright: © 2023 Cotarelo et al. This is an open access article distributed in accordance with the terms of the Creative Commons Attribution (CC BY 4.0) License. See: http://creativecommons.org/ licenses/by/4.0/
REFERENCES
1. Peckham C. Medscape Physician Lifestyle Report 2015. WebMD LLC; 2015:2. Available at; https://www.medscape.com/slideshow/ lifestyle-2015-overview-6006535#2. Accessed May 1, 2020.
2. Peckham C. Medscape Lifestyle Report 2016: Bias and Burnout. WebMD LLC; 2016:2. Available at: https://www.medscape.com/ slideshow/lifestyle-2016-overview-6007335#2. Accessed May 1, 2020.
3. Peckham C. Medscape Medscape Lifestyle Report 2017: Race and Ethnicity, Bias and Burnout. WebMD LLC; 2017:2. Available at: https://www.medscape.com/features/slideshow/lifestyle/2017/ overview#page=2. Accessed May 1, 2020.
4. Peckham C. Medscape National Physician Burnout & Depression Report 2018. WebMD LLC; 2018:2. Available at: https://www. medscape.com/slideshow/lifestyle-2016-overview-6007335#2. Accessed May 1, 2020.
5. Martin K. Medscape Physician Lifestyle & Happiness Report 2019. WebMD LLC; 2019:3. Available at: https://www.medscape.com/ slideshow/2019-lifestyle-happiness-6011057#3. Accessed May 1, 2020.
6. Kane L. Medscape National Physician Burnout & Suicide Report 2020: The Generational Divide. WebMD LLC; 2020:2. Available at: https://www.medscape.com/slideshow/2020-lifestyleburnout-6012460#2. Accessed May 1, 2020.
7. Shanafelt T, Hasan O, Dyrbye L, et al. Changes in burnout and satisfaction with work-life balance in physicians and the general US working population between 2011 and 2014. Mayo Clin Proc 2015;90(12):1600-13.
8. Brigham T, Barden C, Legreid Dopp A, et al. A journey to construct an all-encompassing conceptual model of factors affecting clinician wellbeing and resilience. NAM Perspect. 2018;8(1).
9. Li-Sauerwine S, Rebillot K, Chung A, et al. Moving beyond personal factors: a national study of wellness interventions in emergency medicine residency programs. AEM Educ Train. 2021;5(4).
10. Chung A, Mott S, Rebillot K, et al. Wellness Interventions in emergency medicine residency programs: review of the literature since 2017. West J Emerg Med. 2021;22(1).
Volume 24, NO.3: May 2023 603 Western Journal of Emergency Medicine Cotarelo et al.
Wellness Interventions in COVID-19
Effectiveness of Hospital-directed
Effectiveness of Hospital-directed Wellness Interventions in COVID-19
11. Rodriguez RM, Montoy JCC, Hoth KF, et al. Symptoms of anxiety, burnout, and PTSD and the mitigation effect of serologic testing in emergency department personnel during the COVID-19 pandemic. Ann Emerg Med. 2021;78(1):35-43.e2.
12. Kane L. ‘Death by 1000 Cuts’: Medscape National Physician Burnout & Suicide Report 2021. WebMD LLC; 2021:2. Available at: https:// www.medscape.com/slideshow/2021-lifestyle-burnout-6013456#2.
Accessed February 1, 2022.
13. Kane L. Physician Burnout & Depression Report 2022: Stress, Anxiety, and Anger. WebMD LLC; 2022:2. Available at: https:// www.medscape.com/slideshow/2022-lifestyle-burnout-6014664#2.
Accessed February 1, 2022.
14. Kane L. ‘I Cry but No One Cares’: Physician Burnout & Depression Report 2023. WebMD LLC; 2023:2. Available at: https://www. medscape.com/slideshow/2023-lifestyle-burnout-6016058#2.
Accessed January 29, 2023.
15. Chang J, Ray J, Joseph D, et al. Burnout and post-traumatic stress disorder symptoms among emergency medicine resident physicians during the COVID-19 pandemic. West J Emerg Med. 2022;23(2):251-7.
16. Adibe B, Hebert C, Perticone K, et al. Creating wellness in a pandemic: a practical framework for health systems responding to COVID-19. NEJM Catal Innov Care Deliv. 2021.
17. Huecker M, Shreffler J, Danzl D. COVID-19: optimizing healthcare provider wellness and posttraumatic growth. Am J Emerg Med 2021;46:693-4.
18. Accreditation Council for Graduate Medical Education. ACGME Common Program Requirements Section VI with Background and Intent. Chicago: ACGME; 2017:9-12. Available at: https://www. acgme.org/globalassets/PFAssets/ProgramRequirements/CPRs_ Section-VI_with-Background-and-Intent_2017-01.pdf. Accessed January 1, 2022.
19. Waseem M, Garg N, Chang B, et al. Impact of COVID-19 on emergency medicine residency programs: a cross-sectional study in New York State. West J Emerg Med. 2022;23(2):246-50.
20. Kelker H, Cushman E, Munson C, et al. Identifying factors that contribute to joy and gratitude for emergency medicine healthcare workers amidst the COVID-19 pandemic. Ann Emerg Med 2021;78(4):S100.
21. Kelker H, Yoder K, Musey P, et al. Prospective study of emergency medicine provider wellness across ten academic and community hospitals during the initial surge of the COVID-19 pandemic. BMC
Emerg Med. 2021;21(1).
22. Nault Connors J, Thornsberry T, Hayden J, et al. Facilitated peer support model offers promising mental health intervention for emergency physicians during the post-pandemic period. Ann Emerg Med. 2021;78(2):S6.
23. Tracking coronavirus in New York: latest map and case count. 2021. Available at: https://www.nytimes.com/interactive/2020/us/new-yorkcoronavirus-cases.html. Accessed January 13, 2023.
24. Bennett C, Sullivan A, Ginde A, et al. National study of the emergency physician workforce, 2020. Ann Emerg Med 2020;76(6):695-708.
25. Schneider A, Weigl M. Associations between psychosocial work factors and provider mental well-being in emergency departments: a systematic review. PLoS One. 2018;13(6):e0197375.
26. Huang L, Harsh J, Cui H, et al. A randomized controlled trial of Balint groups to prevent burnout among residents in China. Front Psychiatry. 2020;10.
27. Accreditation Council for Graduate Medical Education. Data Resource Book Academic Year 2019-2020. Chicago: Accreditation Council for Graduate Medical Education; 2022:4960. Available at: https://www.acgme.org/globalassets/pfassets/ publicationsbooks/2019-2020_acgme_databook_document.pdf. Accessed May 10, 2022.
28. Urban Influence Codes. U.S. Department of Agriculture. 2013. Available at: https://www.ers.usda.gov/data-products/urban-influencecodes. Accessed May 1, 2022.
29. Paladino L, Sharpe R, Galwankar S, et al. Reflections on the Ebola public health emergency of international concern, part 2: the unseen epidemic of posttraumatic stress among health-care personnel and survivors of the 2014-2016 Ebola outbreak. J Glob Infect Dis 2017;9(2):45-50.
30. Abramson A. Burnout and stress are everywhere. American Psychological Association: Monitor on Psychology. 2022. Available at: https://www.apa.org/monitor/2022/01/specialburnout-stress#:~:text=From%20longer%20work%20hours%20 to,heightening%20everyone’s%20risk%20of%20burnout. Accessed January 14, 2023.
31. Centers for Disease Control and Prevention. New Admissions of Patients with Confirmed COVID-19, United States. COVID Data Tracker. 2020. Available at; https://covid.cdc.gov/covid-datatracker/#new-hospital-admissions. Accessed May 10, 2022.
Western Journal of Emergency Medicine 604 Volume 24, NO.3: May 2023
Cotarelo et al.
End-tidal Carbon Dioxide + Return of Spontaneous Circulation After Cardiac Arrest (RACA) Score to Predict Outcomes After Out-of-hospital Cardiac Arrest
Cheng-Yi Wu, MD*
Tsung-Chien Lu, MD, PhD*†
Pei-I Su, MD*
Chu-Lin Tsai, MD, ScD*†
Joyce Tay, MD*
Meng-Che Wu, MD*
Eric H Chou, MD‡§
Chih-Hung Wang, MD, PhD*†
Chien-Hua Huang, MD, PhD*†
Wen-Jone Chen, MD, PhD*†||#
Section Editor: Fred Severyn, MD
National Taiwan University Hospital, Department of Emergency Medicine, Taipei, Taiwan
National Taiwan University, College of Medicine, Department of Emergency Medicine, Taipei, Taiwan
Baylor Scott and White All Saints Medical Center, Department of Emergency Medicine, Fort Worth, TX
Baylor University Medical Center, Department of Emergency Medicine, Dallas, TX
National Taiwan University Hospital and National Taiwan University College of Medicine, Department of Internal Medicine, Division of Cardiology, Taipei, Taiwan
Min-Shen General Hospital, Taoyuan, Taiwan
Submission history: Submitted September 25, 2023; Revision received February 2, 2023; Accepted January 24, 2023
Electronically published April 4, 2023
Full text available through open access at http://escholarship.org/uc/uciem_westjem
DOI: 10.5811/westjem.59005
Introduction: The return of spontaneous circulation after cardiac arrest (RACA) score is a well-validated model for estimating the probability of return of spontaneous circulation (ROSC) in patients with outof-hospital cardiac arrest (OHCA) by incorporating several variables, including gender, age, arrest aetiology, witness status, arrest location, initial cardiac rhythms, bystander cardiopulmonary resuscitation (CPR), and emergency medical services (EMS) arrival time. The RACA score was initially designed for comparisons between different EMS systems by standardising ROSC rates. End-tidal carbon dioxide (EtCO2) is a quality indicator of CPR. We aimed to improve the performance of the RACA score by adding minimum EtCO2 measured during CPR to develop the EtCO2 + RACA score for OHCA patients transported to an emergency department (ED).
Methods: This was a retrospective analysis using prospectively collected data for OHCA patients resuscitated at an ED during 2015–2020. Adult patients with advanced airways inserted and available EtCO2 measurements were included. We used the EtCO2 values recorded in the ED for analysis. The primary outcome was ROSC. In the derivation cohort, we used multivariable logistic regression to develop the model. In the temporally split validation cohort, we assessed the discriminative performance of the EtCO2 + RACA score by the area under the receiver operating characteristic curve (AUC) and compared it with the RACA score using the DeLong test.
Results: There were 530 and 228 patients in the derivation and validation cohorts, respectively. The median measurements of EtCO2 were 8.0 times (interquartile range [IQR] 3.0-12.0 times), with the median minimum EtCO2 of 15.5 millimeters of mercury (mm Hg) (IQR 8.0-26.0 mm Hg). The median RACA score was 36.4% (IQR 28.9-48.0%), and a total of 393 patients (51.8%) achieved ROSC. The EtCO2 + RACA score was validated with good discriminative performance (AUC, 0.82, 95% CI 0.770.88), outperforming the RACA score (AUC, 0.71, 95% CI 0.65-0.78) (DeLong test: P < 0.001).
Conclusion: The EtCO2 + RACA score may facilitate the decision-making process regarding allocations of medical resources in EDs for OHCA resuscitation. [West J Emerg Med. 2023;24(3)605–614.]
Volume 24, NO.3: May 2023 605 Western Journal of Emergency Medicine * † ‡ § || # Original Research
End-tidal Carbon Dioxide and RACA Score to Predict Outcomes After Out-of-hospital Cardiac Arrest Wu
INTRODUCTION
The global incidence of out-of-hospital cardiac arrest (OHCA) is estimated to be 28-44 people per 100,000 population annually.1 In Asia, according to the Pan-Asian Resuscitation Outcomes Study (PAROS) registry, only 5.4% of patients survived to hospital discharge and 2.7% of patients were able to recover favourable neurological function after OHCA.2
The concept of “chain of survival”3,4 has been proposed to streamline OHCA management to improve outcomes. With the advancement of resuscitation skills and equipment, most time-sensitive interventions can now be performed by emergency medical services (EMS) personnel in prehospital settings in a timely manner without being postponed until patients are transported to the emergency department (ED). To further improve outcomes, emergency physicians (EP) may initiate certain invasive interventions,5 such as extracorporeal cardiopulmonary resuscitation (CPR), for selected patients.
Accurate estimation for probability of return of spontaneous circulation (ROSC) is important for EPs in their decision-making regarding mobilising medical resources for these selected patients. The RACA6 score was developed to estimate the ROSC probability after OHCA and is composed of several variables, including gender, age, arrest aetiology, witness status, arrest location, initial cardiac rhythms, bystander CPR, and EMS arrival time. Nonetheless, the RACA score was initially designed for comparisons between different EMS systems by standardising ROSC rates rather than for predicting ROSC probabilities of individual patients.
End‐tidal carbon dioxide (EtCO2) refers to the concentration of carbon dioxide at the end of exhalation, which is determined by pulmonary blood flow generated during CPR,7,8 and is suggested to be maintained above at least 10 millimetres of mercury (mm Hg) to increase ROSC probability.9,10 Therefore, in the current study we attempted to develop the EtCO2 + RACA score by combining the RACA score, a baseline risk-stratifying model, and minimum EtCO2 (a CPR quality indicator) to provide EPs with an accurate estimated ROSC probability of OHCA patients sent to the ED for ongoing CPR.
METHODS
We performed this study by retrospectively analysing a registry database, which prospectively collected data of OHCA patients sent to the ED of the National Taiwan University Hospital (NTUH) for resuscitation. The results are reported according to the Transparent Reporting of a Multivariable Prediction Model for Individual Prognosis or Diagnosis (TRIPOD) statement.11
Ethical Statements
This study was conducted in accordance with the Declaration of Helsinki amendments. The institutional review board approved this study (reference number: 201906082RINB) and waived the requirement for informed consent.
Population Health Research Capsule
What do we already know about this issue? The return of spontaneous circulation after cardiac arrest (RACA) score was developed to estimate the probability of RACA.
What was the research question? Can end-tidal carbon dioxide (EtCO 2), a quality indicator of cardiopulmonary resuscitation, be used to improve the RACA score?
What was the major finding of the study? The EtCO 2 + RACA score (AUC 0.82, 95% CI 0.77-0.88) outperformed the original RACA score (AUC 0.7, 95% CI 0.65-0.78; P < 0.001).
How does this improve population health? The EtCO 2 + RACA score may help allocate medical resources in emergency departments during resuscitation of outof-hospital cardiac arrest.
Study Setting
The NTUH Hospital has 2,600 beds, including 220 beds in intensive care units, and there are approximately 100,000 patient visits to the NTUH ED each year. For OHCA, CPR is performed according to the resuscitation guidelines.9,10 Furthermore, since 2013 ED personnel who may be involved in the resuscitation of OHCA, including clinicians and nursing staff, have received a specialised training course of the Advanced Cardiac Life Support (ACLS) teamwork model.12,13 This training model addresses both CPR techniques and non-technical skills.14,15 Any interventions performed during CPR are timestamped by nurses using a specially designed tablet app. The cardiac rhythm and EtCO2 are recorded every two minutes during pulse checking and then uploaded to the electronic health record. The EtCO2 is monitored by devices attached to the supraglottic airway (SGA) or endotracheal tube (ETT).
The decision to insert advanced airways, including SGA or ETT, during CPR is at the discretion of the treating physicians. Nonetheless, in our practice most clinicians tend to insert an ETT as soon as possible because, in the ACLS teamwork model, airway management is assigned to a dedicated squad of clinicians and nurses; thus, inserting an ETT does not influence delivery of high quality CPR. Also, for OHCA patients who never achieve ROSC, CPR would usually
Western Journal of Emergency Medicine 606 Volume 24, NO.3: May 2023
et al.
Wu et al.
End-tidal Carbon Dioxide and RACA Score to Predict Outcomes After Out-of-hospital Cardiac Arrest
be performed for at least 30 minutes, except for those with a documented do-not-resuscitate (DNR) order.
Study Population
Consecutive OHCA patients resuscitated at the ED of NTUH between January 1 2015–December 31, 2020 were screened. Patients fulfilling the following criteria were eligible for inclusion in the study: 1) non-traumatic arrest; 2) absence of ROSC before ED arrival; 3) absence of documentation of DNR order before CPR; 4) transport by EMS; 5) age ≥18 years; 6) insertion of advanced airways, either SGA or ETT; and 7) availability of EtCO2 measurement at least once. If a single patient underwent CPR multiple times, we extracted only the first episode for analysis.
Data Collection, Variable Definitions, and Outcome Measures
In the NTUH ED registry, OHCA scenarios were recorded per the Utstein template.16 We used the following variables for analysis: age; gender; variables derived from the Utstein template; management by EMS and in the ED; measured EtCO2 levels; and outcomes.
We calculated the RACA score according to the original formula reported by Gräsner et al6 (Supplemental Table 1). Nonetheless, the variables of arrest aetiology and location were not explicitly defined by Gräsner et al.6 Hence, we defined these variables as follows: 1) After classifying aetiology into trauma, hypoxia, and intoxication in the RACA score, we excluded traumatic OHCA patients in our registry, while including patients with external causes of asphyxia,16 and patients with suspected drug overdose;16 and 2) we reclassified the arrest location as used in the RACA score. Nursing home designation included assisted living/nursing home; doctor’s office included primary care clinics; public place included sports/recreation event, street/highway, public building, and educational institution; and medical institution included dialysis clinics.
Finally, the initial cardiac rhythms used in the RACA score were those recorded by EMS at initial contact, which were classified into ventricular fibrillation, pulseless electrical activity (PEA), asystole, and other. Nonetheless, our EMS only categorised the initial cardiac rhythms into shockable and non-shockable rhythms. Therefore, we used the initial rhythms recorded upon ED arrival in computing the RACA score. In the NTUH ED registry, the initial 15 EtCO2 measurements were recorded. In the current analysis, we retrieved only the EtCO2 measured after insertion of advanced airways. The EtCO2 summary parameters were computed accordingly, including initial, maximum, minimum, and average EtCO2
The ROSC was specified as the primary outcome and defined as a palpable pulse > 20 seconds, as used by Gräsner et al.6 We also reported survival and favourable neurological function at the time of hospital discharge. Favourable neurological function was defined as a score of 1 or 2 on the Cerebral Performance Category scale.17
Sample Size
Because of the retrospective nature of this study, the number of eligible patients during the study period determined the final sample size. We temporally split the final cohort into a derivation cohort and a validation cohort with the ratio of patient numbers being 70% vs 30%.
Statistical Analysis
Categorical variables are presented as counts with proportions, and continuous variables are presented as medians with interquartile ranges (IQR). We examined categorical variables by chi-square test, while continuous variables were compared by the Wilcoxon rank-sum test.
In the derivation cohort, we calculated the odds ratio (OR) as the outcome measure. We only tested the two predetermined variables, RACA score and minimum EtCO2 in the multivariable logistic regression analyses to estimate their association with the primary outcome. We employed generalised additive models (GAM)18 to explore non-linear effects of the RACA score or minimum EtCO2 on the primary outcome and to identify the optimal cut-off points to transform these variables into categorical variables, if necessary. Since we did not know whether there would be confounding effects or multicollinearity between the RACA score and minimum EtCO2, we still conducted formal, stepwise, variable selection procedure with iterations to derive the final prediction model. We defined the significance levels for entry and to stay at P = 0.15. We derived the final prediction model by excluding non-significant variables sequentially until all regression coefficients were significant.
In the validation cohort, we assessed the discriminative performance of the derived model by area under the receiver operating characteristic (ROC) curve (AUC). We evaluated model calibration by the Hosmer–Lemeshow goodness-offit test and a calibration plot to compare predicted ROSC probabilities with the observed ROSC rates. We compared the AUCs of the EtCO2 + RACA and RACA scores by the DeLong test of correlated ROC curves.19 We used R 4.1.1 software (R Foundation for Statistical Computing, Vienna, Austria) to analyse the data. A two-tailed P-value < 0.05 was considered significant.
RESULTS
The patient selection procedure resulted in the final cohort of 758 patients (Supplemental Figure 1). We temporally split the final cohort on May 1, 2019, because the ratio of patient numbers in the derivation and validation cohorts was the closest to 70% vs 30%. The characteristics of the patients in the final cohort are presented in Table 1, and we made comparisons between the derivation and validation cohorts.
Overall, the median patient age was 71.0 years (IQR 60.0-82.0 years), and 489 patients (64.5%) were male. Only a small proportion of patients suffered from hypoxia- (5.3%, 40) or intoxication-associated (1.3%,
Volume 24, NO.3: May 2023 607 Western Journal of Emergency Medicine
End-tidal Carbon Dioxide and RACA Score to Predict Outcomes After Out-of-hospital Cardiac Arrest Wu
Table 1. Characteristics of all included patients during the study period.
Data are presented as median (interquartile range) or counts (proportion). Bold-typed variables represent those used in the RACA score. EMS, emergency medical service; CPR, cardiopulmonary resuscitation; SGA, supraglottic airway; ETT, endotracheal tube; ED, emergency department; EtCO2, end-tidal carbon dioxide; mm Hg, millimeters of mercury; PEA, pulseless electrical activity.
Western Journal of Emergency Medicine 608 Volume 24, NO.3: May 2023
et al.
Variables Total cohort (N = 758) Derivation cohort (n = 530) Validation cohort (n = 228) P-value Age, year 71.0 (60.0–82.0) 73.0 (60.0–83.0) 68.0 (59.0–79.0) 0.005 Age ≥ 80 years 227 (29.9) 173 (32.6) 54 (23.7) 0.01 Male, n 489 (64.5) 335 (63.2) 154 (67.5) 0.25 Arrest etiology, n Hypoxia 40 (5.3) 33 (6.2) 7 (3.1) 0.07 Intoxication 10 (1.3) 7 (1.3) 3 (1.3) 0.99 Arrest location, n At home 455 (60.0) 325 (61.3) 130 (57.0) 0.27 Nursing home 28 (3.7) 25 (4.7) 3 (1.3) 0.02 Doctor’s office 13 (1.7) 8 (1.5) 5 (2.2) 0.51 Public place 172 (22.7) 109 (20.6) 63 (27.6) 0.03 Medical institution 6 (0.8) 6 (1.1) 0 (0) 0.11 Witness status, n Witness by bystander 313 (41.3) 214 (40.4) 99 (43.4) 0.44 Witness by EMS 58 (7.7) 48 (9.1) 10 (4.4) 0.03 Witness by bystander or EMS 350 (46.2) 242 (45.7) 108 (47.4) 0.67 Bystander CPR, n 398 (52.5) 265 (50.0) 133 (58.3) 0.04 EMS management Call to EMS arrival, minutes 4.0 (3.0–5.0) 4.0 (3.0–5.0) 4.0 (3.0–6.0) 0.01 Prehospital SGA use, n 527 (69.5) 372 (70.2) 155 (68.0) 0.55 Prehospital ETT use, n 54 (7.1) 37 (7.0) 17 (7.5) 0.82 Prehospital epinephrine use, n 187 (24.7) 119 (22.5) 68 (29.8) 0.03 Prehospital defibrillation, n 150 (19.8) 96 (18.1) 96 (23.7) 0.08 Prehospital CPR duration, minutes 17.0 (13.0–21.0) 16.0 (12.0–20.0) 19.0 (16.0–23.0) <0.001 ED management Initial cardiac rhythms at ED arrival, n Shockable rhythms 51 (6.7) 36 (6.8) 15 (6.6) 0.91 PEA 304 (40.1) 215 (40.6) 89 (39.0) 0.69 Asystole 403 (53.2) 279 (52.6) 124 (54.4) 0.66 ED SGA use, n 526 (69.4) 371 (70.0) 155 (68.0) 0.58 ED ETT use, n 735 (97.0) 510 (96.2) 225 (98.7) 0.07 Available measurements of EtCO2, times 8.0 (3.0–12.0) 6.0 (3.0–11.0) 11.0 (4.0–13.0) <0.001 EtCO2 summary parameters, mm Hg Initial 26.0 (16.0–41.0) 25.0 (16.0–40.0) 27.0 (15.5–42.5) 0.40 Maximum 39.0 (25.0–54.0) 37.5 (24.0–52.0) 41.0 (25.5–56.0) 0.19 Minimum 15.5 (8.0–26.0) 16.0 (9.0–26.0) 15.0 (7.0–26.0) 0.57 Average 26.4 (16.0–38.3) 25.7 (16.5–37.8) 27.4 (15.3–39.1) 0.66 ED CPR duration, min 28.5 (12.0–32.0) 26.0 (12.0–32.0) 30.0 (13.0–31.0) 0.38
Data are presented as median (interquartile range) or counts (proportion). Bold-typed variables represent those used in the RACA score. ROSC, return of spontaneous circulation; RACA, ROSC after cardiac arrest.
10) OHCA. Most OHCA occurred at home (60.0%, 455 patients). Approximately 46.2% of OHCA (350 patients) was witnessed by bystanders or EMS, and 52.5% of them received bystander CPR (398 patients). The median time interval between call and EMS arrival was 4.0 minutes (min) (IQR 3.0-5.0 min). A total of 527 patients (69.5%) received SGA placement during prehospital CPR, while 735 patients (97.0%) received an ETT during CPR at the ED. Most of the initial cardiac rhythms recorded upon ED arrival
were non-shockable rhythms, including PEA (40.1%, 304 patients) and asystole (53.2%, 403 patients). The median available measurements of EtCO2 were 8.0 times (IQR: 3.012.0 times), with the median minimum EtCO2 of 15.5 mm Hg (IQR: 8.0-26.0 mm Hg). The median RACA score was 36.4% (28.9-48.0%), and a total of 393 patients (51.8%) achieved ROSC.
The differences between patients stratified by ROSC in the derivation cohort are shown in Table 2. Significant differences
Data are presented as median (interquartile range) or counts (proportion). Bold-typed variables represent those used in the RACA score. EMS, emergency medical service; CPR, cardiopulmonary resuscitation; SGA, supraglottic airway.
Volume 24, NO.3: May 2023 609 Western Journal of Emergency Medicine Wu et al.
Cardiac
Variables Total cohort (N = 758) Derivation cohort (n = 530) Validation cohort (n = 228) P-value ROSC probability predicted by RACA score, % 36.4 (28.9–48.0) 36.4 (28.5–48.5) 36.8 (29.3–47.5) 0.69 Outcome, n ROSC 393 (51.8) 281 (53.0) 112 (49.1) 0.33 Survival to hospital discharge 78 (10.3) 53 (10.0) 25 (11.0) 0.69 Favorable neurological outcome at hospital discharge 41 (5.4) 28 (5.3) 13 (5.7) 0.82 Table
End-tidal Carbon Dioxide and RACA Score to Predict Outcomes After Out-of-hospital
Arrest
1. Continued.
Variables Derivation cohort (n = 530) ROSC (n = 281) Absence of ROSC (n = 249) P-value Age, year 73.0 (60.0–83.0) 70.0 (60.0–82.3) 75.0 (61.0–84.0) 0.05 Age ≥ 80 years 173 (32.6) 80 (28.5) 93 (37.3) 0.03 Male, n 335 (63.2) 188 (66.9) 147 (59.0) 0.06 Arrest etiology, n Hypoxia 33 (6.2) 25 (8.9) 8 (3.2) 0.007 Intoxication 7 (1.3) 4 (2.5) 3 (1.2) 0.83 Arrest location, n At home 325 (61.3) 148 (52.7) 177 (71.1) <0.001 Nursing home 25 (4.7) 10 (3.6) 15 (6.0) 0.18 Doctor’s office 8 (1.5) 6 (2.1) 2 (0.8) 0.21 Public place 109 (20.6) 74 (26.3) 35 (14.1) <0.001 Medical institution 6 (1.1) 5 (1.8) 1 (0.4) 0.13 Witness status, n Witness by bystander 214 (40.4) 141 (50.2) 73 (29.3) <0.001 Witness by EMS 48 (9.1) 35 (12.5) 13 (5.2) 0.004 Witness by bystander or EMS 242 (45.7) 161 (57.3) 81 (32.5) <0.001 Bystander CPR, n 265 (50.0) 142 (50.5) 123 (49.4) 0.79 EMS management Call to EMS arrival, minutes 4.0 (3.0–5.0) 4.0 (3.0–5.0) 4.0 (3.0–5.0) 0.15 Prehospital SGA use, n 372 (70.2) 189 (67.3) 183 (73.5) 0.12
Table 2. Characteristics of patients in derivation cohort stratified by return of spontaneous circulation.
End-tidal Carbon Dioxide and RACA Score to Predict Outcomes After Out-of-hospital Cardiac Arrest Wu
Data are presented as median (interquartile range) or counts (proportion). Bold-typed variables represent those used in the RACA score. ETT, endotracheal tube; ED, emergency department; EtCO2, end-tidal carbon dioxide; mm Hg, millimeters of mercury; PEA, pulseless electrical activity.
between patients with and without ROSC were noted in approximately half of the variables included in the RACA score, including age ≥80 years, hypoxia, public place, witness by bystander or EMS, PEA, and asystole. Values of all EtCO2 summary parameters were significantly higher in patients with than without ROSC. The GAM plots (Supplemental Figure 2) demonstrated a near-linear association between minimum EtCO2 and ROSC. Therefore, we analysed minimum EtCO2 as a continuous variable without transformation.
After stepwise variable selection, the final EtCO2 + RACA score resulted in good discriminative performance in the derivation cohort (AUC 0.80, 95% CI 0.76–0.83; Table 3) (online EtCO2 + RACA score calculator: https://chou2.chou-tw.com/ index.php/etco2/). In the validation cohort, the EtCO2 +RACA score also demonstrated good discriminative performance (AUC 0.82, 95% CI 0.77-0.88), significantly outperforming the RACA score (AUC 0.71, 95% CI 0.65-0.78) (DeLong test: P < 0.001) (Figure 1). Finally, the calibration plot (Figure 2) indicated that EtCO2 + RACA score was calibrated well in the validation cohort (Hosmer–Lemeshow test: P = 0.33).
The predicted probability of return of spontaneous circulation (ROSC) can be calculated using the following formula: probability of ROSC = 1/{1 + exp[−(−3.34284 + RACA score × 5.76509 + minimum EtCO2 × 0.06721)]}.
EtCO2, end-tidal carbon dioxide; RACA, return of spontaneous circulation after cardiac arrest.
DISCUSSION
Main Findings
Based on the RACA score, we developed and validated a logistic regression model, the EtCO2 + RACA score, to
Western Journal of Emergency Medicine 610 Volume 24, NO.3: May 2023
et al. Variables Derivation cohort (n = 530) ROSC (n = 281) Absence of ROSC (n = 249) P-value Prehospital ETT use, n 37 (7.0) 15 (5.3) 22 (8.8) 0.12 Prehospital epinephrine use, n 119 (22.5) 56 (19.9) 63 (25.3) 0.14 Prehospital defibrillation, n 96 (18.1) 68 (24.2) 28 (11.2) <0.001 Prehospital CPR duration, minutes 16.0 (12.0–20.0) 16.0 (11.0–19.0) 17.0 (13.0–20.0) 0.005 ED management Initial cardiac rhythms at ED arrival, n Shockable rhythms 36 (6.8) 30 (10.7) 6 (2.4) <0.001 PEA 215 (40.6) 132 (47.0) 83 (33.3) 0.001 Asystole 279 (52.6) 119 (42.3) 160 (64.3) <0.001 ED SGA use, n 371 (70.0) 189 (67.3) 182 (73.1) 0.14 ED ETT use, n 510 (96.2) 271 (96.4) 239 (96.0) 0.78 Available measurements of EtCO2, times 6.0 (3.0–11.0) 4.0 (2.0–8.0) 10.0 (5.0–13.0) <0.001 EtCO2 summary parameters, mm Hg Initial 25.0 (16.0–40.0) 31.0 (21.0–45.0) 21.0 (12.0–30.3) <0.001 Maximum 37.5 (24.0–52.0) 43.0 (30.0–57.0) 31.0 (18.0–48.0) <0.001 Minimum 16.0 (9.0–26.0) 22.0 (15.0–32.3) 11.0 (5.0–18.0) <0.001 Average 25.7 (16.5–37.8) 30.5 (22.9–43.1) 19.9 (11.2–29.1) <0.001 ED CPR duration, minutes 26.0 (12.0–32.0) 14.0 (9.0–28.0) 31.0 (27.0–34.0) <0.001 ROSC probability predicted by RACA score, % 36.4 (28.5–48.5) 41.1 (31.4–54.5) 31.9 (26.1–39.8) <0.001
Table 2. Continued.
Intercept and
β coefficient Odds ratio (95% CI) P-value Intercept −3.34284 RACA score 5.76509 318.97 (62.63-1624.36) <0.001 Minimum EtCO2, mm Hg 0.06721 1.07 (1.05-1.09) <0.001
Table 3. The EtCO2-plus RACA score
predictors
Comparisons with Previous Studies
For OHCA patients, most prediction models were designed for those who had achieved ROSC,20 with only a few models available for patients who were still undergoing CPR. By using registry data, Baldi et al21 used Utstein-based (UB) variables to develop the UB-ROSC score for predicting the probability of survival to hospital admission of an OHCA victim with AUCs above 0.77. Also, according to the Utstein-based variables recorded in the PAROS registry, Liu et al22 employed machine-learning to derive the prehospital (P-ROSC) score to predict the individualized probability of P-ROSC23 with an AUC of 0.806. The RACA score6 was originally developed for predicting ROSC after OHCA, using readily available factors when EMS personnel arrive at the scene. With slight differences in definitions, these RACA score-related variables were similar to the Utstein-based ones used by UB-ROSC21 and P-ROSC, 22 suggesting that these variables might be employed to make individualized predictions. In the validation cohort of the original study by Gräsner et al,6 the RACA score achieved a fair discriminative performance (AUC 0.73).
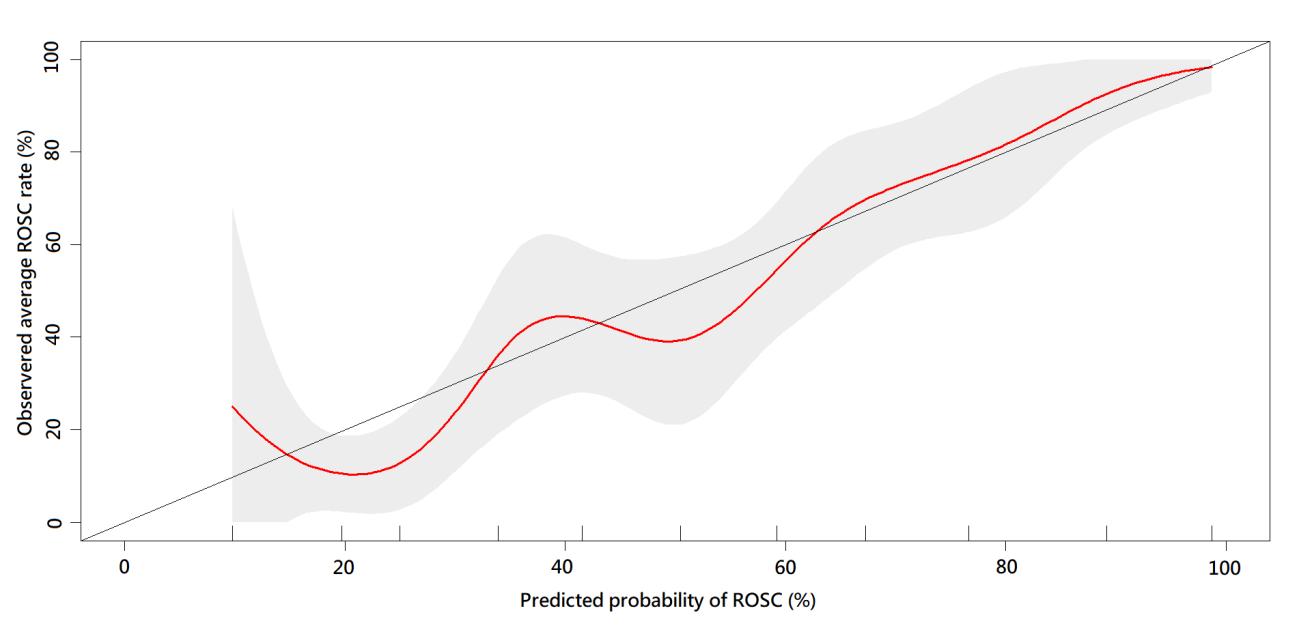
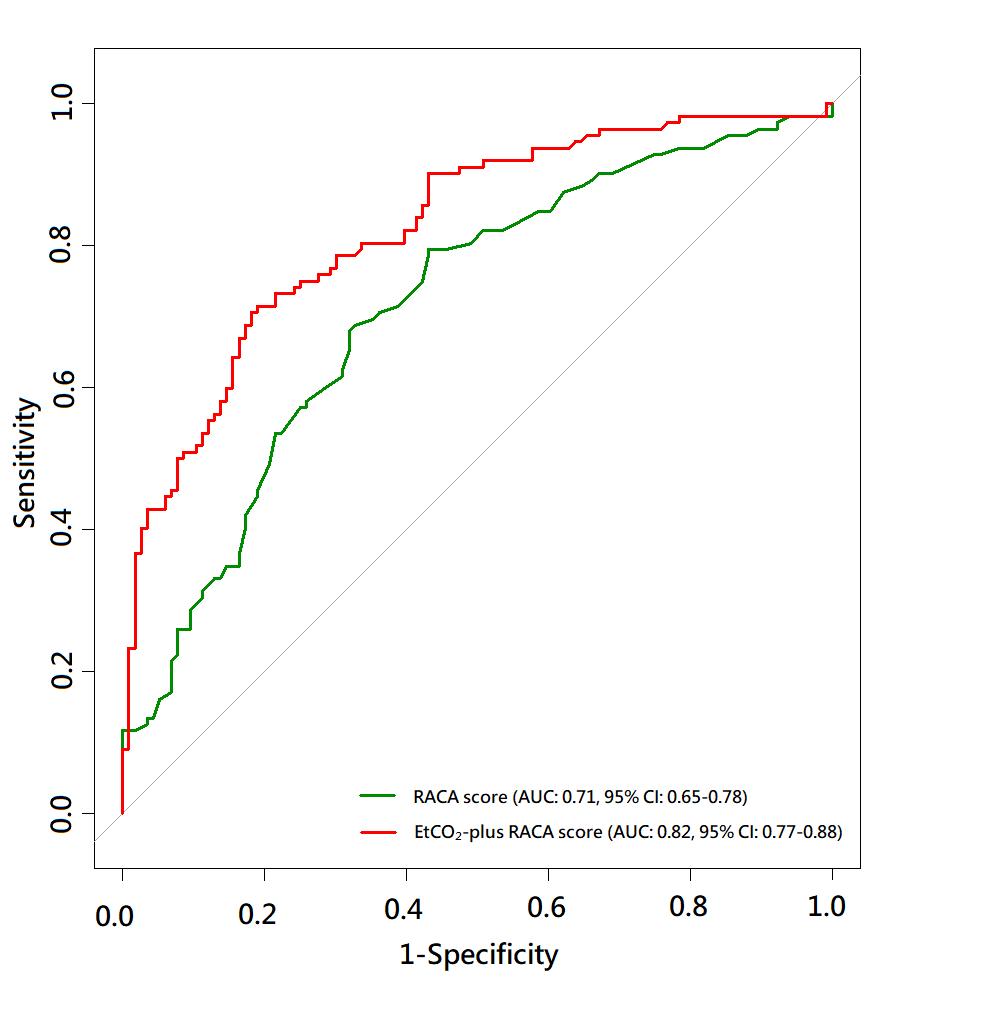
The RACA score has been validated in many regions, including Finland (AUC 0.71),24 Asia (AUC 0.74),25 Italy, and Switzerland (AUC 0.76),26 as well as in our validation cohort (AUC 0.71), suggesting that the RACA score is generalisable and applicable to a wide range of diverse populations. Our validation cohort had a higher proportion of non-shockable rhythms above 90% (PEA: 39.0%, asystole: 54.4%), compared with the validation cohort of the Gräsner et al6 study (PEA: 15.0%, asystole: 46.6%). Despite the substantial difference in the presenting rhythms, the discriminative performance of the RACA score in our validation cohort was similar to that in previous studies (AUC 0.71, Figure 1). Therefore, we adopted the RACA score in our study to calculate the baseline probability of ROSC.
EtCO 2 , end-tidal carbon dioxide; ROSC, return
spontaneous circulation; RACA, return of spontaneous circulation after cardiac arrest.
facilitate estimating ROSC probability of OHCA patients transported to EDs for continuing CPR. By adding minimum EtCO2 to the original RACA score, the discriminative performance of the EtCO2 + RACA score significantly outperformed the original RACA score. By combining a baseline risk-stratifying score and a CPR quality indicator, the EtCO2 + RACA score may assist EPs in decision-making regarding OHCA management.
The ROSC rate (51.8%) of our total cohort was slightly higher than the ROSC rate (43.3%) reported by Gräsner et al,6 despite the fact that the proportions of non-shockable rhythms were higher in our study. When using the EMS registry of our city, the Chiang et al study27 reported the proportion of survival or favourable neurological outcome at hospital discharge among OHCA patients receiving ETT or SGA was 7.2% and 3.1%, respectively, similar to our results (survival: 10.3%, favourable neurological outcome: 5.4%). Chiang et al27 also noted high proportions of non-shockable rhythms (89.2%) and sustained ROSC of ≥2 hours (26.6%) among these patients. Since ROSC was defined as a palpable pulse lasting longer than 20 seconds6 in our study, the seemingly high ROSC rate may be reasonable.
The RACA score tended to underestimate the ROSC probability in our cohort, with predicted vs observed ROSC rate being 36.4% vs 51.8% (Table 1). This miscalibration may have occurred because in the original study in which the RACA score was developed,6 the arrest aetiology
Volume 24, NO.3: May 2023 611 Western Journal of Emergency Medicine Wu et al. End-tidal Carbon Dioxide and RACA Score to Predict Outcomes After Out-of-hospital Cardiac Arrest
Figure 1. Comparison of receiver operating characteristic curves between the RACA and EtCO2-plus RACA scores. AUC, area under ROC curve; EtCO2, end-tidal carbon dioxide; RACA, return of spontaneous circulation after cardiac arrest.
Figure 2. Calibration curve when validating the EtCO2 + RACA score for probability of return of spontaneous circulation (in the validation cohort. The ticks on the X-axis separate the validation cohort into 10 equal patient numbers of subgroups. Red curve, calibration curve; grey area, 95% CI.
of
End-tidal Carbon Dioxide and RACA Score to Predict Outcomes After Out-of-hospital Cardiac Arrest Wu et al.
and location were not classified according to the Utstein template16 and needed to be reclassified in our study retrospectively. Furthermore, the component variables of the RACA score, such as age or arrest location, were all baseline variables and unmodifiable during CPR. These baseline variables may not reflect the highly dynamic nature of CPR. That is, if the ROSC probability predicted by the RACA score was low, the outcomes could still be improved by high quality CPR; in contrast, even if the RACA score predicted a high ROSC probability, the outcomes may still be compromised if CPR quality was poor. Hence, to make individualised prognostication during CPR, variables specific to the patient and resuscitation process such as EtCO2 may be more helpful.
Interpretation of Current Studies
The systematic review by Paiva et al28 indicated that EtCO2 was associated with ROSC probability, likely because EtCO2 could reflect CPR quality. Nonetheless, the optimal parameter for EtCO2 being a prognostic factor is still under debate.28 For example, the so-called “initial” EtCO2 may not be truly measured at the initial stage of CPR since an ETT may be inserted at a later stage of CPR. Also, the maximum EtCO2 may be confusing since it did not account for the influence of measurement timing, ie, whether the predictive value of a maximum EtCO2 measured at the early stage of CPR was the same as that measured at the late stage of CPR. Average EtCO2 was also a frequently reported parameter. Despite its convenience in summarising the overall measured EtCO2, average EtCO2 could not differentiate between different EtCO2 trends. While ascending and descending EtCO2 trends may have similar average EtCO2, their prognoses may be very different.29 Furthermore, average EtCO2 is not very practical in clinical application since clinicians may not be able to compute the average EtCO2 in real time. Lastly, the most promising parameter in predicting ROSC may be the minimum EtCO2 since this parameter may reflect the minimum CPR quality achieved by rescuers.
The higher the minimum EtCO2, the higher the ROSC probability would be (Supplemental Figure 2). Similarly, the systematic review of Paiva et al28 indicated that EtCO2 ≥ 20 mm Hg was a stronger predictor for ROSC than EtCO2 ≥10 mm Hg. An abrupt rise of EtCO2 over 40 mm Hg was suggested to be the first sign of ROSC.28 For minimum EtCO2 ≤40 mm Hg, the higher EtCO2 may indicate higher CPRgenerated cardiac output and better CPR quality. In contrast, for minimum EtCO2 >40 mm Hg, the high EtCO2 may simply suggest that the cardiac arrest was caused by asphyxia or hypercapnic respiratory failure prior to collapse rather than augmented cardiac output.30
Our research has several advantages over previous studies28 in investigating EtCO2 as an outcome predictor. First, as one part of the ACLS teamwork model,12,13 the EtCO2 is routinely recorded in our ED. Second, the clinical practice is
consistent across different clinicians who treat OHCA in our ED’s resuscitation bay. As shown in Table 1, the proportions of ETT use in the ED were similarly high in the derivation and validation cohorts. Finally, CPR is usually performed for approximately 30 min in patients who never achieve ROSC (median duration of CPR performed in the ED was 28.5 min, Table 1), which would not be shortened simply because of clinicians’ perception of poor prognosis for the patient. This practice may help circumvent the “bias of self-fulfilling prophecy”31 since EtCO2 has been proposed as a variable in the termination of resuscitation rule.9
Future Applications
In most Asian countries, EMS personnel are usually not legally allowed to pronounce death2 and must transfer OHCA patients to EDs despite most interventions of Advanced Life Support being able to be performed in prehospital resuscitation. The EPs resuscitating EMStransported patients are faced with the problem of whether resuscitation should be continued as set up by EMS personnel or further invasive interventions should be implemented. Advanced therapeutics, such as extracorporeal CPR 5 or resuscitative endovascular balloon occlusion of the aorta,32 are being tested and may be applicable in the near future for OHCA. Nonetheless, these interventions may only be beneficial in a certain group of patients. A prediction model like the EtCO2 + RACA score may assist EPs in determining whether the interventions should be upgraded for an individual patient. It should be emphasized that like other scoring systems predicting ROSC for OHCA patients, 21,22 the EtCO 2 + RACA score is not intended to terminate CPR for OHCA patients. With the assistance of advanced technology, the EtCO2 + RACA score may be computed instantaneously along with the real-time updated minimum EtCO2 during CPR. Further studies are needed to validate the EtCO2 + RACA score and explore the possibility of integrating the prediction model, internet-based devices, and the resuscitation process.
LIMITATIONS
First, the analysed EtCO2 dataset was derived from a prospectively collected database of a single centre with a specialised training model for CPR. The median of the minimum EtCO2 was higher than 10 mm Hg (Table 1), revealing the high CPR quality achieved by the ACLS teamwork model. Further studies are needed to investigate the generalisability of our results. Second, as suggested by the TRIPOD statement,11 the temporally split derivation and validation cohorts allowed non-random variation between the two cohorts, and this kind of validation could be considered an intermediary between internal and external validation.
Even the number of measurements of EtCO2 was significantly higher in the validation than the derivation cohort (Table 1), suggesting that the ACLS teamwork model
Western Journal of Emergency Medicine 612 Volume 24, NO.3: May 2023
Wu et al.
End-tidal Carbon Dioxide and RACA Score to Predict Outcomes After Out-of-hospital Cardiac Arrest
matured with time. Despite this advantage in the validation procedure, further external validation of the EtCO2 + RACA score in other communities is needed because this model was developed from a single medical centre. Finally, we only used EtCO2 recorded in the ED to develop the EtCO2 + RACA score. Because of the limitations in the facility and human resources, the EtCO2 values were not recorded at regular time intervals in the field and during transport. Future studies are needed to test whether the EtCO2 values measured by EMT during CPR could further improve the performance of the EtCO2 + RACA score.
CONCLUSION
The derived EtCO2 +RACA score may be used to assist emergency physicians in estimating the probability of return of spontaneous circulation for EMS-transported patients with out-of-hospital cardiac arrest. By adding a CPR quality indicator, minimum EtCO2, to the well-validated RACA score, the EtCO2 + RACA score achieved good discriminative performance. The EtCO2 + RACA score may facilitate the decision-making process regarding allocations of medical resources in EDs for OHCA resuscitation. Nonetheless, it should be emphasized that the EtCO2 + RACA score is not intended to terminate CPR. Further validation by external datasets is warranted to ensure the generalizability of the EtCO2 + RACA score.
ACKNOWLEDGMENTS
We thank the staff of the 3rd Core Lab, Department of Medical Research, National Taiwan University Hospital (NTUH), for technical support. Author Chih-Hung Wang received a grant (112-S0002) from the NTUH. The NTUH had no involvement in designing the study, collecting, analysing or interpreting the data, writing the manuscript, or deciding whether to submit the manuscript for publication.
REFERENCES
1. Berdowski J, Berg RA, Tijssen JG, et al. Global incidences of outof-hospital cardiac arrest and survival rates: systematic review of 67 prospective studies. Resuscitation. 2010;81(11):1479-87.
2. Ong ME, Shin SD, De Souza NN, et al. Outcomes for out-ofhospital cardiac arrests across 7 countries in Asia: the Pan Asian Resuscitation Outcomes Study (PAROS). Resuscitation 2015;96:100-8.
3. Merchant RM, Topjian AA, Panchal AR, et al. Part 1: Executive Summary: 2020 American Heart Association Guidelines for Cardiopulmonary Resuscitation and Emergency Cardiovascular Care. Circulation. 2020;142(16_suppl_2):S337-57.
4. Semeraro F, Greif R, Böttiger BW, et al. European Resuscitation Council Guidelines 2021: systems saving lives. Resuscitation 2021;161:80-97.
5. Yannopoulos D, Bartos J, Raveendran G, et al. Advanced reperfusion strategies for patients with out-of-hospital cardiac arrest and refractory ventricular fibrillation (ARREST): a phase 2, single centre, open-label, randomised controlled trial. Lancet 2020;396(10265):1807-16.
6. Gräsner J-T, Meybohm P, Lefering R, et al. ROSC after cardiac arrest—the RACA score to predict outcome after out-of-hospital cardiac arrest. Eur Heart J. 2011;32(13):1649-56.
7. Garnett AR, Ornato JP, Gonzalez ER, et al. End-tidal carbon dioxide monitoring during cardiopulmonary resuscitation. JAMA 1987;257(4):512-5.
8. Sandroni C, De Santis P, D’Arrigo S. Capnography during cardiac arrest. Resuscitation. 2018;132:73-7.
9. Panchal AR, Bartos JA, Cabañas JG, et al. Part 3: Adult Basic and Advanced Life Support: 2020 American Heart Association Guidelines for Cardiopulmonary Resuscitation and Emergency Cardiovascular Care. Circulation. 2020;142(16_suppl_2):S366-468.
10. Soar J, Böttiger BW, Carli P, et al. European Resuscitation Council Guidelines 2021: Adult Advanced Life Support. Resuscitation 2021;161:115-51.
Address for Correspondence: Chih-Hung Wang, MD, PhD, National Taiwan University Hospital, Department of Emergency Medicine, No.7, Zhongshan S. Rd., Zhongzheng Dist., Taipei City 100, Taiwan. Email: chwang1981@ntu.edu.tw.
Conflicts of Interest: By the WestJEM article submission agreement, all authors are required to disclose all affiliations, funding sources and financial or management relationships that could be perceived as potential sources of bias. No author has professional or financial relationships with any companies that are relevant to this study. There are no conflicts of interest or sources of funding to declare.
Copyright: © 2023 Wu et al. This is an open access article distributed in accordance with the terms of the Creative Commons Attribution (CC BY 4.0) License. See: http://creativecommons.org/ licenses/by/4.0/
11. Collins GS, Reitsma JB, Altman DG, et al. Transparent Reporting of a multivariable prediction model for Individual Prognosis or Diagnosis (TRIPOD): the TRIPOD statement. Ann Intern Med. 2015;162(1):55-63.
12. Chong KM, Wu C-H, Lin J-J, et al. Advanced cardiac life support (ACLS) is all about airway-circulation-leadership-support (A-C-L-S): a novel cardiopulmonary resuscitation (CPR) teamwork model. Resuscitation. 2016;106:e11-2.
13. Lin CH, Lin HY, Tseng WP, et al. Resuscitation teamwork during the COVID-19 pandemic in the emergency department: challenges and solutions. Resuscitation. 2021;160:18-9.
14. Soar J, Monsieurs KG, Ballance JH, et al. European Resuscitation Council Guidelines for Resuscitation 2010 Section 9. Principles of Education in Resuscitation. Resuscitation. 2010;81(10):1434-44.
15. Bhanji F, Mancini ME, Sinz E, et al. Part 16: Education, Implementation, and Teams: 2010 American Heart Association Guidelines for Cardiopulmonary Resuscitation and Emergency
Volume 24, NO.3: May 2023 613 Western Journal of Emergency Medicine
End-tidal Carbon Dioxide and RACA Score to Predict Outcomes After Out-of-hospital Cardiac Arrest Wu et al.
Cardiovascular Care. Circulation. 2010;122(18 Suppl 3):S920-33.
16. Perkins GD, Jacobs IG, Nadkarni VM, et al. Cardiac Arrest and Cardiopulmonary Resuscitation Outcome Reports: Update of the Utstein Resuscitation Registry Templates for Out-of-Hospital Cardiac Arrest: A Statement for Healthcare Professionals from a Task Force of the International Liaison Committee on Resuscitation (American Heart Association, European Resuscitation Council, Australian and New Zealand Council on Resuscitation, Heart and Stroke Foundation of Canada, InterAmerican Heart Foundation, Resuscitation Council of Southern Africa, Resuscitation Council of Asia); and the American Heart Association Emergency Cardiovascular Care Committee and the Council on Cardiopulmonary, Critical Care, Perioperative and Resuscitation. Resuscitation. 2015;96:328-40.
17. Becker LB, Aufderheide TP, Geocadin RG, et al. Primary outcomes for resuscitation science studies: a consensus statement from the American Heart Association. Circulation. 2011;124(19):2158-77.
18. Hastie TJ, Tibshirani RJ. (1990). Generalized Additive Models. Boca Raton, FL: Chapman & Hall.
19. DeLong ER, DeLong DM, Clarke-Pearson DL. Comparing the areas under two or more correlated receiver operating characteristic curves: a nonparametric approach. Biometrics. 1988;44(3):837-45.
20. Gue YX, Adatia K, Kanji R, et al. Out-of-hospital cardiac arrest: a systematic review of current risk scores to predict survival. Am Heart J. 2021;234:31-41.
21. Baldi E, Caputo ML, Savastano S, et al. An Utstein-based model score to predict survival to hospital admission: the UB-ROSC score. Int J Cardiol. 2020;308:84-9.
22. Liu N, Liu M, Chen X, et al. Development and validation of an interpretable prehospital return of spontaneous circulation (P-ROSC) score for patients with out-of-hospital cardiac arrest using machine learning: a retrospective study. EClinicalMedicine. 2022;48:101422.
23. Testa A, Versaci F, Biondi-Zoccai G. Individualised prognosis in out-
of-hospital cardiac arrest: the case for P-ROSC in Asian people. EClinicalMedicine. 2022;48:101446.
24. Kupari P, Skrifvars M, Kuisma M. External validation of the ROSC after cardiac arrest (RACA) score in a physician-staffed emergency medical service system. Scand J Trauma Resusc Emerg Med. 2017;25(1):34.
25. Liu N, Ong MEH, Ho AFW, et al. Validation of the ROSC after cardiac arrest (RACA) score in Pan-Asian out-of-hospital cardiac arrest patients. Resuscitation. 2020;149:53-9.
26. Caputo ML, Baldi E, Savastano S, et al. Validation of the return of spontaneous circulation after cardiac arrest (RACA) score in two different national territories. Resuscitation. 2019;134:62-8.
27. Chiang WC, Hsieh MJ, Chu HL, et al. The effect of successful intubation on patient outcomes after out-of-hospital cardiac arrest in Taipei. Ann Emerg Med. 2018;71(3):387-96.
28. Paiva EF, Paxton JH, O’Neil BJ. The use of end-tidal carbon dioxide (ETCO2) measurement to guide management of cardiac arrest: a systematic review. Resuscitation. 2018;123:1-7.
29. Wang CH, Lu TC, Tay J, et al. Association between trajectories of end-tidal carbon dioxide and return of spontaneous circulation among emergency department patients with out-of-hospital cardiac arrest. Resuscitation. 2022;177:28-37.
30. Lah K, Križmarić M, Grmec S. The dynamic pattern of end-tidal carbon dioxide during cardiopulmonary resuscitation: difference between asphyxial cardiac arrest and ventricular fibrillation/pulseless ventricular tachycardia cardiac arrest. Crit Care. 2011;15(1):R13.
31. Mertens M, King OC, van Putten M, et al. Can we learn from hidden mistakes? Self-fulfilling prophecy and responsible neuroprognostic innovation. J Med Ethics. 2021;medethics-2020-106636
32. Brede JR, Skulberg AK, Rehn M, et al. REBOARREST, resuscitative endovascular balloon occlusion of the aorta in non-traumatic out-ofhospital cardiac arrest: a study protocol for a randomised, parallel group, clinical multicentre trial. Trials. 2021;22(1):511.
Western Journal of Emergency Medicine 614 Volume 24, NO.3: May 2023
Safe
Michael
Discharge
Needs
Following Emergency Care for Intimate Partner Violence, Sexual Assault, and Sex Trafficking
J. Clery, MD, MPP*
Eudora Olsen, BA†
Hannah Marcovitch, BA†
Harrison Goodall, BA†
Jasmine Gentry, MD*
Matthew A. Wheatley, MD‡
Nichelle Jackson, MSN*
Dabney P. Evans, PhD, MPH§
Section Editor: Mark Faul, PhD, MA
Emory University School of Medicine, Department of Emergency Medicine, Atlanta, Georgia
Emory University School of Medicine, Atlanta, Georgia
Emory University School of Medicine, Grady Health System, Emergency Care Center, Atlanta, Georgia
Emory University Rollins School of Public Health, Atlanta, Georgia
Submission history: Submitted September 30, 2022; Revision received January 27, 2023; Accepted February 2, 2023
Electronically published May 2, 2023
Full text available through open access at http://escholarship.org/uc/uciem_westjem
DOI: 10.5811/westjem.59072
Introduction: For survivors of gender-based violence (GBV) seeking care in hospital emergency departments (ED) the need for medical care and safe discharge is acute.
Methods: In this study we evaluated safe discharge needs of GBV survivors following hospitalbased care at a public hospital in Atlanta, GA, in 2019 and between April 1, 2020–September 30, 2021, using both retrospective chart review and evaluation of a novel clinical observation protocol for safe discharge planning.
Results: Of 245 unique encounters, only 60% of patients experiencing intimate partner violence (IPV) were discharged with a safe plan and only 6% were discharged to shelters. This hospital instituted an ED observation unit (EDOU) to support GBV survivors with safe disposition. Then, through the EDOU protocol, 70.7% were able to achieve safe disposition, with 33% discharged to a family/friend and 31% discharged to a shelter.
Conclusion: Safe disposition following experience or disclosure of IPV and GBV in the ED is difficult, and social work staff have limited bandwidth to assist with navigation of accessing community-based resources. Through an average 24.3 hours of an extended ED observation protocol, 70% of patients were able to achieve a safe disposition. The EDOU supportive protocol substantially increased the proportion of the GBV survivors who experienced a safe discharge. [West J Emerg Med. 2023;24(3)615–621.]
INTRODUCTION
Intimate partner violence (IPV), sexual assault, and sex trafficking are forms of gender-based violence (GBV), which results in preventable morbidity and mortality. In the US, one in five women experience severe physical violence from an intimate partner during their lifetime; likewise, one in five women have experienced rape with even more experiencing any form of sexual violence.1 While human trafficking is especially hard to measure it is known to share the same risk and consequences
as IPV and sexual violence.2 Since the onset of the coronavirus 2019 (COVID-19) pandemic, GBV has increased in the US and globally.3–8 Gender-based violence describes violence toward an individual based on their gender; for our purposes we use the term to reference three forms of GBV IPV, sexual violence, and sex trafficking as these were the specific forms of violence measured within our study setting.
With GBV survivors seeking care in hospital emergency departments (ED) the need for survivor identification, medical
Volume 24, NO.3: May 2023 615 Western Journal of Emergency Medicine * † ‡ § Original Research
care, and safe discharge is acute. Many studies have sought to measure the presence of GBV cases in hospital EDs, but even before the pandemic accurate quantitative estimates were challenging to gather given stigma and survivor hesitancy to disclose experiences of abuse, violence, and exploitation.11–13
In addition to the barriers faced by survivors in seeking care, ED staff often face significant challenges in assessment and treatment of patients experiencing violence due to time constraints, insufficient training, and lack of systematic processes, including a process for referral to further services.13,14
Constraints on time in a fast-paced ED setting are barriers to the identification of GBV survivors.14,16 While screening can lead to survivor identification and help to reduce recurrent hospital visits, it also has a number of limitations, namely that it does not necessarily promote referral or linkage to community services.14,17–19 There is an urgent need to develop models for referral and community support services after survivors leave the ED. One study that examined the patterns of abuse reoccurrence after severe injury presence in the ED due to IPV found that only 19% of patients were referred to “advocacy,” regardless of severity of injury or likelihood of IPV reoccurrence.20 Additionally, these same patients were likely to have experienced severe violence and were at high risk for IPV reoccurrence and/or death. Successful efforts to improve GBV care and referral to services in EDs have included standardizing forms/ assessment tools, funding specialized nurses, staff training, and building electronic health records systems (EHR) to detect previous incidences of IPV.13,21
Social conditions and well-intended pandemic mitigation tactics exacerbated GBV including increased likelihood of abuse and exploitation, and loss of access to social supports and community resources.7,9,10 As the pandemic began in Spring 2020 ED clinicians at a large, safety net hospital in Atlanta GA, observed increased difficulty attaining safe discharge plans, including connections to community resources, for survivors of GBV. Our goal in this study was to assess the needs of survivors of IPV, sexual assault, and sex trafficking to secure a safe discharge plan following hospitalbased care.
METHODS Design
After receiving medical care, individuals who are clinically assessed as having experienced violence, have disclosed experiences of violence, or screen positively for IPV or sex trafficking are routinely referred to ED-based social worker to identify their need for social support services. Survivors of GBV presenting to EDs often rely on social workers to help identify a safe disposition plan. We examined the hospital’s ED social work encounters during 2019. This included both review of a social work patient log and associated EHR charts. After assessing the distribution of social work encounters, we conducted a chart review on
Population Health Research Capsule
What do we already know about this issue?
Gender-based violence (GBV) such as intimate partner violence and sex trafficking is prevalent; emergency department (ED) patients often require assistance to access a safe discharge plan.
What was the research question?
How frequently are ED patients unable to access a safe discharge, and does a novel ED observation protocol improve safe discharge
What was the major finding of the study?
Through a novel ED observation protocol, 70% of the patients who did not have a safe discharge plan were able to achieve one.
How does this improve population health?
Understanding facilitators of safe discharge plans such as an ED observation protocol allows EDs to support secondary prevention of re-injury or another form of GBV.
patients presenting to the ED in 2019 who reported IPV, sexual assault, or sex trafficking to determine disposition after their ED encounter.
In addition, beginning in April 2020, patients identified as survivors of IPV or sex trafficking with no safe discharge location and a desire for placement were assisted by an ED social worker to contact local shelters. If no bed was available, the patient was placed in the emergency department observation unit (EDOU) for assistance in further contacting local shelters, arranging transport to out-of-state family, and/or contacting supportive family or friends. A separate chart review was performed for the patients placed on the EDOU supportive care protocol over the first 18 months (April 1, 2020-September 30, 2021) to understand the feasibility of implementation and any barriers experienced in safe patient disposition.
Ethics
We obtained social work data through the hospital quality/performance improvement data request form process in compliance with the hospital data-use agreement. The Emory University Institutional Review Board determined that based on its nature as quality improvement this study did not meet the criteria for human subjects research and was exempt from review.
Western Journal of Emergency Medicine 616 Volume 24, NO.3: May 2023 Safe Discharge Needs Following ED Care for Gender Based Violence Clery et al.
Data Management and Analysis Social Worker Chart Review
Social workers in the ED record daily patient encounters in a shared Excel file (Microsoft Corporation, Redmond, WA) that is organized by month. The monthly ED social work records were combined into a single Excel file collating data from January 1–December 31, 2019. To assess the distribution of social work effort, we first sorted data based on the “problem” variable, an open-ended variable without coding or preset categorization. The entire dataset was categorized to the greatest extent based on the open-ended variable entry. Of the entries, we were able to categorize 69% into 11 service issues: traumatic injury resuscitation; medical resuscitation; transportation; family contact; housing/shelter; substance use disorder; IPV; sexual assault; human trafficking; non-partner abuse (violence perpetrated by someone who is not identified as a “partner” of the victim); and physical assault. The remaining 31% did not fall into one of these predetermined categories and were thus marked as “other.”
To identify and verify all 2019 encounters related to GBV, data cleaning began with an examination of the “problem” field. Encounters unrelated to IPV, sexual assault, or sex trafficking were excluded; some unspecified encounters that remained as the recorded problems were non-specific in nature. Next, we deleted duplicate entries (entries for the same patient encounter on the same date), leaving 2,201 charts for comprehensive review.
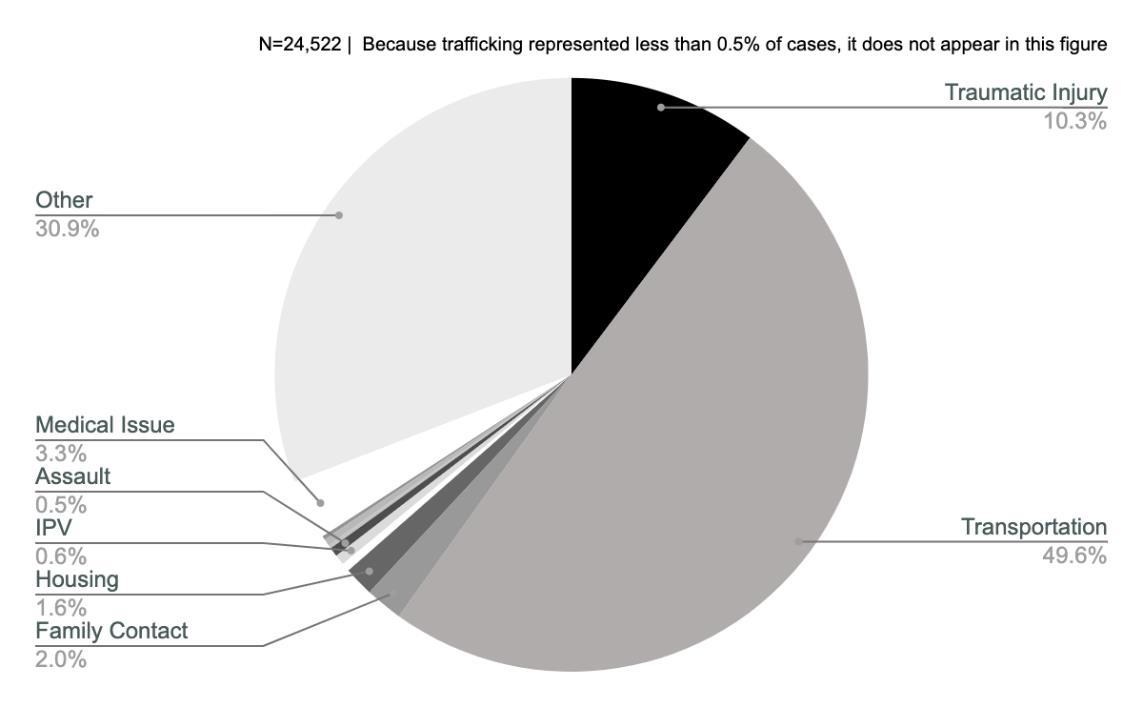
All EHR chart clinical notes were reviewed to confirm the “problem” category, resources provided, and ultimate disposition from the ED. We chose problem categories (domestic violence, sexual assault, human trafficking, shelter, financial resource counseling, manage police contact, other, unknown, unable to review) and disposition categories from standardized options (discharge to self, discharge to friend/family, discharge to home, discharge to domestic violence/human trafficking shelter, discharge to homeless shelter, admit, psychiatric admission, eloped), respectively. “Discharge to self” reflected being discharged without an identified home or shelter and typically reflected a patient being undomiciled without an available shelter bed identified; eloped referred to those individuals who left of their own accord without receiving further care. After chart review, identifiable information was removed and a unique identifier assigned to each entry. We ran basic descriptive statistics using Excel to assess the social work “problem” and disposition across survivors of IPV, sexual assault and sex trafficking.
ED Observation Unit Protocol Chart Review
We reviewed EDOU patient records for the “general observation” protocol between April 1, 2020– September 30, 2021, and found that 17 patients had received the observation protocol for safe disposition support related to IPV, sex trafficking, or sexual assault. We performed a chart review for the related clinical encounter for each patient identified and
reviewed clinician and social work notes from the encounter. Patient demographics, length of stay, barriers to discharge, and whether the encounter occurred on a weekend were recorded. Dispositions were chosen from standardized options (discharge to self, discharge to friend/family, discharge to home, discharge to domestic violence/human trafficking shelter, discharge to homeless shelter, admit, psychiatric admission, eloped). After chart review, we used Excel to run basic descriptive statistics to assess barriers to discharge and disposition across survivors of IPV, sexual assault, and sex trafficking.
RESULTS
In the ED, social workers were staffed 24 hours per day, seven days per week, and provided support in 24,522 patient encounters in 2019. Nearly 50% (12,164) of entries were related to arranging transportation, demonstrating the overwhelming burden of transportation logistics that is borne by the social work team in this ED. These tasks include checking insurance coverage, contacting medical transportation, and arranging transportation with hospitalbased transportation services. Other problem areas of note included responding to traumatic injury resuscitations (10.3%) and medical resuscitations (3.3%), assisting with family contact (2.0%;), and responding to housing needs (1.6%398). Notably, 138 of the ED social worker encounters were explicitly related to IPV (0.6%), 50 to sexual assault (0.2%), and 47 to sex trafficking (0.2%) (See Figure 1).
Through chart review we identified 245 unique social worker encounters for IPV in 2019. Almost all the entries reflect separate individuals, although 24 individuals were treated for IPV more than once in the year. We found that 97 IPV patients (40%) were discharged with no identified safe shelter, essentially being discharged to the street (Table 1). The proportion of patients discharged without a safe
Volume 24, NO.3: May 2023 617 Western Journal of Emergency Medicine Clery et al. Safe Discharge
Following ED Care for Gender Based Violence
Needs
Figure 1. Social work effort by problem at a public hospital emergency department in Atlanta, Georgia (2019).
Safe Discharge Needs Following ED Care for Gender Based Violence
to a general homeless shelter.
There were 94 social work encounters for sexual assault in 2019 (Table 3). A total of 53 (56%) sexual assault survivors were recorded as discharged to self; however, the disposition was less reliably recorded for victims of sexual assault, likely reflecting lack of explicit disposition planning unless sexual assault occurred in their residence. Among sexual assault survivors, 30 (32%)were experiencing homelessness in a way that was associated with the assault. This included individuals who accepted invitations for shelter or use of amenities due to experiencing homelessness and subsequently being sexually assaulted, as well as individuals who were victimized while homeless and traveling or sleeping in a public space.
In response to the COVID-19 pandemic, a protocol for
plan or shelter increased across later shifts (37% between 7 am –3 pm ; 40% from 3 pm -11 pm ; and 44% from 11 pm -7 am ). We found that 69 patients (≈28%) were discharged to a family member or friend with whom they felt safe, and 49 (20%) felt safe returning to their own home with notes often reflecting the assailant had been arrested or was not living in the same home. Only 14 patients (6%) were discharged to a domestic violence shelter. Social work notes typically reflected assisting the patient in calling one or more of the local domestic violence shelters and being told there were no beds available. Thirteen patients (≈5%) were admitted to the hospital for additional medical care.
During 2019, 45 recorded social work encounters followed a positive screen for sex trafficking, of which 19 (42%) were identified as likely having experience of sex trafficking. Nine patients (≈50%) who were identified with likely experience of trafficking were “discharged to self” with no safe shelter or community organization assistance (Table 2). Four patients (≈20%) were discharged either to home (two) or with family or friends (two) who were reported to be safe. Two patients (≈10%) were discharged to a human trafficking or domestic violence shelter, and two (10%) were discharged
extended observation in the EDOU was established to assist with the safe discharge for survivors of GBV. Over 18 months (April 1, 2020–September 30, 2021) 35 survivors of IPV (58%), 10 survivors of sex trafficking, and 10 of non-partner violence were placed on the EDOU supportive care protocol. All identified as female, except for one who identified as transgender female and one male. The average length of stay in the EDOU was 24.3 hours. Among cases placed on the EDOU supportive care protocol 41 patients (70.7%) were able to achieve safe disposition. Of those on the protocol for IPV, 29% had been previously treated for IPV within the prior year. Eighteen patients (≈31%) who participated in the EDOU supportive care protocol were ultimately discharged to a shelter and 19 (33%) were discharged to a family or friend they were able to contact during the extended observation, while 17 (29%) were ultimately “discharged to self” with recommendations to pursue local homeless shelter services (Table 4). Patients were relatively less likely to be discharged to a shelter bed on a weekend (40% weekday; 25% weekend). The primary barrier to safe disposition for 28 survivors of IPV and sex trafficking (62.2%) was shelter bed availability, but for four patients (9%)
Western Journal of Emergency Medicine 618 Volume 24, NO.3: May 2023
et al.
Clery
Disposition N (%) Discharge to self 9 (47.40%) Discharge to domestic violence/ human trafficking shelter 2 (10.50%) Discharge to family/friend 2 (10.50%) Discharge to home (Safe disposition) 2 (10.50%) Discharge to homeless shelter 2 (10.50%) Psychiatric admission 2 (10.53%) Total 19 (100%)
Table 2. Disposition of survivors identified with a likely experience of sex trafficking after hospital-based care in a public hospital in Atlanta, Georgia (2019).
Disposition N (%) Discharge to self 97 (39.59%) Discharge to family/friend 69 (28.16%) Discharge to home (safe disposition) 49 (20.00%) Discharge to domestic violence/ human trafficking shelter 14 (5.7%) Admitted to hospital 13 (5.3%) Discharge to homeless shelter 2 (0.82%) Eloped 1 (0.41%) Psychiatric admission 0 (0%) Total 245
Table 1. Disposition survivors of intimate partner violence after hospital-based care at a public hospital in Atlanta, Georgia (2019).
Disposition N (%) Discharge to self 53 (56.38%) Discharge to home (safe disposition) 20 (21.28%) Discharge to family/friend 10 (10.64%) Psychiatric admission 4 (4.26%) Discharge to homeless shelter 3 (3.19%) Admit 2 (2.13%) Discharge to domestic violence/human trafficking shelter 1 (1.06%) Eloped 1 (1.06%) Total 94
Table 3. Disposition of sexual assault survivors after hospitalbased care in a public hospital in Atlanta, Georgia (2019).
transportation to shelter and for one patient (2%) substance use disorder were also noted as barriers to disposition.
DISCUSSION
We examined social work encounters at a large, safety-net hospital in metropolitan Atlanta during 2019 to understand the safe discharge needs of survivors of IPV, sexual assault and sex trafficking. Our finding that over 50% of recorded encounters were related to arranging transportation demonstrates the overwhelming burden of transportation logistics that is borne by the ED social work team. These appear to be tasks that may be undertaken by a clerk rather than licensed social workers with specialized clinical skills. Health systems could consider task-shifting logistical responsibilities from clinicians to clerical or support staff and partnering with municipal transit authorities as well as private ride-share organizations to provide vouchers to those in need.
Safe housing was a major unmet need among GBV survivors. We found that 40% of IPV survivors and 47% of sex trafficking survivors were discharged without confirmed safe housing. One third (32%) of sexual assaults in this analysis were directly related to the experience of homelessness. All survivors of violence would benefit from safe dispositions planning; for survivors of sexual assault, the hospital may leverage standard Sexual Assault Forensic Exam protocols so that all survivors are evaluated for a safe discharge plan. Survivors of sex trafficking would benefit from increased coordination between hospital-based care and community-based anti-trafficking organizations that could provide early wraparound services and emergency shelter. Survivors of IPV would benefit from increased bed capacity at IPV-specific shelters, while all survivors would benefit from increased temporary shelter access.
The EDOU supportive care protocol was created in response to the spike in domestic crimes in Atlanta at the outset of the COVID-19 pandemic during the time when stayat-home orders were in effect and domestic violence crimes increased weekly while local shelters operated with limited capacity.22 The EDOU supportive care protocol was designed to support the most isolated patients experiencing violence who do not have an immediate support network to offer safe
shelter; the protocol allows for up to 48 hours of social work assistance in shelter placement for victims of IPV and sex trafficking and included collaboration with a local IPV shelter manager to build the capacity and enhance contacts for ED social work staff. While the EDOU supportive care protocol was borne out of the pandemic, it has continued to serve as a critical bridge between the most isolated patients experiencing IPV and sex trafficking and needed shelter and support resources. The EDOU supportive protocol substantially increased the proportion of GBV survivors who experienced safe discharge through increased time to access communityand personal-support networks. In the future this program should be more rigorously evaluated to determine its effect on improved hospital-based care and uptake of community-based social services.
This initial review of the EDOU supportive care protocol raises specific concerns for the safe-discharge needs of chronically undomiciled survivors. For undomiciled IPV survivors, traditional IPV social support services may be especially challenging to access. In such cases, while IPV may not displace an undomiciled individual from their home, it may disrupt a relationship that is protective against other forms of violence, or it may otherwise be difficult to remain safe when discharged.
Likewise, a significant proportion of sexual assault survivors also experienced homelessness in a way that was related to the assault (such as being coerced into sex and assaulted in exchange for shelter or being assaulted while sleeping in a public space). This highlights the vulnerabilities to violence created by a lack of shelter as well as the importance of securing shelter after receiving hospital-based care in the wake of experiencing violence. Shelter resources for individuals who are chronically undomiciled, have psychiatric medical conditions, or substance use disorder are needed as these populations are likely simultaneously more at risk for abuse or coercion and more difficult to engage in services. Individuals experiencing both violence and substance use disorder likely need specialized intersectional resources such as treatment with buprenorphine and toxicology clinic support services while in shelters or programs.
The EDOU supportive care protocol demonstrated that safe disposition for survivors of violence is more possible with additional dedicated time and supportive effort. While provided by ED social workers in this model, such supportive care is also an integral component of patient navigation programs, which could be a complement to an EDOU supportive care protocol. With the intention of providing a patient-centered and holistic model of care, patient navigation aims to make the transition to care easier for patients by removing barriers.23 Patient navigation programs have shown improved health outcomes for patients, reduced unmet needs, increased self-efficacy, increased access to care, and heightened patient satisfaction. Additionally, patient navigation services improved patients’ satisfaction with
Volume 24, NO.3: May 2023 619 Western Journal of Emergency Medicine Clery et al. Safe Discharge Needs Following ED Care for Gender Based Violence
Disposition location N (%) Discharged to family/friend 19 (32.75%) Discharged to shelter 18 (31.03%) Discharge to self 17 (29.31%) Other 4 (6.89%) Safe disposition total 41 (70.68%)
Table 4. Safe disposition location for survivors of gender-based violence after participation in a hospital-based extended care protocol in a public hospital in Atlanta, Georgia (2020-2021).
Safe Discharge Needs Following ED Care for Gender Based Violence
healthcare clinicians, increased their communication with community services, and led to stronger care coordination.23
LIMITATIONS
Efforts to improve safe disposition for IPV survivors require increased social work effort, including repeated calls to community service partners and follow-up evaluations to reassess patients. The analysis of social worker tasks did not account for the time burden that different tasks or problems require.
Because the study site serves as a rape crisis center, survivors of sexual assault routinely receive care from designated Sexual Assault Nurse Examiners with evidence collection, crisis counselor assistance, and post- exposure prophylaxis treatment for sexually transmitted disease. On occasional shifts when there is no rape crisis counselor on call, social workers provide counseling and education regarding support services. Thus, social worker encounters related to sexual assault only represent a subset of the patients evaluated at this study site following such experience. Likewise, during the review period there were also specific nurse leaders who assisted victims of sex trafficking to contact partner organizations and assist with shelter. Those who were helped by nursing did not require social work evaluation and therefore were not included in this analysis. Other patients who eloped or left before social work evaluation were also not likely recorded in the social work encounters.
This review included encounters with patients who overwhelmingly identified as female, although some male survivors were identified. This may reflect a clinical failure to adequately screen for or recognize IPV or sex trafficking in the male population. The 2020-2021 portion of this study took place during the COVID-19 pandemic. The limitations associated with this context include the strain on public resources during the pandemic, as well as the observed increase in GBV that occurred during the pandemic. This context may limit the applicability and usefulness of the proposed protocol in a non-pandemic time. Finally, this study took place in a single hospital setting; while the results are not generalizable they may inform efforts in other hospital locations.
CONCLUSION
Survivors of gender-based violence seeking hospitalbased care often have acute social support needs. In our study site social worker time was largely spent on transportation logistics with a very small proportion of encounters being explicitly tied to experiences of IPV, sexual assault or sex trafficking. A significant proportion of GBV survivors required safe housing but were unable to obtain it, placing them at risk for further violence, abuse, and exploitation. The supportive protocol of the emergency department observation unit substantially increased the proportion of GBV survivors who experienced a safe discharge.
ACKNOWLEDGMENTS
Summary of findings:
• ED social work staff experience limited bandwidth to assist with navigation of accessing community-based resources for safe disposition from the emergency department following experience or disclosure of IPV and GBV.
• 40% of patients who experienced IPV and 47% who experienced sex trafficking were discharged with no safe shelter identified.
• Experience of homelessness was associated with 32% of the patients treated for sexual assault.
• Through an average 24.3 hours of an extended ED observation protocol, 70% of patients were able to achieve a safe disposition.
Implications for practice, policy, and research:
• Survivors of GBV who are treated in the ED have immediate need for additional safe disposition resources including additional shelter capacity.
• Enhanced services such as extended observation protocol and patient navigators would likely improve survivors’ experience of successfully accessing available community resources.
• Shelter availability would also protect survivors from further risk of GBV associated with the experience of homelessness.
The authors wish to acknowledge the support of Nicole Gonzalez and Liesl Schnabel for their support of the manuscript, as well as the Injury Prevention Research Center at Emory University.
Address for Correspondence: Michael Clery, MD MPP, Emory University Department of Emergency Medicine, 531 Asbury Circle, Annex Building, Suite N340, Atlanta, GA 30322. Email: mclery@ emory.edu
Conflicts of Interest: By the WestJEM article submission agreement, all authors are required to disclose all affiliations, funding sources and financial or management relationships that could be perceived as potential sources of bias. No author has professional or financial relationships with any companies that are relevant to this study. There are no conflicts of interest or sources of funding to declare.
Copyright: © 2023 Clery et al. This is an open access article distributed in accordance with the terms of the Creative Commons Attribution (CC BY 4.0) License. See: http://creativecommons.org/ licenses/by/4.0/
REFERENCES
1. Houry DE, Smith SG, Chen J, et al. The National Intimate Partner and Sexual Violence Survey (NISVS) | 2010-2012 State Report The National Intimate Partner and Sexual Violence Survey (NISVS): 2010-2012 State Report. 2017. Available at: https://www.cdc.gov/ violenceprevention/pdf/NISVS-StateReportBook.pdf. Accessed
Western Journal of Emergency Medicine 620 Volume 24, NO.3: May 2023
Clery et al.
February 11, 2023.
2. Centers for Disease Control and Prevention. Violence Prevention: Sex Trafficking. Centers for Disease Control and Prevention. 2022. Available at: https://www.cdc.gov/violenceprevention/sexualviolence/ trafficking.html. Accessed February 11, 2023.
3. Piquero AR, Jennings WG, Jemison E, et al. Domestic violence during the COVID-19 pandemic: evidence from a systematic review and meta-analysis. J Crim Justice. 2021;74:101806.
4. Wood L, Baumler E, Schrag RV, et al. “Don’t know where to go for help”: safety and economic needs among violence survivors during the COVID-19 Ppandemic. J Fam Violence. 2022;37(6):959-67.
5. Jetelina KK, Knell G, Molsberry RJ. Changes in intimate partner violence during the early stages of the COVID-19 pandemic in the USA. Inj Prev. 2021;27(1):93-7.
6. al Mamun F, Hosen I, Mamun MA. Sexual violence and rapes’ increment during the COVID-19 pandemic in Bangladesh. EClinicalMedicine. 2021;34:100817.
7. Coxen J, Castro V, Carr B, et al. COVID-19 pandemic’s impact on online sex advertising and sex trafficking. 2021. Available at: https:// osf.io/preprints/socarxiv/tfyj5/. Accessed February 11, 2023
8. Rockowitz S, Stevens LM, Rockey JC, et al. Patterns of sexual violence against adults and children during the COVID-19 pandemic in Kenya: A prospective cross-sectional study. BMJ Open 2021;11(9):1-8.
9. Schrag RV, Leat S, Wood L. “Everyone is living in the same storm, but our boats are all different”: safety and safety planning for survivors of intimate partner and sexual violence during the COVID-19 pandemic. J Interpers Violence. 2022; 37(23–24),
NP21775–NP21799
10. Williams EE, Arant KR, Leifer VP, et al. Provider perspectives on the provision of safe, equitable, trauma-informed care for intimate partner violence survivors during the COVID-19 pandemic: a qualitative study. BMC Womens Health. 2021;21(1):1-11.
11. Roberts GL, O’Toole BI, Lawrence JM, et al. Domestic violence victims in a hospital emergency department. Med J Aust 1993;5(159):307-10.
12. Goldberg Pp, Moore JL, Barron CE. Domestic minor sex trafficking: guidance for communicating with patients. Hosp Pediatr
2019;9(4):308-10.
13. Basu S, Ratcliffe G. Developing a multidisciplinary approach within the ED towards domestic violence presentations. Emerg Med J 2014;31(3):192-5.
14. Hinsliff-Smith K, McGarry J. Understanding management and support for domestic violence and abuse within emergency departments: a systematic literature review from 2000–2015. J Clin Nurs 2017;26(23-24):4013-27.
15. Wood L, Schrag RV, Baumler E, et al. On the front lines of the COVID-19 pandemic: occupational experiences of the Intimate Partner Violence and Sexual Assault Workforce. J Interpers Violence 2022;37(11-12):NP9345-NP9366.
16. McGarry J, Nairn S. An exploration of the perceptions of emergency department nursing staff towards the role of a domestic abuse nurse specialist: a qualitative study. Int Emerg Nurs. 2015;23(2):65-70.
17. O’Doherty L, Hegarty K, Ramsay J, et al. Screening women for intimate partner violence in healthcare settings. Cochrane Database Syst Rev. 2015;2015(7):1-85.
18. Kaltiso SAO, Greenbaum VJ, Moran TP, et al. Feasibility of a screening tool for sex trafficking in an adult emergency department. Acad Emerg Med. 2021;28(12):1399-408.
19. Stoklosa H, Showalter E, Melnick A, et al. Health care providers’ experience with a protocol for the identification, treatment, and referral of human-trafficking victims. J Hum Traffick. 2017;3(3):182-92.
20. Hackenberg EAM, Sallinen V, Handolin L, et al. Victims of severe intimate partner violence are left without advocacy intervention in primary care emergency rooms: a prospective observational study. J Interpers Violence. 2021;36(15-16):7832-7854.
21. Egyud A, Stephens K, Swanson-Bierman B, et al. Implementation of human trafficking education and treatment algorithm in the emergency department. J Emerg Nurs. 2017;43(6):526-31.
22. Evans DP, Hawk SR, Ripkey CE. Domestic violence in Atlanta, Georgia, before and during COVID-19. Violence Gend 2021;8(3):140-7.
23. Valaitis RK, Carter N, Lam A, et al. Implementation and maintenance of patient navigation programs linking primary care with communitybased health and social services: a scoping literature review. BMC Health Serv Res. 2017;17(1):1-14.
Volume 24, NO.3: May 2023 621 Western Journal of Emergency Medicine
Gender
Clery et al. Safe Discharge Needs Following ED Care for
Based Violence
Optimal Image Gain Intensity of Point-of-care Ultrasound when Screening for Ocular Abnormalities in the Emergency Department
Melissa Chang, BS*
Nicole Finney, MPH*
Jessa Baker, MD†
Jonathan Rowland, MD†
Shreya Gupta, BS†
Reem Sarsour, BS†
Soheil Saadat, MD, MPH, PhD†
John C. Fox, MD†
Section Editor: Robert R. Ehrman, MD
University of California, Irvine School of Medicine, Irvine, California University of California, Irvine, Department of Emergency Medicine, Irvine, California
Submission history: Submitted December 24, 2022; Revision received January 31, 2023; Accepted March 6, 2023
Electronically published May 5, 2023
Full text available through open access at http://escholarship.org/uc/uciem_westjem
DOI: 10.5811/westjem.59714
Introduction: Point-of-care ultrasound (POCUS) plays a pivotal role in evaluating ocular complaints in the emergency department (ED). The rapid and non-invasive nature of ocular POCUS makes it a safe and informative imaging modality. Previous studies have investigated using ocular POCUS to diagnose posterior vitreous detachment (PVD), vitreous hemorrhage (VH), and retinal detachment (RD); however, there are few studies that assess image optimization techniques and how they impact the overall accuracy of ocular POCUS.
Methods: We performed a retrospective review of ED patients who received ocular POCUS examinations and ophthalmology consultations as part of their evaluation for eye complaints at our urban, Level I trauma center ED from November 2017–January 2021. Of 706 exams, 383 qualified for the study. In this study we primarily investigated how stratified gain levels impact the accuracy of ocular POCUS for detection of any posterior chamber pathology and, secondarily, whether stratified gain levels impact the accuracy of detecting RD, VH, and PVD specifically
Results: The images were found to have an overall sensitivity of 81% (76-86%), specificity of 82% (76-88%), positive predictive value (PPV) of 86% (81-91%), and negative predictive value (NPV) of 77% (70-83%). Images acquired with a gain of (25, 50] had a sensitivity of 71% (61-80%), specificity of 95% (85-99%), PPV of 96% (88-99%), and NPV of 68% (56-78%). Images acquired with a gain of (50, 75] had a sensitivity of 85% (73-93%), specificity of 85% (72-93%), PPV of 86% (75-94%), and NPV of 83% (70-92%). Images acquired with a high gain (75, 100] had a sensitivity of 91% (8297%), specificity of 67% (53-79%), PPV of 78% (68-86%), and NPV of 86% (72-95%).
Conclusion: In the ED setting, high (75, 100] gain on ocular POCUS scanning has a higher degree of sensitivity for detecting any posterior chamber abnormality, as compared to low (25, 50] gain levels. Thus, incorporating the use of high gain for ocular POCUS exams produces a more effective tool for ocular pathologies in acute care settings and may be particularly valuable in resource-limited settings. [West J Emerg Med. 2023;24(3)622–628.]
INTRODUCTION
Point-of-care ultrasound (POCUS) plays a pivotal role in the evaluation of ocular complaints in the emergency
department (ED). The rapid and non-invasive nature of ocular ultrasounds enables practitioners to assess the eye, regardless of periorbital swelling, making ocular ultrasound a safe and
Western Journal of Emergency Medicine 622 Volume 24, NO.3: May 2023 * † Original Research
informative imaging modality.1 Eye complaints, including primary ophthalmologic pathology, infectious problems, and traumatic injuries, account for approximately 2-3% of all ED visits.2,3 A six-year analysis of eye-related ED visits found that 41.2% of ocular problems could be classified as emergent.4 Ocular complaints have a spectrum of severity, many of which require rapid diagnosis for appropriate treatment and recovery. Rapid diagnosis of retinal detachment (RD) is needed to prevent irreversible vision loss,5 whereas posterior vitreous detachment (PVD) is generally a benign condition.6
Ocular POCUS has been shown to accurately detect PVD, vitreous hemorrhage (VH), and RD in the ED setting,3,7-14 and previous research has shown emergency physicians (EP) to have high diagnostic accuracy with ocular POCUS. Blaivas et al performed a study (n=61) in a community ED with a residency program, which resulted in a sensitivity of 100% and specificity 97.2% in identifying a variety of ocular pathologies.10 Shinar et al found EPs at an academic center to have a sensitivity of 97% and a specificity of 92% in diagnosis of RD.13 Similarly, Yoonessi et al found academic EPs to have a sensitivity of 100% and a specificity of 83% in RD diagnosis with ocular POCUS.11 Baker et al found that academic EPs are “modestly accurate” at differentiating ocular diagnoses such as PVD (86% diagnostic accuracy) vs RD (74.6% diagnostic accuracy).12
While it has been established that POCUS can accurately detect these specific posterior vitreous pathologies, little is known as to whether over-gaining or under-gaining an ocular ultrasound image may ultimately result in erroneous diagnoses or missed abnormalities. One ophthalmologic report of B-scan ultrasonography use suggests that over-gaining an image can create a hyperechoic posterior vitreous humor; these artifactual internal echoes can result in false positives for RD or VH.15 However, this has not been evaluated using POCUS. Contrary to that, a protocol described by Gandhi et al notes that high-gain settings must be used to detect PVDs, while normal or low-gain settings are sufficient for RDs and VHs.6 We primarily investigate retrospectively how various gain levels impact the accuracy of ocular POCUS for detection and identification of any posterior chamber pathology. Secondarily, we focused specifically on RD, VH, and PVD to determine whether different gain levels impact the accuracy of detecting and identifying these specific pathologies. There are few studies that assess image optimization techniques and how they impact the overall accuracy of POCUS; establishing optimal gain settings for ocular ultrasound may improve ED diagnostic accuracy and efficiency by minimizing false positive and false negative diagnoses.
METHODS
We performed a retrospective review of ED patients who received ocular POCUS examinations and ophthalmology consultations as part of their evaluation for eye complaints at our urban, Level I trauma center ED from November 2017–
Population Health Research Capsule
What do we already know about this issue?
Point-of-care ultrasound can accurately identify ophthalmologic pathologies, including retinal detachment, vitreous hemorrhage, and posterior vitreous detachment.
What was the research question?
How do stratified gain levels impact the accuracy of detection of posterior chamber pathologies?
What was the major finding of the study?
High gain has increased sensitivity (91%, CI 82-97%) for detecting posterior chamber abnormalities compared to low gain (71%, CI 61-80%).
How does this improve population health?
Incorporating high gain for ocular POCUS exams is an effective screening tool for detecting ocular pathologies in acute care and resource-limited settings.
January 2021. We included adults aged 18 or older with a documented chief complaint of acute vision change if the following three conditions were met: 1) an ocular POCUS was documented via a “procedure note” in the electronic health record (EHR); 2) ophthalmology consultation was the gold standard for final diagnosis; and 3) there were stored images of the POCUS scan. Of the 706 patient charts that were accessed and reviewed, 383 met these characteristics. Exclusion criteria included incarcerated patients or those on a psychiatric hold. All research followed best practices of retrospective chart review as described by Worster and Bledsoe16 and was approved by the institutional review board at our institution.
Ocular POCUS was performed by resident, fellow, and attending physicians. Any scans performed by residents were reviewed in real time by their supervising fellow or attending physician, which consisted of 53 fellows and attendings in total. All fellow and attending physicians were credentialed in interpretation of ocular ultrasound examinations and had performed at least 25 ocular scans in their own training or in the credentialing process. Every POCUS exam was performed with the Mindray TE7 ultrasound system (Mindray DS USA Inc., Mahwah, NJ) using the high-frequency linear probe. The gain values from 0-100 are displayed on the screen during use and were captured during the image/
Volume 24, NO.3: May 2023 623 Western Journal of Emergency Medicine Chang et al. Optimal Image Gain Intensity of POCUS when Screening for Ocular Abnormalities
Optimal Image Gain Intensity of POCUS when Screening for Ocular Abnormalities
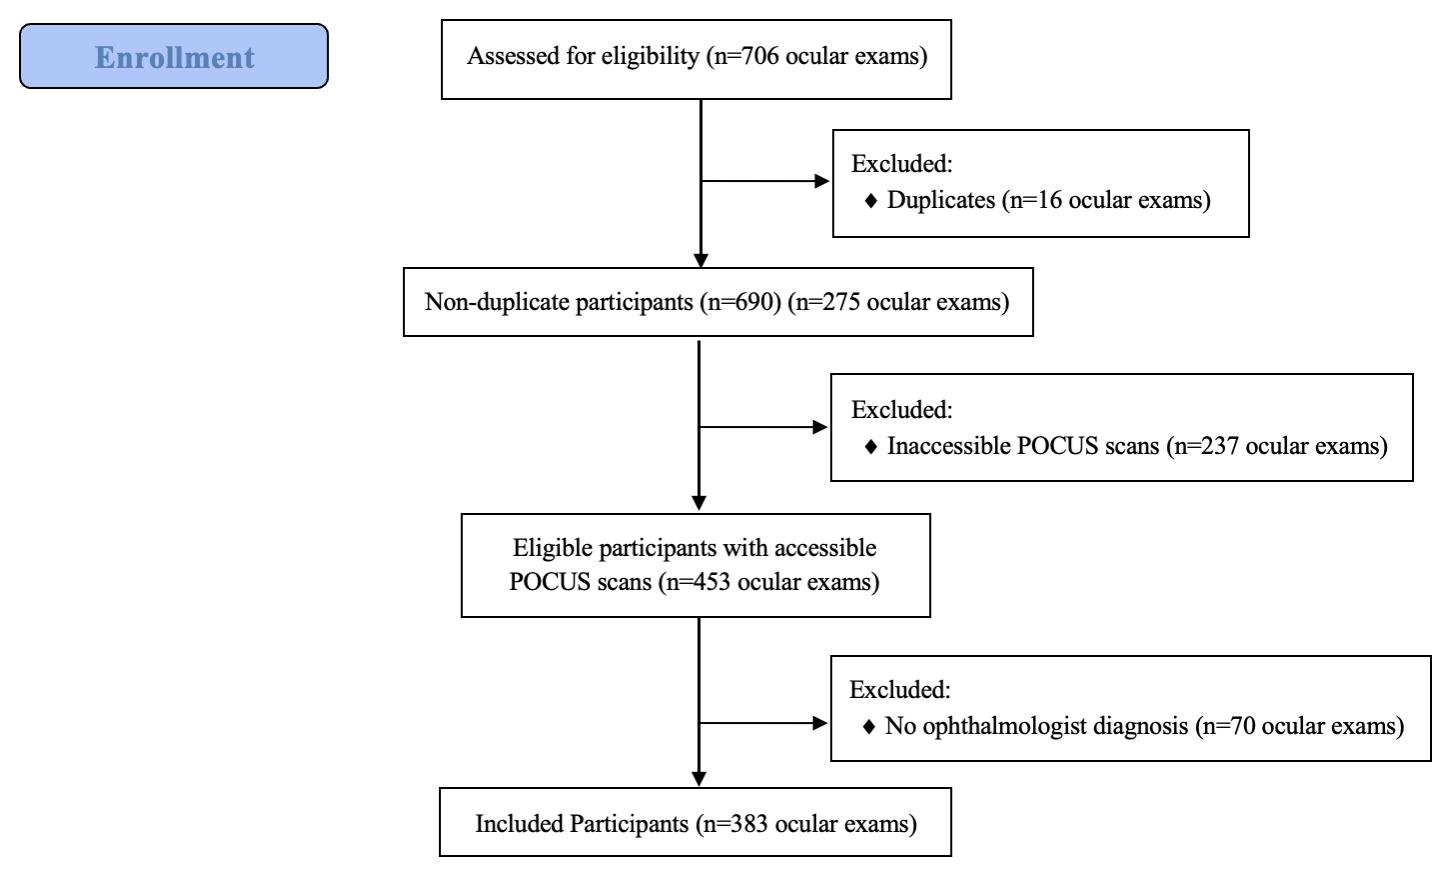
clip recording process. Gain is used for contrast resolution and is uniform amplification of the ultrasound signal that is returning to the transducer; therefore, it does not have any units of measurement. It is standardized across machines and brands, although auto-gain settings differ from brand to brand and differ based on probe and exam setting used. Auto-gain using the ocular setting on the Mindray TE7 is set to 48-55; however, clinicians do not always use the auto-gain setting.
We identified ocular US examinations through the billing reports provided by the coders. If ophthalmology consultation was obtained in the same visit, and the saved ocular US images could be reviewed, then that subject was eligible for enrollment. Chart reviewers were provided a standardized data collection form that was developed a priori (ED POCUS interpretation [PVD, VH, RD, normal], ophthalmology final diagnosis, and gain level used), and they were trained to collect necessary data points from the EHR. Chart reviewers then screened the obtained data for discrepancies, errors, or missing data points. Incomplete or erroneous ocular exams were excluded. Chart reviewers were blinded to the study endpoint. Original clinician interpretation of the US study documented in the EHR was used for ocular US exam findings. Two ultrasound fellows manually verified data.
The gain used by clinicians when scanning ranged from 29-100. Study participants were divided into three roughly equal groups by gain, and from this division we determined the stratified gain levels for analysis purposes as (25, 50] low gain; (50, 75] intermediate gain; and (75, 100] high gain. Each group had 147, 112, and 124 participants, respectively. A true positive or negative was operationally defined as a matching diagnosis that is detectable or undetectable through ocular POCUS (such as PVD, VH, RD, etc), respectively. We calculated sensitivity, specificity, positive predictive value (PPV), and negative predictive value (NPV) using the ophthalmologist’s final diagnosis as the gold standard. We analyzed data using STATA 17 (StataCorp LLC, College Station, TX), and we calculated test characteristics using “diagti” command.17 Continuous variables are reported as mean ± SD, and frequencies as N (%). Sensitivity and specificities are reported as point estimates (95% confidence interval).
RESULTS
A total of 706 records were accessed for this study. All duplicates (16) were removed. We excluded 237 patients due to the ocular ultrasound files having been corrupted or not saved. Lastly, 70 records did not have a final ocular diagnosis and were, therefore, excluded. We analyzed 383 (50.7%) charts that met inclusion criteria (Figure 1). The mean age was 49.2±15.8 years, and 207 (54.0%) were male. The right eye was affected in 187 patients (48.8%). Most common comorbidities included hypertension in 159 patients (41.5%) and diabetes in 132 patients (34.5%), while 48 (12.5%) had a history of glaucoma, 34 (8.9%) had prior RD, one (0.2%) had prior PVD, and there were zero patients (0%) with prior VH.
Per the ophthalmology final diagnoses, VH was the most
Chang
diagnosed ocular pathology with a total of 84 cases (21.9%), followed by RD in 64 cases (16.7%), and PVD in 50 cases (13.1%). The total diagnoses amount to greater than 383 patients included in the study due to several patients having multiple ocular findings. Other final diagnoses included “no pathology noted,” or less common ocular pathologies, some of which are not always seen on POCUS: specifically, metamorphopsia; diabetic retinopathy; traumatic retinopathy; glaucoma; cataracts; vitreous degeneration; preretinal hemorrhage; papilledema; keratitis; conjunctivitis; iritis; optic nerve edema; macular holes; and macular edema.
In our primary analysis we looked at the ability of EPs to detect any posterior chamber abnormality on ocular POCUS, and how the accuracy of detection changed at stratified gain levels (Figure 2). The images were found to have an overall sensitivity of 81% (76-86%), specificity of 82% (76-88%), PPV of 86% (8191%), and NPV of 77% (70-83%). This was then further stratified by gain level, as shown in Figure 2. For the secondary analysis, we analyzed accuracy of detection of PVD, VH, and RD by EPs using ocular POCUS at stratified gain levels.
For the diagnosis of RD (Figure 3), there were 63 (16.4%) cases confirmed by ophthalmology gold standard. Overall, the images had a sensitivity of 97% (89-100%), specificity of 92% (88-94%), PPV of 70% (59-79%), and NPV of 99% (98-100%). This was then further stratified by gain level, as described in Figure 3. For the secondary analysis of PVD diagnosis (Figure 4), there were 47 (12.3%) cases confirmed by ophthalmology gold standard. Overall, the images had a sensitivity of 20% (10-34%), specificity of 95% (92-97%), PPV of 39% (20-59%), and NPV of 89% (85-92%). This was then further stratified by gain level, as described in Figure 4.
For the secondary analysis of VH diagnosis (Figure 5), there were 84 (21.9%) cases confirmed by ophthalmology gold standard. Overall, the images had a sensitivity of 76%
Western Journal of Emergency Medicine 624 Volume 24, NO.3: May 2023
al.
et
Figure 1. Flow chart of participants included (n= 383) and excluded (n=323) in the study. POCUS, point of care ultrasound.
Chang et al.
Optimal Image Gain Intensity of POCUS when Screening for Ocular Abnormalities
TP, true positive; FP, false positive; FN, false negative; TN, true negative; PPV, positive predictive value; NPV, negative predictive value; CI, confidence interval.
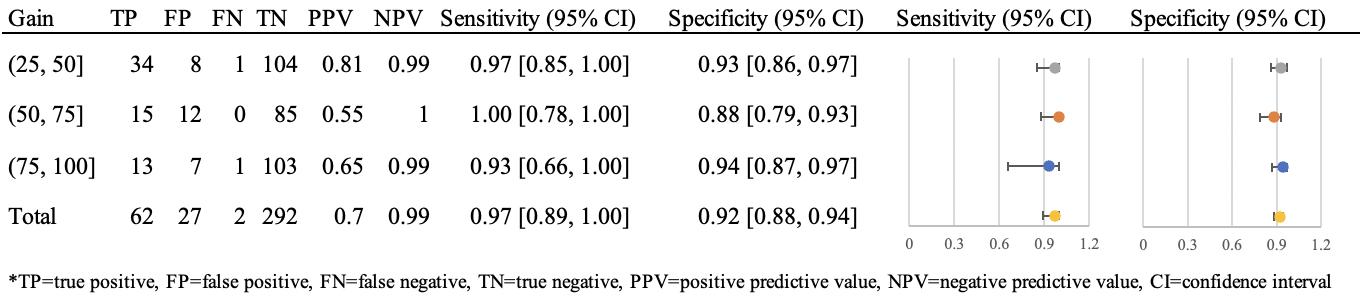
(66-85%), specificity of 85% (81-89%), PPV of 59% (4969%), and NPV of 93% (89-96%). This was then further stratified by gain level, as described in Figure 5.
DISCUSSION
In this retrospective study, we aimed to investigate the accuracy of identification of posterior chamber pathologies at stratified gain levels. We found that increasing the gain for (or “overgaining”) ocular POCUS images allowed for increased sensitivity. The high-gain level (75, 100] was more sensitive than low-gain level (25, 50] for detecting these pathologies as confirmed by the gold standard ophthalmology consult (Figure 2). Higher sensitivity is preferable in ocular ultrasound; the cost of missing a case (ie, false negative), especially in the case of a RD, may result in vision loss, which would be life-altering for a patient, whereas the consequence of a false positive would result in potentially unnecessary specialist workup. Lower gains (26, 50] have the highest specificity for ruling in posterior chamber pathology but the greatest chance of missing pathology due to lower sensitivity. Therefore, when using ocular ultrasound as a screening modality, it is advantageous to incorporate higher gain levels.
Few previous studies have discussed that higher gain levels may be associated with increased false positive rates;3,15 however, high-gain levels have also been shown to be better for identifying posterior chamber abnormalities.6 Complementing our recommendation that high gains be incorporated into ocular POCUS exams, Shiner et al and
Lahham et al. suggest that ultrasonographers should slowly adjust the ultrasound gain level while scanning to increase the likelihood of capturing pathology.3,13
Prior research has shown that the sensitivity of ocular POCUS in detecting a variety of ocular pathologies ranges from 97-100%, and that specificity ranges from 83-97.2%.10-13 For specific posterior chamber pathologies, high-gain settings have been recommended to detect PVDs, while normal or low-gain settings are sufficient for RDs and VHs.6 In our study, regardless of gain, ED ultrasonographers using POCUS perform well in the diagnosis of RD (sensitivity 97%) and are moderately accurate in diagnosing VH (sensitivity 76%).
In our secondary analysis, looking at stratified gain levels by specific pathology (RD, PVD, and VH), we found that sensitivities and specificities did vary depending on pathology. When stratified additionally into low-, intermediate-, and high-gain levels, our results for the detection of RD showed high sensitivity and specificity across all gain levels (Table 3), supporting the guidelines that low gains are sufficient to detect RD, and adding that high gains do not preclude accurate diagnoses. Due to its high sensitivity, POCUS can be considered a reliable screening tool for RD; therefore, ocular POCUS training in residencies should be promoted and incorporated into nearly all examinations for complaints of vision changes. As mentioned previously, the cost of missing a case, especially a RD, may be life-altering for a patient, whereas the consequence of a false positive would result in further specialist workup that later may turn out to be unnecessary.
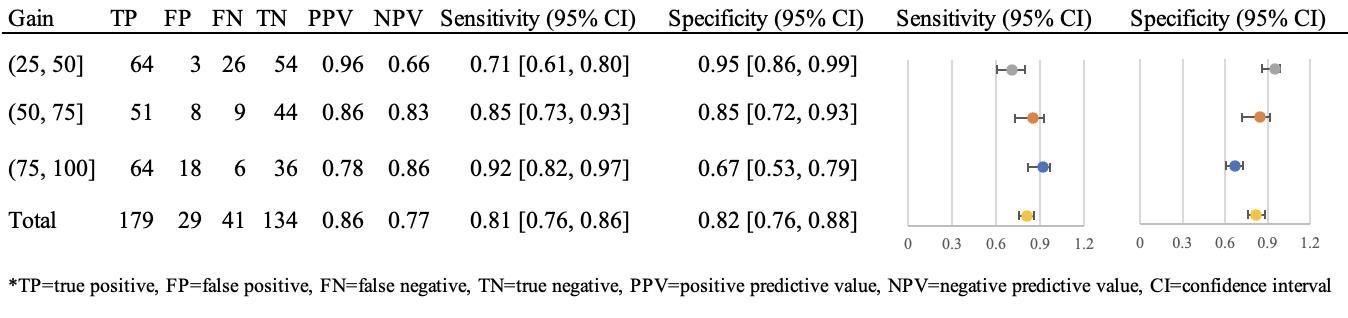
Volume 24, NO.3: May 2023 625 Western Journal of Emergency Medicine
Figure 2. Diagnostic characteristics of emergency department ocular point-of-care ultrasound to detect any posterior chamber pathology.
TP, true positive; FP, false positive; FN, false negative; TN, true negative; PPV, positive predictive value; NPV, negative predictive value; CI, confidence interval.
Figure 3. Diagnostic characteristics of emergency department ocular point-of-care ultrasound to detect retinal detachment.
Lastly, since POCUS for RD has an acceptable specificity, it could serve as a reliable diagnostic tool to escalate to ophthalmological intervention, which may be beneficial in the outpatient setting or in underserved areas where ophthalmology is not readily available.
For PVD, there was a statistically significant increase in sensitivity at higher gain levels compared to lower gain levels; however, there were overall low sensitivities across all gain levels (Figure 4), suggesting that ocular POCUS may not be as effective at detecting PVD. It is possible that this is due to one of the following: 1) previous studies have noted that PVDs require higher gains; therefore, if PVDs are present along with other pathology, the ultrasonographer may have needed to increase to higher gains to catch the additional finding of PVD; or 2) there is a range of vitreous degeneration that may lead to PVD; however, the ophthalmologist’s diagnosis of vitreous degeneration was not counted as a PVD unless specifically stated. Specificity was high for all gain levels (93-97%); however, clinically this is of lower importance given that EPs are not typically screening specifically for PVDs, and these are often incidentally detected when looking for an intervenable pathology such as a RD.
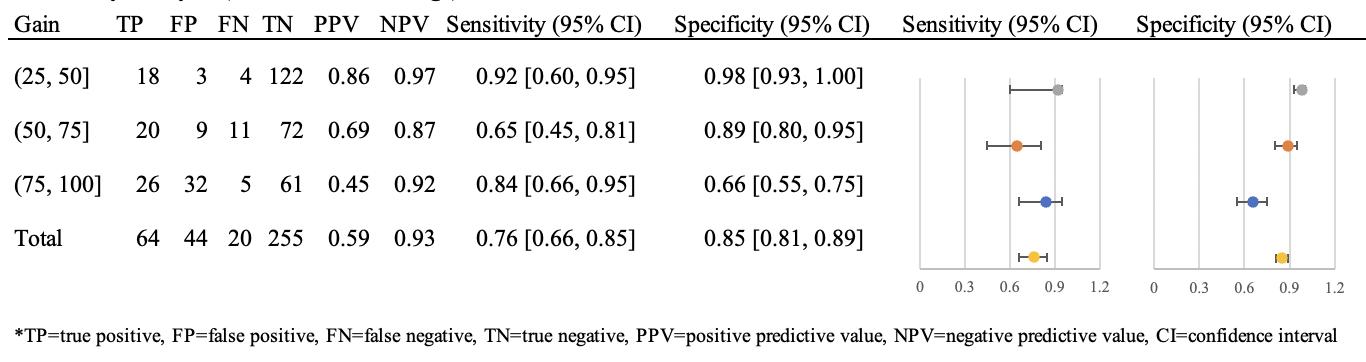
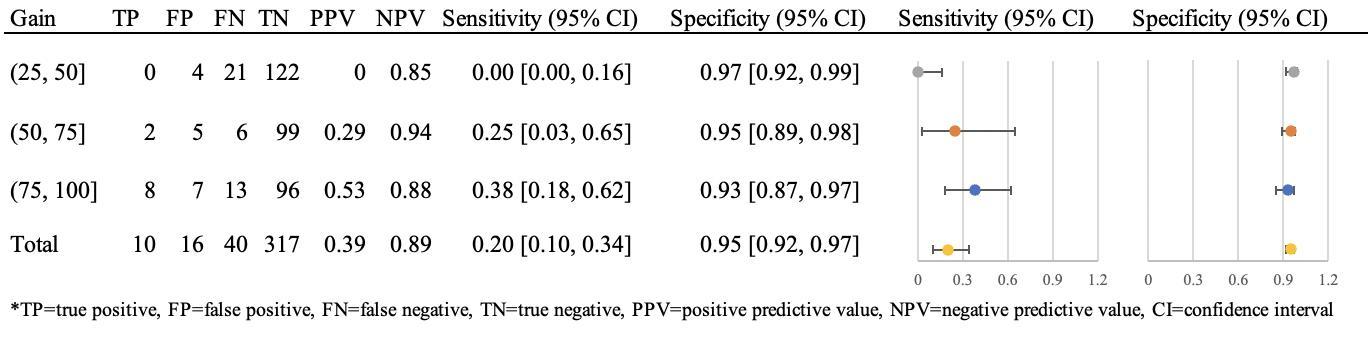
Lastly, for VH, low gain had higher specificity compared to high gain (Figure 5). We did not find a difference in sensitivity of ocular US in detecting VH at different gain levels, which may reflect a limitation in sample size.
Nevertheless, our results show that using low-gain levels as opposed to high-gain levels for suspected VHs minimize false positives.
Given the frequency of eye complaints seen in the ED2 and given that nearly half of them can be classified as emergent, the use of high gain on ocular POCUS exam can provide a manner to screen for these emergent cases to ensure that RDs that can be intervened upon are not missed. Most non-academic EDs do not have ophthalmologists readily available, making screening methods important tools for allocating limited resources. This could have particularly profound implications in resource-strained settings such as rural areas where ophthalmology consult may be miles away or nonexistent.
LIMITATIONS
This study has several important limitations. A few studies have shown that the range and speed at which ultrasound gain levels are adjusted influence which pathologies are detected.3,13 Due to this study’s retrospective nature, the full range of gains that the physician ultrasonographer may have used were not obtained, and only when the user saved an image were we able to assess the gain level used for that image/clip. It is commonly taught and typical for users to increase the gain while performing ocular POCUS; therefore, our data may not have captured pathology that was noted by
Western Journal of Emergency Medicine 626 Volume 24, NO.3: May 2023 Optimal Image Gain Intensity of POCUS when Screening for Ocular Abnormalities Chang et al.
Figure 4. Diagnostic characteristics of emergency department ocular point-of-care ultrasound to detect posterior vitreous detachment.
TP, true positive; FP, false positive; FN, false negative; TN, true negative; PPV, positive predictive value; NPV, negative predictive value; CI, confidence interval.
Figure 5. Diagnostic characteristics of emergency department ocular point-of-care ultrasound to detect vitreous hemorrhage.
TP, true positive; FP, false positive; FN, false negative; TN, true negative; PPV, positive predictive value; NPV, negative predictive value; CI, confidence interval.
the EP at a lower gain but was only captured when saving images at a higher gain. If this is the case, sensitivity at lower gains would likely be improved and specificity would be decreased. Additionally, our study did not capture the length of time spent scanning each specific patient; it is worth considering whether patients with a higher pretest probability for concerning pathology were scanned for a longer duration of time and, therefore, were more likely to have had more accurate interpretations of their scans.
Another limitation is the potential for selection bias. Only those patients with an ocular ultrasound and an ophthalmology consult were included in the study. While this likely influenced the resulting test characteristics, this is also the population of greatest concern with a higher pretest probability for a RD or other concerning ocular pathology. The decision to perform an ocular ultrasound and consult ophthalmology represents the clinical judgment of the clinician, and ophthalmology consults are more likely to be obtained in more concerning cases; therefore, this was the population studied. Given that the ophthalmologic exam was used as the diagnostic gold standard, it is likely that patients with a low pretest probability were excluded.
Excluding patients with a low pretest probability either by not performing ocular POCUS or not consulting ophthalmology likely would result in an overestimation of the true sensitivity of ocular POCUS. Our results could be further corroborated by a prospective study design in which all patients presenting to the ED with an ocular concern receive an ophthalmologist consult, although this would be limited by institutional resources.
In addition, this study was conducted at an academic institution with an established emergency medicine residency and ultrasound fellowship programs, leading to a strong emphasis on ultrasound training and the use of ultrasound. All physician sonographers have had a baseline amount of training to perform and interpret ocular POCUS, and this may not be generalizable to all academic programs or private practices. Lastly, this study stratified the analysis by gain level, and further by disease (PVD, VH, RD) in the secondary analysis. This additional stratification led to smaller sample sizes in each specific disease-gain category, which may have affected the power of the analysis. As different pathology is seen at different gain levels,6,13 further study is warranted to corroborate optimal gain settings for each specific eye pathology.
CONCLUSION
In the ED setting, high (75, 100] gain on ocular POCUS scanning has a higher degree of sensitivity for detecting any posterior chamber abnormality, as compared to lower (25, 50] gain levels. Thus, incorporating the use of high gain for ocular POCUS exams is an effective screening tool for ocular pathologies in acute care settings and may be particularly valuable in resource-limited settings.
Address for Correspondence: J. Christian Fox, MD, University of California, Irvine, Department of Emergency Medicine, 3800 West Chapman Ave, Suite 3200, Orange, CA 92868. Email: jfox@hs.uci.edu.
Conflicts of Interest: By the WestJEM article submission agreement, all authors are required to disclose all affiliations, funding sources and financial or management relationships that could be perceived as potential sources of bias. No author has professional or financial relationships with any companies that are relevant to this study. There are no conflicts of interest or sources of funding to declare.
Copyright: © 2023 Chang et al. This is an open access article distributed in accordance with the terms of the Creative Commons Attribution (CC BY 4.0) License. See: http://creativecommons.org/ licenses/by/4.0/
REFERENCES
1. Babineau MR, Sanchez LD. Ophthalmologic procedures in the emergency department. Emerg Med Clin North Am. 2008;26(1):17-vi.
2. Marx JA, Hockberger RS, Walls RM. Background and epidemiology. In: Rosen’s Emergency Medicine: Concepts and Clinical Practice. 8th ed. Philadelphia, PA: Elsevier Health Sciences; 2013:909.
3. Lahham S, Ali Q, Palileo BM, et al. Role of point of care ultrasound in the diagnosis of retinal detachment in the emergency department. Open Access Emerg Med. 2019;11:265-70.
4. Channa R, Zafar SN, Canner JK, et al. Epidemiology of eye-related emergency department visits. JAMA Ophthalmol. 2016;134(3):312-9.
5. Pastor JC, Fernández I, Rodríguez de la Rúa E, et al. Surgical outcomes for primary rhegmatogenous retinal detachments in phakic and pseudophakic patients: the Retina 1 Project--report 2. Br J Ophthalmol. 2008;92(3):378-82.
6. Gandhi K, Shyy W, Knight S, et al. Point-of-care ultrasound for the evaluation of non-traumatic visual disturbances in the emergency department: the VIGMO protocol. Am J Emerg Med 2019;37(8):1547-53.
7. Gottlieb M, Holladay D, Peksa GD. Point-of-care ocular ultrasound for the diagnosis of retinal detachment: a systematic review and meta-analysis. Acad Emerg Med. 2019;26(8):931-9.
8. Chu HC, Chan MY, Chau CWJ, et al. The use of ocular ultrasound for the diagnosis of retinal detachment in a local accident and emergency department. Hong Kong J Emerg Med. 2017;24(6):263-7.
9. Propst SL, Kirschner JM, Strachan CC, et al. Ocular point-of-care ultrasonography to diagnose posterior chamber abnormalities: a systematic review and meta-analysis. JAMA Netw Open 2020;3(2):e1921460.
10. Blaivas M, Theodoro D, Sierzenski PR. A study of bedside ocular ultrasonography in the emergency department. Acad Emerg Med 2002;9(8):791-9.
11. Yoonessi R, Hussain A, Jang TB. Bedside ocular ultrasound for the detection of retinal detachment in the emergency department. Acad Emerg Med. 2010;17(9):913-7.
12. Baker N, Amini R, Situ-LaCasse EH, et al. Can emergency
Volume 24, NO.3: May 2023 627 Western Journal of Emergency Medicine
Chang et al. Optimal Image Gain Intensity of POCUS when Screening for Ocular Abnormalities
Optimal Image Gain Intensity of POCUS when Screening for Ocular Abnormalities
physicians accurately distinguish retinal detachment from posterior vitreous detachment with point-of-care ocular ultrasound? Am J Emerg Med. 2018;36(5):774-6.
13. Shinar Z, Chan L, Orlinsky M. Use of ocular ultrasound for the evaluation of retinal detachment. J Emerg Med. 2011;40(1):53-7.
14. Lahham S, Shniter I, Thompson M, et al. Point-of-care ultrasonography in the diagnosis of retinal detachment, vitreous hemorrhage, and vitreous detachment in the emergency department. JAMA Netw Open. 2019;2(4):e192162.
Chang et al.
15. Waldron RG. Contact B-scan ultrasonography. Emory Eye Center 2003:1–9.
16. Worster A, Bledsoe RD, Cleve P, et al. Reassessing the methods of medical record review studies in emergency medicine research. Ann Emerg Med. 2005;45(4):448-51.
17. Seed P. DIAGT: Stata module to report summary statistics for diagnostic tests compared to true disease status. Statistical Software Components S423401, Boston College Department of Economics. 2001, revised 19 Feb 2010.
Western Journal of Emergency Medicine 628 Volume 24, NO.3: May 2023
Emergency Department Preparedness to Care for Sexual Assault Survivors: A Nationwide Study
Kristen Chalmers, BA*
Meredith Hollender, BS, MPP*
Liam Spurr, BS*
Ramya Parameswaran, MD, PhD†
Nicole Dussault, MD, MS‡
Jeanne Farnan, MD, MHPE*
Sonia Oyola, MD§
Keme Carter, MD*
Section Editor: David Thompson, MD
University of Chicago Pritzker School of Medicine, Department of Medicine, Chicago, Illinois
University of California San Francisco Health, San Francisco, California Duke University, Duke University Medical Center, Department of Internal Medicine, Durham, North Carolina
University of Chicago Pritzker School of Medicine, Department of Family Medicine, Chicago, Illinois
Submission history: Submitted October 28, 2022; Revision received January 6, 2023; Accepted February 2, 2023
Electronically published April 26, 2023
Full text available through open access at http://escholarship.org/uc/uciem_westjem
DOI: 10.5811/westjem.59257
Introduction: Emergency departments (ED) provide trauma-informed care to sexual assault (SA) survivors and connect them with comprehensive services. Through surveying SA survivor advocates, we aimed to 1) document updated trends in the quality of care and resources offered to SA survivors and 2) identify potential disparities according to geographic regions in the US, urban vs rural clinic locations, and the availability of sexual assault nurse examiners (SANE).
Methods: We conducted a cross-sectional study between June-August 2021, surveying SA advocates who were dispatched from rape crisis centers to support survivors during ED care. Survey questions addressed two major themes in quality of care: staff preparedness to provide traumaresponse care; and available resources. Staff preparedness to provide trauma-informed care was assessed through observations of staff behaviors. We used Wilcoxon rank-sum and Kruskal-Wallis tests to analyze differences in responses according to geographic regions and SANE presence.
Results: A total of 315 advocates from 99 crisis centers completed the survey. The survey had a participation rate of 88.7% and a completion rate of 87.9%. Advocates who indicated that a higher proportion of their cases were attended by SANEs were more likely to report higher rates of traumainformed staff behaviors. For example, the recalled rate of staff asking patients for consent at every step of the exam was significantly associated with SANE presence (P < 0.001). With respect to access to resources, 66.7% of advocates reported that hospitals often or always have evidence collection kits available; 30.6% reported that resources such as transportation and housing are often or always available, and 55.3% reported that SANEs are often or always part of the care team. The SANEs were reported to be more frequently available in the Southwest than in other US regions (P < 0.001) and in urban as opposed to rural areas (P < 0.001).
Conclusion: Our study indicates that support from sexual assault nurse examiners is highly associated with trauma-informed staff behaviors and comprehensive resources. Urban-rural and regional disparities exist regarding access to SANEs, suggesting that elevating nationwide quality and equity in care of survivors of sexual assault requires increased investments in SANE training and coverage. [West J Emerg Med. 2023;24(3)629–636.]
Volume 24, NO.3: May 2023 629 Western Journal of Emergency Medicine * † ‡ § Original Research
INTRODUCTION
Sexual assault (SA) is a nationwide public health crisis with long-term health consequences. Within the United States, 43.6% of women and 24.8% of men experience some form of contact sexual violence within their lifetime.1 Survivors of SA bear the burden of both acute and long-lasting sequelae, including injuries, sexually transmitted diseases, and an increased risk of chronic physical and mental health problems.2
Emergency departments (ED) play a critical role in serving the approximately 21% of SA survivors who seek acute medical attention.3 Ideally, EDs provide survivors with comprehensive services to address their physical and mental health needs, including crisis counseling, sexually transmitted infection management, emergency contraception, and HIV exposure management.4,5 Survivors are also offered the option to complete a SA examination kit to obtain forensic evidence. This includes swabbing the vagina, rectum, and mouth, plucking and combing head and pubic hairs, and obtaining fingernail scrapings and blood samples.6,7 The interpersonal dynamic between ED staff and patient is critical during these invasive procedures. While positive interactions can be empowering to SA survivors, negative interactions with ED staff can increase SA survivors’ risk of post-traumatic stress symptomatology and decrease their likelihood of seeking further medical and legal assistance.8-10
Many EDs use additional support from specialized sexual assault response teams when caring for SA survivors. These teams typically consist of SA patient advocates and/or sexual assault nurse examiners (SANE). The SA patient advocates serve as first-response crisis counselors, assist survivors in navigating the medical and legal processes in the ED, and provide referrals to follow-up support services.11 The SA patient advocates are volunteers or staff members at sexual violence crisis centers who are dispatched to hospitals to assist with SA patient cases.12 SANEs are registered nurses trained in trauma-informed approaches to survivors’ medical care, conducting forensic examinations and providing forensic documentation in legal cases.13-15 Budgetary constraints, scheduling, or a lack of contracts between hospitals, SANE programs, and/or rape crisis centers lead to many SA patients receiving specialized support from only a SA advocate, a SANE, or neither.16
Providing SA survivors with high-quality care can be challenging for many hospitals. A 2013 survey of US hospitals found that only ~20% provided survivors with comprehensive services, including SA crisis counseling, sexually transmitted infection management, HIV management, and emergency contraception.17 Furthermore, small, qualitative studies suggest that ED staff have low self-efficacy when working with SA patients.18 Despite SA-related ED visits in the US increasing from 3,607 in 2006 to 55,296 in 2019, there is limited research documenting how EDs have responded to this increase in utilization volume.19 Additionally, there are no nationwide perspectives on the quality of care offered to SA patients in EDs
Population Health Research Capsule
What do we already know about this issue?
Unites States’ emergency departments provide post-assault care to over 55,000 sexual assault (SA) survivors per year. The quality of trauma-informed care and resources offered are highly variable.
What was the research question?
Are there disparities in the care offered to SA survivors according to geography (region and urban vs rural)?
What was the major finding of the study?
The availability of SA nurse examiners (SANE), which is lower in rural compared to urban areas (P<0.001), is positively associated with traumainformed care (P<0.001) to the benefit of SA patients.
How does this improve population health?
Elevating nationwide quality and equity in SA survivor care requires increased investments in SANE training and coverage.
in the wake of societal shifts such as the #MeToo movement, which has led to changes in societal perceptions of survivors and their treatment in other medical settings.20-22
When studying nationwide trends and potential disparities in ED care of SA survivors, patient advocates can serve as reliable sources of information.8 As observers of numerous SA ED cases, patient advocates have valuable insight into SA patients’ ED experiences, and their nationwide presence allows for widespread data collection. The most recent surveys of ED care of SA survivors in the US are not nationwide. For example, testimony by the US Government Accountability Office on the availability of forensic examiners was limited to data collection from six states. Therefore, more comprehensive data collection is needed. Our aim in this study, therefore, was to survey advocates to 1) document updated trends in the quality of care and resources offered to SA survivors, and 2) identify potential disparities with regard to SANE and resource availability in EDs according to US geographic regions and urban vs rural clinic locations.
METHODS
Our methods are reported according to the Checklist for Reporting Results of Internet E-Surveys (CHERRIES).23
We developed an electronic survey to explore two major themes in ED preparedness in caring for SA patients: staff preparedness and physical resources. Staff preparedness to provide trauma-informed care was assessed through
Western Journal of Emergency Medicine 630 Volume 24, NO.3: May 2023 ED Preparedness to Care for Sexual Assault Survivors Chalmers et al.
advocates’ observations of staff behaviors that previous studies have identified as potentially retraumatizing, such as expressing disbelief or blame and not providing thorough explanations of care.9,24,25 Assessment of physical resources included questions regarding how frequently hospitals had evidence collection kits available, in addition to access to resources such as transportation and emergency housing. To assess the validity of the online survey, we conducted cognitive interviews with three SA patient advocates via Zoom video call (Zoom Video Communications, San Jose, CA), and iterative changes were made to ensure survey clarity.26,27 A link to the full survey is available in Appendix 1.
Patient advocates for SA victims were recruited from participating rape crisis centers via email. We identified participating rape crisis centers via online search and contacted them via phone and email. Of 137 centers with advocacy services where study team members spoke directly to center staff, 135 agreed to distribute the survey to their SA patient advocates. After agreeing to assist with survey distribution, staff at participating centers sent the survey link and background information to their SA patient advocates via email. Before providing consent via an online survey form, participating SA patient advocates were provided information about the research aims, study time commitment, privacy risks, and investigator contact information. Participants were offered the opportunity to enter a raffle for a $250 gift card as a survey incentive.
Survey responses were captured automatically via the secure REDcap platform hosted at University of Chicago between June-August 2021. Survey data were stored separately from identifiable participant data that was collected for recruitment purposes. The survey included between 57100 items (dependent on adaptive questioning) distributed over four pages. Survey respondents were able to review and change their answers using a back button. Surveys that were terminated early were included in the analysis.
To analyze differences in survey responses between geographic regions in the US and between urban and rural clinic locations, we first coded Likert-type survey responses on a five-point ordinal scale. Data from the US Department of Agriculture were used to classify the county within which rape crisis centers were located as urban or rural.28 We used non-parametric tests to assess differences in these ordinal values across comparison groups. A Wilcoxon rank-sum test was used for comparisons between two groups, and we used a Kruskal-Wallis test for comparisons of more than two groups. Correlations between two ordinal variables were assessed using a Spearman correlation. All statistical tests were two-sided and performed using R v4.0.5 (R Foundation for Statistical Computing, Vienna, Austria). Adjusted P-values to control the false discovery rate were computed using the Benjamini-Hochberg method; an adjusted P-value of < 0.05 was considered significant.29 The institutional review board at the study institution approved the study procedures.
RESULTS
The survey had a participation rate (unique webpage viewers who agreed to participate out of total unique first survey-page views) of 88.7% and a completion rate (unique webpage viewers who finished the survey out of total unique views who agreed to participate) of 87.9%. A total of 321 advocates from 119 crisis centers responded to the survey. Crisis centers represented 44 states and ranged from rural crisis centers serving numerous counties to crisis centers affiliated with urban, academic medical centers. Participant demographic information is summarized in Table 1.
Quality-of-care Trends
Figure 1 presents selected quality-of-care indicators related to clinician attitudes and behaviors. Over half of respondents (53.2%) reported that they observe ED staff conveying skepticism, either verbally or non-verbally, about a patient’s account of SA sometimes, often, or always. Approximately one-quarter of respondents (28.35%) reported observing ED staff blaming survivors for the circumstances of their SA sometimes, often, or always. Similar proportions of advocates recalled that health professionals sometimes, often, or always thoroughly explain all medical care/each step of the exam and ask for consent at every step of the exam (83.6%
Volume 24, NO.3: May 2023 631 Western Journal of Emergency Medicine Chalmers et al. ED Preparedness to Care for Sexual Assault Survivors
Characteristics (N = 315) n, % Racial/ethnic background White 218, 79.0% Black 20, 7.2% Hispanic/LatinX 41, 14.9% Asian 10, 3.6% Native American/Alaskan Native 5, 1.8% Native Hawaiian /Pacific Islander 1, 0.4% Other 4, 1.4%
Identity Female-identifying 254, 92.4% Male-identifying 10, 3.6% Non-binary/gender fluid 9, 3.3% Prefer not to say 2, 0.7% Age (mean, standard deviation) 37.5, 13.0 Number of years of experience as advocate (mean, standard deviation) 4.6, 4.8 Number of patient experiences as a survivor advocate 1-20 104, 37.9% 20-50 62, 22.7% 50+ 108, 39.4%
Table 1. Demographic data of survey participants.
Participant
Gender
and 78.4%, respectively), and 43.9% of advocates stated that they sometimes, often, or always recalled ED staff pressuring survivors to complete the exam or file a police report. Rates of recalled empathy were high: 95.6% of advocates reported that ED staff were sometimes, often, or always empathetic towards SA survivors.
Quality-of-care Disparities
There were no significant differences in quality-of-care indicators related to provider attitudes and behaviors between US geographical regions or urban vs. rural regions. However, advocates who indicated that a higher proportion of their cases were attended by SANEs were more likely to report higher rates of trauma-informed staff behaviors. Notably, the recalled rate of ED staff explaining all medical care and asking patients for consent at every step of the exam was significantly associated with SANE presence (P < 0.001).
Hospital Resource Trends
Figure 2 presents indicators of hospital preparedness, including protocols, ED staff preparedness, and resources. Indicators of procedural inefficiencies were common. A high percentage (70.7%) of advocates reported that patients sometimes, often, or always experience long wait times (>30 minutes) between different steps of their visit, including moving from the waiting room to an examination room, starting the medical forensic exam, medications, follow-up education, and discharge papers. A similar percentage of
advocates (71.5%) recalled that survivors sometimes, often, or always must repeat their assault story to multiple members of the care team.
In assessing ED staff preparedness, 65.8% of advocates recalled that ED staff were sometimes, often, or always comfortable completing a medical forensic exam. A notable percentage of advocates (18.0%) reported that ED staff were never or rarely comfortable completing a medical forensic exam. While most hospitals have the resources to conduct forensic medical examinations, resources to meet survivors’ comprehensive needs are less consistent. For example, while 78.8% of advocates recalled that hospitals sometimes, often, or always have SA evidence collection kits available, only 57.9% of advocates recalled that hospitals sometimes, often, or always have resources to support patients after discharge, such as clothes for patients to change into, vouchers for follow-up care, and information to address survivors’ basic needs, such as transportation and emergency housing. Nearly three-quarters (74.4%) of advocates reported that the patient care team was sometimes, often, or always supported by a SANE.
Hospital Resources: Geographic Disparities
With respect to differences in hospital preparedness among both US geographical regions and urban vs rural regions, SANEs were more often part of the care team in the Southwest than in other US regions (P < 0.001). SANEs were also more frequently present in urban as opposed to rural areas (P <0.001). Advocates who indicated that a higher
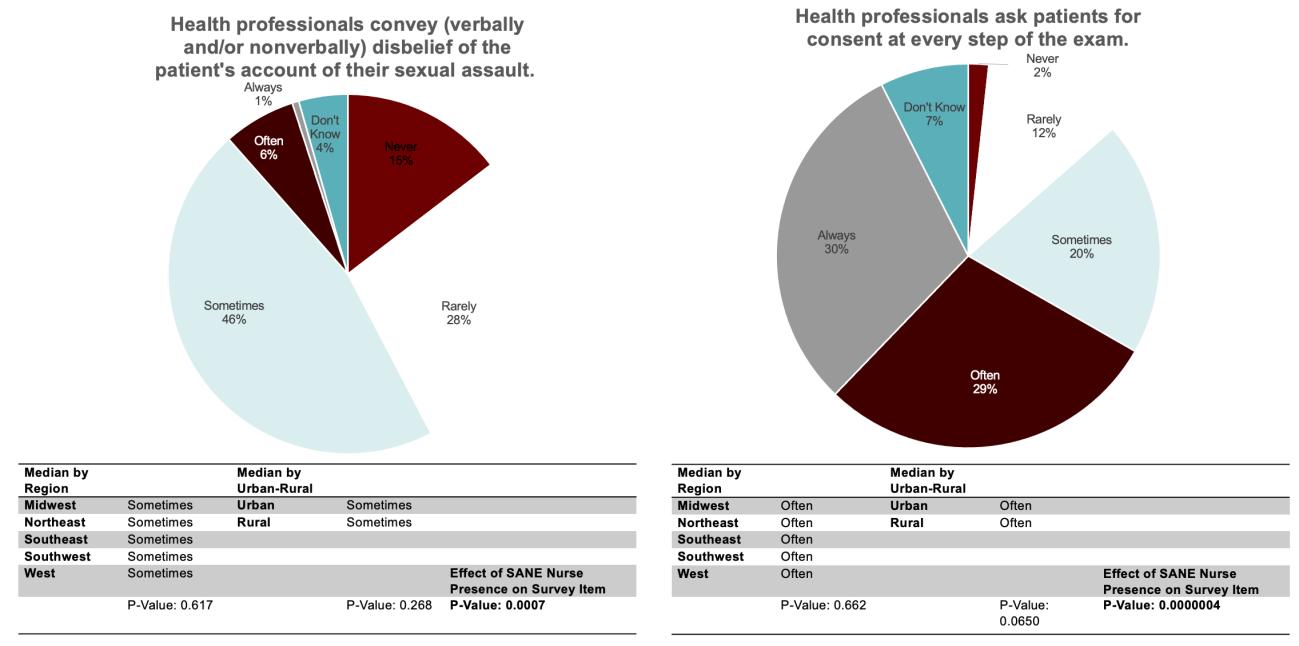
Western Journal of Emergency Medicine 632 Volume 24, NO.3: May 2023 ED Preparedness to Care for Sexual Assault Survivors Chalmers et al.
Figure 1. Selected quality-of-care indicators: clinician attitudes and behaviors. SANE, Sexual Assault Nurse Examiner.
proportion of their cases were attended by SANEs were more likely to report higher rates of several components of hospital preparedness, including shorter waiting times, lower rates of survivors repeating their story, ED staff comfort with the medical exam, availability of forensic exam kits, and availability of follow-up resources (Figure 2). SANE presence was most highly associated with ED staff being comfortable completing a medical forensic exam (P <0.001) and the availability of post-discharge resources (P< 0.001).
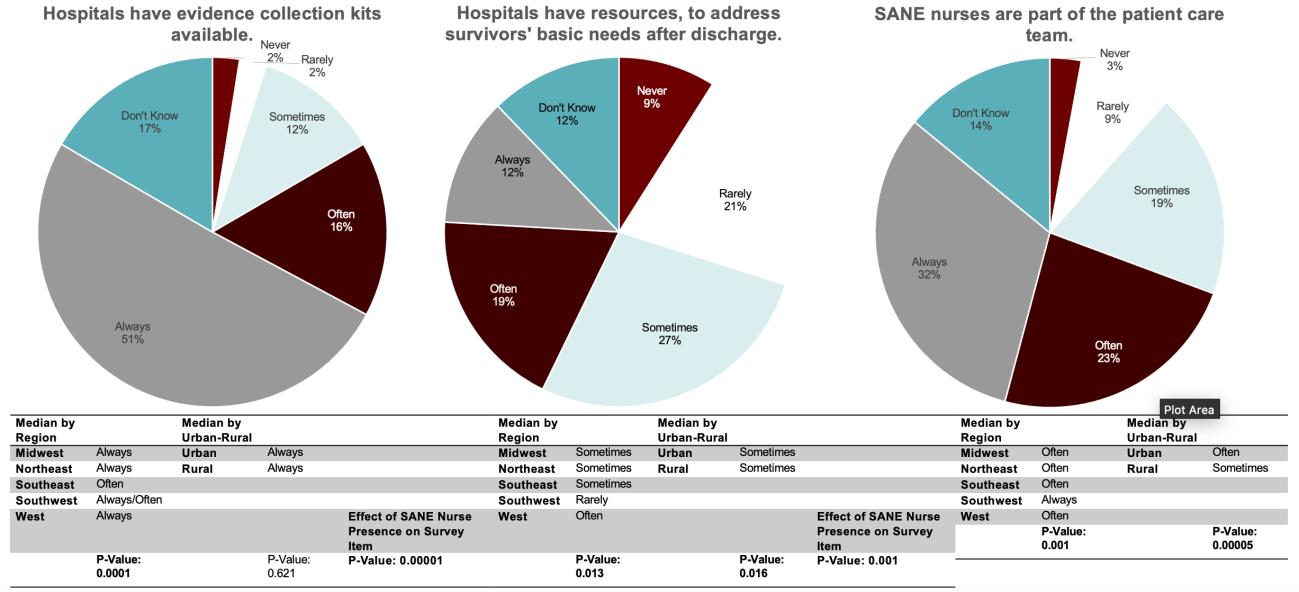
DISCUSSION
Evolving societal perceptions of SA have changed the ED care of SA survivors, with increased ED utilization and advancing standards for trauma-informed care.19 However, our study reveals widespread variations in the quality of traumainformed care and delivery of appropriate post-SA resources. Increased SANE presence is highly associated with more consistent observations of trauma-informed ED staff-patient interactions, as well as improved delivery of comprehensive resources to address patients’ medical and social needs. When comparing urban to rural regions of the US, patients seeking care in urban regions are more likely to be supported by a SANE.
Our findings on quality-of-care indicators related to clinician attitudes and behaviors, including levels of conveyed disbelief and blame, indicate that SA survivors who present to hospitals nationwide may be exposed to retraumatizing interactions. This study provides a nationwide perspective on the prevalence of negative interactions between SA survivors and ED staff that have been previously documented in local or regional qualitative studies.25,30,31 The reasons for widespread
deficiencies in quality of care are multifactorial. The ED often serves as the medical safety net of communities, and patients with a myriad of acute and complex medical and social needs seek care in EDs across the country.32,33 High patient volumes, especially in the context of staffing shortages, can contribute to the deterioration in quality of care.34,35 While global improvements in patient care are a complex challenge, targeted improvement in SANE staffing can mitigate the outsized impact of negative ED encounters on survivors of SA.
The association of SANE presence with various survey measures of high-quality care aligns with prior studies documenting that EDs with SANE programs provide comprehensive medical services and proper completion of forensic examinations at higher rates than EDs lacking SANEs.36,37 Numerous studies have also demonstrated that SA survivors whose ED care is supported by SANEs are more likely to report receiving compassion, clear explanations, and choices.38,39 Our study provides an update on the trajectory of nationwide SANE coverage. In a 2009-2010 survey, approximately one-third of hospitals reported never having a SANE present during the care of SA survivors in the ED; less than 3% of advocates surveyed in our study reported never having worked with SANEs during ED management of SA survivors.17 This is likely the result of initiatives such as the 2018 Advanced Nursing Education - Sexual Assault Nurse Examiners Program, which allocated 24.3 million dollars of Bureau of Health Workforce of the Health Resources and Services Administration funding to SANE training at 20 academic institutions.40
Although SA is understudied in rural areas, our data aligns with studies documenting scarce resources, including
Volume 24, NO.3: May 2023 633 Western Journal of Emergency Medicine Chalmers et al. ED Preparedness to Care for Sexual Assault Survivors
Figure 2. Selected hospital preparedness indicators: protocols, staff preparedness, and resources. SANE, Sexual Assault Nurse Examiner.
ED Preparedness to Care for Sexual Assault Survivors Chalmers
healthcare personnel, in specific rural areas.41-43 As reported in a Pennsylvania-based study, SANEs are limited by inconsistent coverage, placing rural SA survivors at risk of receiving lower quality ED care.44 While our study did not find direct correlations between urban vs rural location and qualityof-care measures, SANE presence, which was less common in rural areas, was associated with many positive clinician behaviors, and their absence was associated with several negative behaviors. These negative clinician behaviors, such as conveying disbelief of the survivor’s account of sexual assault, may have serious ramifications for survivors’ legal credibility and access to resources.45-47
Addressing these urban vs rural disparities in SA survivor care requires the implementation of evidence-based strategies to recruit, train, and retain SANEs to serve rural regions. Innovative training programs developed through the Advanced Nursing Education - Sexual Assault Nurse Examiners Program have proved successful in improving SANE coverage in regions of Texas and Florida and can serve as a model for widescale SANE-coverage expansion.48 Blended learning programs that supplement simulated clinical experiences with online education are a promising alternative to traditional classroom learning that can be employed in rural settings.49
While expanding educational opportunities for SANE training is a foundational step, it is merely one component of many necessary steps to reduce disparities and elevate the quality of SA survivor care nationwide. Our study and previous work show that notable proportions of nonSANE ED staff may be uncomfortable with performing the medical forensic exam. This also provides a wider context to qualitative studies documenting low self-efficacy among ED staff when working with SA patients and demonstrates that insufficient training in SA patient care is a problem on a national level.18,50 Although there is currently no published standardized curriculum that provides continuing medical education in the trauma-informed management of SA survivors for physician trainees,51 educational interventions for ED staff show great promise in increasing self-efficacy and ability to avoid retraumatizing patients.52,53 Collaborative trainings that use the experience of SANEs are particularly impactful.54
LIMITATIONS
The inherent limitations of this study should inform interpretation of our data. Advocates who work with centers that dispatch SA advocates to multiple hospitals reported an average of their experiences. Therefore, granularity regarding hospital type was lost. Additionally, most survey respondents were White, cisgender women. While this is likely reflective of the nationwide population of SA patient advocates, it is not reflective of SA survivors themselves and, therefore, could have influenced the survey data obtained. Future studies should further explore disparities in quality of ED care offered to SA survivors that may be influenced by patient identity.
Additionally, survey respondents may have been influenced by recall bias and thus may have reported the more memorable interactions with emergency clinicians.
CONCLUSION
Our study underscores the importance of more consistent standards for hospital preparedness to elevate the nationwide quality of ED care of sexual assault patients. Interventions should aim to decrease ED wait times, reduce the number of times patients must repeat their stories, and improve the consistency with which post-discharge resources are offered to patients. Addressing gaps in staff preparedness through more robust clinician training and increased consistency in coverage by sexual assault nurse examiners should also be prioritized to minimize potentially retraumatizing experiences for SA patients in the ED. This is particularly important to address disparities in the quality of care offered to urban and rural sexual assault survivors.
ACKNOWLEDGMENTS
We would like to thank the partnering sexual assault crisis centers and participants for their generosity in sharing their experiences. We would also like to thank Tanvee Sinha for her assistance with outreach to sexual assault crisis centers.
Address for Correspondence: Kristen Chalmers, BA, University of Chicago Pritzker School of Medicine, 924 E 57th St, Chicago, Il, 60637. Email: kchalmers@uchicagomedicine.org
Conflicts of Interest: By the WestJEM article submission agreement, all authors are required to disclose all affiliations, funding sources and financial or management relationships that could be perceived as potential sources of bias. The study was funded by the generosity of the Bucksbaum Center for Clinical Excellence. There are no conflicts of interest to declare.
Copyright: © 2023 Chalmers et al. This is an open access article distributed in accordance with the terms of the Creative Commons Attribution (CC BY 4.0) License. See: http://creativecommons.org/ licenses/by/4.0/
REFERENCES
1. Smith SG, Zhang X, Basile KC, et al. (2018) The National Intimate Partner and Sexual Violence Survey: 2015 Data Brief–Updated Release. Atlanta, GA: National Center for Injury Prevention and Control, US Centers for Disease Control and Prevention.
2. Basile KC, Smith SG, Chen J, Zwald M. Chronic diseases, health conditions, and other impacts associated with rape victimization of US women. J Interpers. Violence. 2021;36(23-24):NP12504-NP12520.
3. Zinzow HM, Resnick HS, Barr SC, et al. Receipt of post-rape medical care in a national sample of female victims. Am J Prev Med 2012;43(2):183-187.
4. Vrees RA. Evaluation and management of female victims of sexual
Western Journal of Emergency Medicine 634 Volume 24, NO.3: May 2023
al.
et
assault. Obstetl Gynecol Surv. 2017;72(1):39-53.
5. Bates C. Evaluation and management of adult and adolescent sexual assault victims 2021. https://www.uptodate.com/contents/-Evaluationandmanagement-of-adult-and-adolescent-sexual-assault-victims
6. Ingemann-Hansen O, Charles AV. Forensic medical examination of adolescent and adult victims of sexual violence: Best practice & research. Clin Obstet Gynecol. 2013;27(1):91-102.
7. Muldoon KA, Drumm A, Leach T, Heimerl M, Sampsel K. Achieving just outcomes: forensic evidence collection in emergency department sexual assault cases. Emerg Med J. 2018;35(12):746-752.
8. Campbell R. The community response to rape: Victims’ experiences with the legal, medical, and mental health systems. Am J Community Psychol. 1998;26(3):355-379.
9. Campbell R, Raja S. The sexual assault and secondary victimization of female veterans: help-seeking experiences with military and civilian social systems. Psychol Women Q. 2005;29(1):97-106
10. McQueen K, Murphy-Oikonen J, Miller A, Chambers L. Sexual assault: women’s voices on the health impacts of not being believed by police. BMC Women’s Health. 2021;21(1):1-10.
11. Greeson MR, Campbell R. Sexual Assault Response Teams (SARTs). An empirical review of their effectiveness and challenges to successful implementation. Trauma Violence Abuse. 2013;14(2):83-95.
12. Zajac J. National sexual assault response team survey report. Health Care. 2011;31:12.
13. Cole J, Logan T. Negotiating the challenges of multidisciplinary responses to sexual assault victims: Sexual assault nurse examiner and victim advocacy programs. Res Nurs Health. 2008;31(1):76-85.
14. Ledray LE, Faugno D, Speck P. SANE: Advocate, forensic technician, nurse? J Emerg Nurs. 2001;27(1):91-93.
15. SANE-A CCR. The Forensic Sexual Assault Medical Legal Examination: The SANE Exam. Handbook of Sexual Assault and Sexual Assault Prevention. Springer; 2019:609-632
16. Delgadillo DC. When there is no sexual assault nurse examiner: emergency nursing care for female adult sexual assault patients. J Emerg Nurs. 2017;43(4):308-315.
17. Patel A, Roston A, Tilmon S, et al. Assessing the extent of provision of comprehensive medical care management for female sexual assault patients in US hospital emergency departments. Int J Gynaecol Obstet. 2013;123(1):24-28.
18. Amin P, Buranosky R, Chang JC. Physicians’ perceived roles, as well as barriers, toward caring for women sex assault survivors. Womens Health Issues. 2017;27(1):43-49.
19. Vogt EL, Jiang C, Jenkins Q, et al. Trends in US emergency department use after sexual assault, 2006-2019. JAMA Netw Open. 2022;5(10):e2236273-e2236273. doi:10.1001/ jamanetworkopen.2022.3627
20. Azzopardi C, Smith TD. Paediatric health care in the# MeToo era: advocating for survivors of sexual violence. Paediatr Child Health. 2019;24(4):213-215.
21. Coverdale J, Roberts LW, Balon R, et al. #MeToo and Female Patients with Major Mental Disorders: What Should Academic Psychiatry Do? Springer; 2020. p. 11-15.
22. Hegarty K, Tarzia L. Identification and management of domestic and sexual violence in primary care in the# MeToo era: an update. Curr Psychiatry Rep.2019;21(2):12.
23. Eysenbach G. Improving the quality of web surveys: the Checklist for Reporting Results of Internet E-Surveys (CHERRIES). J Med Internet Res. 2004;6(3):e132.
24. Chalmers K , Parameswaran R, Dussault N, et al. Patient advocates’ perspectives on the care of sexual assault survivors in Chicagoarea emergency departments. presented at: University of Chicago NorthShore Department of Family Medicine 11th Annual Scholarship Day; 2021; Virtual.
25. Maier SL. “I have heard horrible stories...” Rape victim advocates’ perceptions of the revictimization of rape victims by the police and medical system. Violence Against Women. 2008;14(7):786-808.
26. Willis GB. Cognitive Interviewing: A Tool for Improving Questionnaire Design. Sage Publications; 2004.
27. Willis GB, Artino Jr AR. What do our respondents think we’re asking? Using cognitive interviewing to improve medical education surveys. J Grad Med Educ. 2013;5(3):353-356.
28. Agriculture UDo. Rural definition based on Office of Management and Budget (OMB). Metro Counties. 2021. https://www.ers.usda. gov/topics/rural-economy-population/rural-classifications/. Accessed September 16, 2021.
29. Benjamini Y, Hochberg Y. Controlling the false discovery rate: a practical and powerful approach to multiple testing. J R Statist Soc B. (Methodological). 1995;57(1):289-300.
30. Maier SL. Sexual assault nurse examiners’ perceptions of the revictimization of rape victims. J Interpers Violence. 2012;27(2):287315.
31. Campbell R. The Psychological Impact of Rape Victims’ Experiences with the Legal, Medical, and Mental Health Systems. 2013:149-178.
32. Pines JM, Lotrecchiano GR, Zocchi MS, et al. A conceptual model for episodes of acute, unscheduled care. Ann Emerg Med 2016;68(4):484-491. e3.
33. Greenwood-Ericksen MB, Kocher K. Trends in emergency department use by rural and urban populations in the United States. JAMA Netw Open. 2019;2(4):e191919-e191919.
34. McKenna P, Heslin SM, Viccellio P, Mallon WK, Hernandez C, Morley EJ. Emergency department and hospital crowding: causes, consequences, and cures. Clin Exp Emerg Med. 2019;6(3):189.
35. Kelen GD, Wolfe R, D’Onofrio G, et al. Emergency department crowding: the canary in the health care system. NEJM Catalyst Innovations in Care Delivery. 2021;2(5)
36. Schmitt T, Cross TP, Alderden M. Qualitative analysis of prosecutors’ perspectives on sexual assault nurse examiners and the criminal justice response to sexual assault. J Forensic Nurs. 2017;13(2):62-68.
37. Patterson D, Campbell R, Townsend SM. Sexual Assault Nurse Examiner (SANE) program goals and patient care practices. J Nurs Scholarsh 2006;38(2):180-186.
38. Fehler-Cabral G, Campbell R, Patterson D. Adult sexual assault survivors’ experiences with sexual assault nurse examiners (SANEs). J Interpers Violence. 2011;26(18):3618-3639.
Volume 24, NO.3: May 2023 635 Western Journal of Emergency Medicine
Chalmers et al. ED Preparedness to Care for Sexual Assault Survivors
ED Preparedness to Care for Sexual Assault Survivors
39. Campbell R, Patterson D, Adams AE, Diegel R, Coats S. A participatory evaluation project to measure SANE nursing practice and adult sexual assault patients’ psychological well-being. J. Forensic Nurs. 2008;4(1):19-28
40. Colbert AM, Sekula LK. A major investment in the United States sexual assault nurse examiner workforce. J. Forensic Nurs. 2022;18(1):1-3.
41. Averill JB, Padilla AO, Clements PT. Frightened in isolation: unique considerations for research of sexual assault and interpersonal violence in rural areas. J. Forensic Nurs. 2007;3(1):42-46.
42. Carter-Snell C, Jakubec S, Hagen B. Collaboration with rural and remote communities to improve sexual assault services. J. Community Health. 2020;45(2):377-387.
43. Choo EK, Newgard CD, Lowe RA, Hall MK, McConnell KJ. Ruralurban disparities in emergency department intimate partner violence resources. West J. Emerg. Med. 2011;12(2):178.
44. Thiede E, Miyamoto S. Rural availability of sexual assault nurse examiners (SANEs). J. of Rural Health. 2021;37(1):81-91.
45. Murugan V, Holzer KJ, Vaughn MG, Carbone JT, Jackson DB, Bitter CC. Coding of sexual assault by emergency physicians: a nationally representative study. West J. Emerg. Med. 2021;22(2):291.
46. Torregosa MB, Chaudhuri N, del Rosario Benavides M, et al. Building a capacity of sexual assault nurse examiners in an underserved US–Mexico border region. J. Forensic Nurs. 2022;18(1):30-38.
47. Thomas T, Nobrega JC, Britton-Susino S. challenges and collaborations: a case study for successful Sexual Assault Nurse
Examiner education in rural communities during the COVID-19 pandemic. J. Forensic Nurs. 2022;18(1):59-63.
48. Mitchell SA, Charles LA, Downing N. Increasing access to forensic nursing services in rural and underserved areas of Texas. J. Forensic Nurs. 2022;18(1):21-29.
49. Sheeran B, Kiser L, Williams-Gilbert W, et al. Sexual assault nurse examiner training: a review of literature and implication for nursing education and service to rural communities. J. Forensic Nurs 2022;18(2):78-84.
50. Marshall AJ, Schultz T, de Crespigny CF. Emergency clinicians’ perceived self-efficacy in the care of intoxicated women victims of violence. Int. Emerg. Nurs. 2018;40:18-22.
51. Sande MK, Broderick KB, Moreira M, et al. Sexual assault training in emergency medicine residencies: a survey of program directors. West J. Emerg. Med. 2013;14(5)
52. Auten JD, Ross EM, French MA, et al. Low-fidelity hybrid sexual assault simulation training’s effect on the comfort and competency of resident physicians. J. Emerg. Med. 2015;48(3):344-350.
53. McLaughlin SA, Monahan C, Doezema D, Crandall C. Implementation and evaluation of a training program for the management of sexual assault in the emergency department. Ann. Emerg. Med. 2007;49(4):489-494.
54. Chandramani A, Dussault N, Parameswaran R, et al. A needs assessment and educational intervention addressing the care of sexual assault patients in the emergency department. J. Forensic Nurs. 2020;16(2):73-82.
Western Journal of Emergency Medicine 636 Volume 24, NO.3: May 2023
et al.
Chalmers
Evaluation of an Emergency Department-based Palliative Care Extender Program on Hospital and Patient Outcomes
Kalpana Narayan Shankar, MD, MSc, MSHP*
Julianne Dugas, MS†
Sorraya Jaiprasert, MS‡
Lauren Nentwich, MD‡
Lisa Caruso, MD§
Alexandra Dobie, LICSW, MSW||
Deborah Whalen, MSN, MBA||
Perla Macip-Rodriguez, MD||
Sandhya Rao, MD||
Suzanne E. Mitchell, MD#
Section Editor: David Lee, MD
Brigham and Women’s Hospital, Department of Emergency Medicine, Boston, Massachusetts
Boston University School of Medicine, Boston, Massachusetts
Boston Medical Center, Department of Emergency Medicine, Boston, Massachusetts Boston Medical Center, Department of Geriatrics, Boston, Massachusetts
Boston Medical Center, Department of Internal Medicine, Boston, Massachusetts
Boston Medical Center, Department of Family Medicine, Boston, Massachusetts
Submission history: Submitted June 21, 2023; Revision received March 15, 2023; Accepted February 15, 2023
Electronically published May 5, 2023
Full text available through open access at http://escholarship.org/uc/uciem_westjem
DOI: 10.5811/westjem.56015
Background: Boston Medical Center (BMC), a safety-net hospital, treated a substantial portion of the Boston cohort that was sick with COVID-19. Unfortunately, these patients experienced high rates of morbidity and mortality given the significant health disparities that many of BMC’s patients face. Boston Medical Center launched a palliative care extender program to help address the needs of critically ill ED patients under crisis conditions. In this program evaluation our goal was to assess outcomes between those who received palliative care in the emergency department (ED) vs those who received palliative care as an inpatient or were admitted to an intensive care unit (ICU).
Methods: We used a matched retrospective cohort study design to assess the difference in outcomes between the two groups.
Results: A total of 82 patients received palliative care services in the ED, and 317 patients received palliative care services as an inpatient. After controlling for demographics, patients who received palliative care services in the ED were less likely to have a change in level of care (P<0.001) or be admitted to an ICU (P<0.001). Cases had an average length of stay of 5.2 days compared to controls who stayed 9.9 days (P<0.001).
Conclusion: Within a busy ED environment, initiating palliative care discussions by ED staff can be challenging. This study demonstrates that consulting palliative care specialists early in the course of the patient’s ED stay can benefit patients and families and improve resource utilization.
[West J Emerg Med. 2023;24(3)637–643.]
INTRODUCTION
Massachusetts had the third highest prevalence of coronavirus disease 2019 (COVID-19) after New York and New Jersey with a total of 72,025 cases and 4,420 deaths, as of May 6, 2020.1 Boston and the surrounding municipalities were
disproportionately affected with 21.2% of the state’s COVID-19 cases diagnosed.1 As New England’s largest safety-net hospital, serving primarily low-income individuals and those who are defined as racial and ethnic minorities, Boston Medical Center (BMC) saw a surge of COVID-19 patients. This population
Volume 24, NO.3: May 2023 637 Western Journal of Emergency Medicine * † ‡ § || # Original Research
has historically experienced significant disparities in health and outcomes, including elevated rates of morbidity and mortality from chronic disease, which added to the increased risk of poor outcomes from COVID-19.2
In response to the rapidly rising number of patients whose health was seriously impacted by COVID-19, in April 2020 BMC established a palliative care working group to address the high mortality from the disease. From a series of informal interviews with emergency department (ED) staff, the working group identified the ED’s concern about adequately addressing the needs of critically ill patients and their family members under crisis conditions, as well as the unmet needs of patients and families for counseling, education, and advance care planning. Furthermore, with the discussion of crisis standards of care looming across the United States, the BMC ED staff was not equipped to initiate and handle such conversations in a patientcentered manner while caring for the multitude of sick patients in an already crowded ED. Therefore, BMC established a working group to create an all-volunteer Palliative Care Extender Team (PCXT), to initiate palliative care consults and advance-care planning discussions in the ED for any patient who was identified as benefitting from this additional support.
For this program evaluation we used a matched, retrospective cohort study design to assess the difference in outcomes between those who received palliative care in the ED vs those who received palliative care as an inpatient or were admitted to the intensive care unit (ICU) without a palliative care consult. Our primary outcome was length of stay (LOS). Our secondary outcomes followed intensity of services (using LOS in the ICU vs floor vs discharge disposition) and change in level of care. We hypothesized that patients who had palliative care services initiated in the ED would have a shorter overall LOS and a decrease in intensity of services compared to their matched controls.
METHODS
Palliative Care Extender Team Program
The PCXT was an all-volunteer group of 48 health professionals consisting of a dyad team of a physician or midlevel practitioner (advanced practice nurse or physician assistant) and a licensed clinical social worker (LICSW) or licensed clinical mental health counselor (LMHC) implemented in response to the COVID-19 pandemic surge from April 10–June 30, 2020. The dyad teams staffed two ED shifts daily from 8 am–10 pm, providing serious illness conversations and palliative care support for patients presenting to the ED with COVID-19 symptoms. Attending emergency physicians could initiate the palliative care consult based on clinical discretion for patients who they felt were moderately to severely ill from COVID-19 or if they felt the patient needed more urgent advanced care planning. No strict inclusion or exclusion criteria was implemented as this began as a program and not a research study. The dyad teams implemented palliative care assessments and serious illness
Population Health Research Capsule
What do we already know about this issue? Palliative care improves outcomes when initiated early. It improves patient and family satisfaction with symptoms management and improves quality of life.
What was the research question?
We sought to assess the impact on patient outcomes of initiating palliative care services in the ED.
What was the major finding of the study?
Patients in the intervention had shorter length of stay (5.2 vs 9.9 days), were less likely to have a change in level of care (36% vs 68%) or be admitted to an ICU (20% vs 63%, all P<0.0001).
How does this improve population health?
Consulting palliative care specialists during an ED stay can improve resource utilization with shorter hospital stays, fewer changes in level of care, and fewer ICU stays.
conversations with patients and families and completed a documentation and billing template through the electronic health record (EHR) (Epic Systems Corporation, Verona, WI). We used the Strengthening the Reporting of Observational Studies in Epidemiology (STROBE) statement guidelines to ensure the reporting of this observational study.3
Palliative Car Extender Team Professionals and Training
The clinician volunteers came from internal medicine, family medicine, and pediatrics, and the psychosocial support members came from social work, behavioral health, child health, patient advocacy, and chaplaincy departments, all of whom normally practice in the ambulatory care setting. The volunteers received a one-hour virtual orientation and training around palliative care and addressing primary palliative care needs. These included communication skills training and pocket-guide resources based on evidence-based models of serious illness communication,4,5 as well as a walk-through of the PCXT logistics and education concerning palliativecare symptom assessment and safety protocols in the ED. Concurrently, the working group created training materials and conducted rapid cycle testing of an ED-embedded workflow to guide them. The volunteer dyads were also oriented to key documentation elements to be included in the patients’ charts regarding any discussions about advance
Western Journal of Emergency Medicine 638 Volume 24, NO.3: May 2023 Evaluation of an ED Based Palliative Care Extender Program Shankar et al.
directives and goals of care. A documentation and billing template through the EHR was developed and used to document and track encounters. The teams staffed two ED shifts daily from 8 am–4 pm and 2 pm–10 pm
Intervention Workflow
The PCXT implementation team informed ED clinicians of the new PCXT services through departmental meetings and emails. The teams also provided in-service education on how to request a PCXT consult. The PCXT was available for consults of any COVID-19-positive patient seeking emergency care. Consult requests and their associated orders in the EHR were placed by emergency physicians. The PCXT conducted in-person and telephonic discussions with patients, emergency clinicians, healthcare proxies, and family members about goals of medical care in the setting of a pending or confirmed COVID-19 diagnosis. The PCXT also provided guidance on symptom management to maximize patient comfort and directly supported patients and family members through phone updates. Each consult took approximately one hour to complete. Consult teams would continue to follow these patients as inpatients.
Evaluation Design
We used a matched, retrospective cohort study design to compare outcomes between those who received palliative care in the ED via the PCXTs to those who did not receive the PCXT intervention in the ED. Our primary outcome was hospital LOS (outcome); our secondary outcomes included change in level of care and intensity of services (ICU vs floor vs discharge disposition). We matched patients on age and gender. This program evaluation was approved by the BMC Institutional Review Board, protocol H-40627.
Data Collection
We collected patient logs for the cases from the PCXT database where services were delivered in the ED. This data was already collected through an ongoing quality improvement initiative to monitor those who obtained such services. This data was then verified through BMC’s Clinical Data Warehouse (CDW). Due to the overall volume of patients in the hospital during the initial pandemic, we were unable to match an adequate sampling of control cases; thus, the controls we used were COVID-19 patients admitted to the ICU without an ED palliative care consult or those who received their palliative care consult only as an inpatient. The CDW provided all relevant patient characteristics and outcomes for both cases and controls.
Outcomes
We defined cases as COVID-19 patients who received palliative care services in the ED due to the palliative care extender program. Controls were those COVID-19 patients who either received palliative care as an inpatient or were admitted to
the ICU and received a palliative care consult only after arrival to the ICU from March 1–June 30, 2020. All included patients were at least 22 years old as this is the general cutoff age for patients seen in the adult ED. Due to staffing constraints, the palliative care extender program was not available in the pediatric ED and, thus, we excluded pediatric patients from the controls.
We obtained patient demographics including age, race, ethnicity, gender, and primary insurance through the CDW for the controls and through a combination of the CDW and ED registration for the cases. Information obtained through ED registration happened via phone conversation into patient rooms to minimize exposure of registration staff to COVID-19 patients. We also assessed hospital visit-specific data, including overall LOS, ICU LOS, and discharge disposition (to be used as a proxy for intensity of services). Code status, defined as either full code, do not resuscitate (DNR), do not intubate (DNI) or comfort measures only (CMO), was obtained via review of EHR notes. A patient’s status was ultimately based on their most recent code status.
Primary insurance was defined as either commercial, Medicaid, Medicare, managed care, or other. Discharge disposition was defined as deceased, discharged home (including with home healthcare services), discharged to hospice/other facility, or other.
Analysis
We calculated basic descriptive statistics to summarize the outcome measures, as well as demographic information for all participants and separately by intervention group. Continuous characteristics were summarized by using means and SD or using medians and interquartile ranges (IQR) if non-normally distributed. We summarized dichotomous and categorical variables using frequencies and percentages. Patient-level statistics were calculated per patient, and visit-level statistics were calculated per visit. We used chi-squared and Wilcoxon rankedsum tests to compare primary and secondary outcomes between cases and controls.
We then used simple and multivariable linear mixed models with random effects to compare overall LOS, ICU LOS, changes in level of care and discharge disposition between cases and controls while accounting for multiple visits per some patients. Models were produced first without covariates and then separately with the addition of patient age, race/ethnicity, and gender.
RESULTS
A total of 82 patients who received palliative care services in the ED were compared to the 317 patients who received palliative care services as an inpatient. No patients in either group were discharged home with home hospice services as there were no hospice services for COVID-19 patients this early in the pandemic. Patients who received palliative care services in the ED were predominantly male (43, 52.4%) and nonHispanic Black (47, 57.3%), with an average age of 76.3 years
Volume 24, NO.3: May 2023 639 Western Journal of Emergency Medicine
Program
Shankar et al. Evaluation of an ED Based Palliative Care Extender
Evaluation of an ED Based Palliative Care Extender Program Shankar
(SD 13.7). The majority (51/82, 62.2%) had only one admission during the study period. These demographics were consistent with the national trend during this period, whereby the US Centers for Disease Control and Prevention noted COVID-19 to disproportionately affect males and non-Hispanic Blacks.6
Managed care and Medicare were the most frequent primary insurance types (46.3% and 41%, respectively) among this group, and they predominantly carried a full code (24) or DNI/DNR (27) status. Patients who received palliative care services as an
inpatient were also predominantly male (204, 64.4%), had an average age of 59.3 years (SD 17.3), were non-Hispanic Black (137, 43.2%), and had one admission in the study period (252, 79.5%). The majority also carried a full code status (204, 64.8%) or DNR (50, 15.9%) or both a DNI/DNR status (38, 12.1%). The control group was significantly younger (P<0.001) and had more admissions (P<0.001). In addition, patient type was significantly associated with primary insurance type (P<0.001) and code status (P<0.001) (Table 1). Patients
Western Journal of Emergency Medicine 640 Volume 24, NO.3: May 2023
al.
et
Inpatient (n=317) P-value Gender, n (%) 0.05 (chi-square) Female 39 (47.6) 113 (35.6) Male 43 (52.4) 204 (64.4) Age (years), mean (SD) 76.3 (13.7) 59.3 (17.3) <0.001 (t-test) Race/ethnicity, n (%) 0.02 (chi-square) Black, non-Hispanic 47 (57.3) 137 (43.2) White, non-Hispanic 17 (20.7) 51 (16.1) Hispanic 14 (17.1) 102 (32.2) Other 3 (3.7) 8 (2.5) Missing 1 (1.2) 19 (6.0) Admissions per patient, n (%) <0.001 (Fisher exact) 1 51 (62.2) 252 (79.5) 2 14 (17.1) 41 (12.9) 3 11 (13.4) 9 (2.8) 4 2 (2.4) 11 (3.5) 5 2 (2.4) 0 (0.0) 6 1 (1.2) 1 (0.3) 7 0 (0.0) 0 (0.0) 8 0 (0.0) 1 (0.3) 9 1 (1.2) 1 (0.3) 10 0 (0.0) 1 (0.3) Primary insurance, n (%) <0.001 (chi-square) Commercial 0 (0.0) 21 (6.6) Managed care 38 (46.3) 143 (45.1) Medicaid 8 (9.8) 62 (19.6) Medicare 34 (41.5) 64 (20.2) Other 2 (2.4) 26 (8.2) Missing 0 (0.0) 1 (0.3) Code status <0.001 (chi-square) Full code, n (%) 29 (36.7) 209 (66.4) DNI, n (%) 3 (3.8) 3 (1.0) DNR, n (%) 4 (5.1) 53 (16.8) Both DNI/DNR, n (%) 28 (35.4) 39 (12.4) CMO, n (%) 15 (19.0) 11 (3.5)
who received palliative services in the ED (n=82) Patients who had palliative services initiated as an
ED, emergency department; nH, non-Hispanic; DNI
not intubate; DNR, do not resuscitate; CMO, comfort measures only.
Table 1. Baseline characteristics of patients receiving palliative services during COVID-19.
, do
Patients who received palliative care services in the ED were less likely to have a change in level of care (P<0.001) or be admitted to an intensive care unit (P<0.001) compared to controls. When adjusting for age, race/ethnicity, insurance and gender, cases had an average LOS of 5.2 days compared to controls who stayed 9.9 days (P<0.001), amounting to a difference of 4.7 days. With regard to intensity of services as measured by ICU visits, after controlling for age, race/ ethnicity, insurance and gender, cases averaged fewer total number of ICU admissions (29) as compared to controls (274) (P<0.001). However, there was no difference in ICU LOS with a median number of five days in both groups (P=0.83). Discharge disposition did not differ significantly between cases and controls (P = 0.52). Code status was not included in the multivariable models because we could not be sure whether the code status extracted was the status at the time of their initial ED presentation or if this was a change when they were admitted. (See Table 2).
DISCUSSION
This study demonstrated that patients for whom palliative care services were initiated in the ED were less likely to have a change in level of disposition while admitted when compared to controls, had significantly shorter LOS and fewer admissions to an ICU. This is in line with prior studies demonstrating improved outcomes with early initiation of palliative care, specifically improved satisfaction for patients and families and symptom management.7-10 Specifically, Grudzen et al and Meier et al noted improvements in quality of life for those who received early palliative care services.7,8 Additionally, Wu et al noted shortened hospital stays of less by 3.6 days with early initiation of such services,9 and Temel et al found improved quality of life.10
In this study we also noted that both groups had similar rates of commercial insurance; however, the cases
Evaluation of an ED Based Palliative Care Extender Program
were comprised primarily of Medicare patients, whereas the controls carried similar frequencies of Medicare and Medicaid. There was also a higher rate of patients with DNR/ DNI or CMO status among the PCXT patients as compared to the controls. Based on this, we can surmise that older patients who were likely sicker were engaging with the PCXT in the ED, as compared to the controls. While this is not surprising given the known increased severity of sickness in the older population,11 this does underscore the importance of initiating palliative care discussions among sick patients in the ED with trained clinicians.
During the height of the COVID-19 pandemic, BMC received most of the symptomatic cases in the city of Boston. Given the significant stress the ED faced, a palliative care extender program was initiated to remove some of the burden of initiating discussions on goals of care and symptom management for patients who would be admitted to the hospital. To our knowledge, the BMC Palliative Care Extender Program is one of only a few novel responses implemented by a safety-net healthcare system to meet the immediate demands for palliative care in the ED during the early days and weeks of the COVID-19 pandemic.
A 2014 meta-analysis estimated that palliative care consultation reduced hospital inpatient costs by 10-30%.12 Clearly, palliative care services provide an invaluable benefit to hospitals, patients, and families that would otherwise be difficult to achieve with ED staff alone, given the time and resource constraints of initiating and engaging in these vital, highstakes discussions. Furthermore, physicians who can palliative care should be able to connect with patients in an unbiased manner to enter into shared decision-making processes on goals of care and appointment of a healthcare proxy. Too often, ED staffing constraints limit the reach of palliative care services to inpatient or ambulatory settings.
This program was unique in that there was a physician or a mid-level clinician with a licensed mental health clinician
Volume 24, NO.3: May 2023 641 Western Journal of Emergency Medicine
Shankar et al.
Patients who received palliative services in the ED (n=82) Patients who had palliative services initiated as an inpatient (n=317) Test P-value LOS (days), median (IQR) 5.2 (7.2) 9.9 (13.5) Wilcoxon ranked-sum test <0.001 Visits with ICU stays, n (%) 29 (20.1) 274 (63.4) chi-squared <0.001 ICU LOS (days), median (IQR) 5.0 (8.0) 5.0 (11.0) Wilcoxon ranked-sum test 0.83 Change in level of care (either upgraded or downgraded while inpatient), n (%) 52 (36.1) 294 (68.1) chi-squared <0.001 Discharge disposition, n (%) chi-squared 0.52 Home 62 (43.1) 199 (46.1) Other medical facility 16 (11.1) 80 (18.5) Deceased 23 (16.0) 83 (19.2) Other 3 (2.1) 8 (1.9)
ED, emergency dexpartment; LOS, length of stay; IQR, interquartile range; ICU, intensive care unit.
Table 2. Adjusted outcomes.
Evaluation of an ED Based Palliative Care Extender Program Shankar
who received palliative care training and resources to initiate advance care planning in a setting where this discussion is frequently initiated by those with limited palliative care training. This dyad was able to provide support and guidance to emergency clinicians on symptom management in a way that allowed the ED staff to efficiently run the department without taking away from the sensitivity of advance care planning. Lastly, because these dyads work throughout a hospital system, they can provide continuous support throughout an entire hospitalization to patients and family members through phone calls and meetings regarding a patient’s change in status something emergency clinicians are unable to do.
To date, few palliative care service programs operate in the ED setting. Those EDs that have implemented such services noted an increase in educational awareness and confidence of palliative care delivery, but time constraints and implementation logistics were their biggest limitation.13,14 Despite the ongoing education of emergency physicians and movements through national emergency medicine societies to increase palliative care education, emergency physicians still often find it difficult to engage in these discussions, accurately predict a disease process, or foreshadow outcomes of an invasive procedure.15 With the many competing interests (dealing with a variety of acutely ill patients, unpredictable ED volumes, lack of dedicated time and training), emergency clinicians face many challenges regarding initiating and completing advance care planning discussions in a meaningful way that does not feel rushed by the patient. The extender model developed in this program was able to address these barriers and provide patient-centered care in a clinically appropriate manner.
LIMITATIONS
As we were limited by the true number of patients who received this service, this was a small sample size; larger numbers would have provided more power. Second, we were unable to match an adequate sampling of controls to cases due to overall low hospital volumes during this time; thus, over half of our cases had no control. Because of this, we were unable to match on other important factors such as level of admission, comorbidities, or illness severity, which are reflected in the differences in some of the baseline characteristics between groups. However, based on the sample size available to us, we controlled for as many variables as possible in the multivariate analysis. Third, we did not control for comorbidity, which limited our ability to assess whether underlying sickness contributed to differences in their outcomes.
While there was no difference in death and discharge disposition to suggest that patient severity could be similar for both groups, the age difference between the groups could also indicate the opposite. As previously mentioned, hospital volumes limited our ability to obtain an adequate, comparative sample. Fourth, there may have been variation in volunteer
comfort in providing elements of palliative care, especially for those who do not exclusively practice palliative care or typically deal with serious illness conversations, which could have led to a difference in outcomes. However, if this was an overriding theme, the outcomes would likely have been biased toward the null. Lastly, this data was taken from an urban, academic hospital using volunteers; thus, results and true costs of such an intervention may not be generalizable for community settings where palliative care services are not always available.
CONCLUSION
The ED may not seem the ideal place to initiate sensitive discussions regarding patients’ and families’ goals and values regarding their healthcare. However, it may also be the most meaningful place to do so, especially given the isolation and prognostic uncertainty that patients and families faced surrounding COVID-19. This study demonstrates that consulting palliative care specialists early in the patient’s course of their ED stay can improve resource utilization with shorter hospitalization stays, fewer changes in level of care, and fewer ICU stays. It also offloaded this delicate conversation from members of the ED care team who are often multitasking other patients and procedures to an independent team who had time to focus on a conversation about serious illness. Future studies should follow usage and further assess the barriers to replicating such models or consulting palliative care services in the ED.
Address for Correspondence: Kalpana Narayan Shankar, MD, MSc, MSHP, Brigham and Women’s Hospital, Department of Emergency Medicine, 75 Francis Street, Neville House 2nd Floor, Boston, MA 02115, USA. Email: knshankar@partners.org.
Conflicts of Interest: By the WestJEM article submission agreement, all authors are required to disclose all affiliations, funding sources and financial or management relationships that could be perceived as potential sources of bias. No author has professional or financial relationships with any companies that are relevant to this study. There are no conflicts of interest or sources of funding to declare.
Copyright: © 2023 Shankar et al. This is an open access article distributed in accordance with the terms of the Creative Commons Attribution (CC BY 4.0) License. See: http://creativecommons.org/ licenses/by/4.0/
REFERENCES
1. COVID-19 Interactive Data Dashboard. Mass.gov. Available at: https://www.mass.gov/info-details/covid-19-response-reporting#covid19-interactive-data-dashboard-. Accessed August 20, 2020.
2. Centers for Disease Control and Prevention. Disparities in Death
Western Journal of Emergency Medicine 642 Volume 24, NO.3: May 2023
et al.
from COVID1-19. Available at: https://www.cdc.gov/coronavirus/2019ncov/community/health-equity/racial-ethnic-disparities/disparitiesdeaths.html. Accessed September 20, 2021.
3. von Elm E, Altman DG, Egger M, et al. The Strengthening the Reporting of Observational Studies in Epidemiology (STROBE) statement: guidelines for reporting observational studies. PLoS Med 2007;4(10):e296.
4. Vital Talk. Vital Talk: COVID Resources. Available at: https://www. vitaltalk.org. Accessed September 20, 2021.
5. Ariadne Labs. Serious Illness Care. Available at: https://www.ariadnelabs.org/serious-illness-care/. Accessed September 20, 2021.
6. Centers for Disease Control and Prevention (CDC). COVID-19 Weekly Cases and Deaths per 100,000 Population by Age, Race/ Ethnicity, and Sex. COVID Data Tracker. Available at: https://covid. cdc.gov/covid-data-tracker/#demographicsovertime. Accessed September 22, 2021.
7. Grudzen CR, Richardson LD, Johnson PN, et al. Emergency department-initiated palliative care in advanced cancer: a randomized clinical trial. JAMA Oncol. 2016;2(5):591-8.
8. Meier DE, Beresford L. Fast response is key to partnering with the emergency department. J Palliat Med. 2007;10(3):641-5.
9. Wu FM, Newman JM, Lasher A, et al. Effects of initiating palliative
Evaluation of an ED Based Palliative Care Extender Program
care consultation in the emergency department on inpatient length of stay. J Palliat Med. 2013;16(11):1362-7.
10. Temel JS, Greer JA, El-Jawahri A, et al. Effects of early integrated palliative care in patients with lung and GI cancer: a randomized clinical trial. J Clin Oncol. 2017;35(8):834-41.
11. Centers for Disease Control and Prevention. Division of Population Health, National Center for Chronic Disease Prevention and Health Promotion. COVID-19 Risks and Vaccine Information for Older Adults. Available at: https://www.cdc.gov/aging/covid19/covid19older-adults.html. Accessed September 25, 2021.
12. May P, Normand C, Morrison RS. Economic impact of hospital inpatient palliative care consultation: review of current evidence and directions for future research. J Palliat Med. 2014;17(9):1054-63.
13. Hughes MT, Smith TJ. The growth of palliative care in the United States. Annu Rev Public Health. 2014;35:459-75.
14. Quest TE, Lamba S. UpToDate. Palliative care for adults in the emergency department (ED). Available at: https://www.uptodate.com/ contents/palliative-care-for-adults-in-the-emergency-department-ed. Accessed September 20, 2021.
15. Goldonowicz JM, Runyon MS, Bullard MJ. Palliative care in the emergency department: an educational investigation and intervention. BMC Palliat Care. 2018;17(1):43.
Volume 24, NO.3: May 2023 643 Western Journal of Emergency Medicine
Shankar et al.
Efficacy of Low-dose Ketamine for Control of Acute Pain in the Emergency Setting: A Systematic Review and Meta-analysis of Randomized Controlled Trials
Mengyao Ying, MD
Yuetun Zuo, MD
Section Editor: David Thompson, MD
Changxing People’s Hospital of China, Department of Emergency Medicine, Zhejiang Province, People’s Republic of China
Submission history: Submitted August 10, 2022; Revision received January 24, 2023; Accepted February 4, 2023
Electronically published May 9, 2023.
Full text available through open access at http://escholarship.org/uc/uciem_westjem
DOI: 10.5811/westjem.2023.2.58368
Introduction: Ketamine can be particularly helpful in situations where the clinician is not able to administer opioids and require an alternate analgesic, such as for patients who are already on high-dose opioids, have a history of addiction, or for opioid-naïve children and adults. In this review, our goal was to obtain a comprehensive estimate of the efficacy and safety of low-dose ketamine (dose less than 0.5 milligrams per kilogram or equivalent) compared to opiates for the control of acute pain in the emergency setting.
Methods: We conducted systematic searches in PubMed Central, EMBASE, MEDLINE, the Cochrane Library, ScienceDirect, and Google Scholar from inception until November 2021. We used the Cochrane risk-of-bias tool to assess the quality of included studies.
Results: We carried out a meta-analysis with a random-effects model and reported pooled standardized mean difference (SMD) and risk ratio (RR) with 95% confidence intervals depending on the type of the outcome. We analyzed a total of 15 studies with 1,613 participants. Half of them had high risk of bias and were conducted in the United States of America. The pooled SMD for pain score was -0.12 (95% CI -0.50-0.25; I2=68.8%) within 15 minutes, -0.45 (95% CI -0.84- -0.07; I2=83.3%) within 30 minutes, -0.05 (95% CI -0.41-0.31; I2=86.9%) within 45 minutes, -0.07 (95% CI -0.41-0.26; I2=82%) within 60 minutes, and after 60 minutes the pooled SMD was 0.17 (95% CI -0.07-0.42; I2=64.8%). The pooled RR for need of rescue analgesics was 1.35 (95% CI 0.732.50; I2=82.2%). The pooled RRs were as follows: 1.18 (95% CI 0.76-1.84; I2=28.3%) for gastrointestinal side effects; 1.41 (95% CI 0.96-2.06; I2=29.7%) for neurological side effects; 2.83 (95% CI 0.98-8.18; I2=47%) for psychological side effects; and 0.58 (95% CI 0.23-1.48; I2=36.1%) for cardiopulmonary side effects.
Conclusion: Low-dose ketamine might have higher or equivalent efficacy and safety when compared to opioids for managing acute pain among patients presenting to the emergency setting. However, further studies are required to establish conclusive evidence, owing to the heterogeneity and poor quality of existing studies.
[West J Emerg Med. 2023;24(3)644–653.]
INTRODUCTION
Acute pain is responsible for more than half of the visits to the emergency department (ED).1,2 Therefore, management of acute pain is an essential aspect of patient satisfaction and care. Currently, opioids are the most common group of analgesics used for the management of acute pain.3 However, given the complications associated with use of opioids, many patients would benefit from an opioid alternative for
an effective and safer control of pain. In addition, certain categories of patients, such as opioid-naïve children and adults, the elderly, chronic users of opioid medications, patients with a history of opioid use disorder, and those using drugs for opioid use disorders or alcohol dependence, would also benefit from an effective alternative to opioids.4,5
Ketamine is a N-methyl-D-aspartate (NMDA) receptor antagonist drug with anaesthetic and analgesic properties.6
Western Journal of Emergency Medicine 644 Volume 24, NO.3: May 2023 Systematic Review
Efficacy of Low-dose Ketamine for Control of Acute Pain
While traditionally it was used as an anaesthetic, it was replaced by the newer class of anaesthetics with better efficacy and minimal side effects. Over the past few years, ketamine has been used in the emergency setting for induction before intubation and procedural sedations, given its dissociative properties that allow preservation of the airway reflexes and hemodynamic stability properties.7
At the lower sub-dissociative doses (less than 0.5 milligrams per kilogram [mg/kg] intravenous [IV] doses), ketamine has been shown to have better analgesic property than opiates for the acute and chronic pain.[8]. Although, the use of ketamine for managing acute pain is a relatively novel concept, it has certain unique features that could prove advantageous in improving patient outcomes, particularly for the group of people mentioned above. Several studies have examined the role of ketamine compared to opioids for the management of acute pain.9–11 Although few reviews have attempted to summarized the findings of these reports, they have included a very limited number of studies and provided inconclusive evidence on the efficacy and safety of ketamine for acute pain management.12,13 Our main goal in this comprehensive systematic review and meta-analysis was to evaluate the role of low-dose ketamine compared to opiates for the management of acute pain in the emergency setting.
MATERIALS AND METHODS Design
The protocol of the study was registered in PROSPERO, registration number CRD42021289270. In this systematic review, we used the “Preferred Reporting Items for Systematic Reviews and Meta-Analyses (PRISMA) statement 2020” for reporting meta-analyses.14
Eligibility Criteria Study Design
We included studies with any of the following study designs: parallel-arm individual or cluster randomized controlled trials (RCT). For cross-over trials, only the first half of the trial (before crossing over) were included. We included only published, full-text studies or abstracts, while excluding unpublished data or gray literature.
Participants
We included studies conducted in patients reporting to the emergency setting or ED with acute pain were included to form two groups (ketamine and control groups), irrespective of the cause of pain. We excluded studies conducted among postoperative patients.
Intervention and Comparison Groups
Studies using the IV low-dose ketamine (dose less than 0.5 mg/kg or equivalent) for the management of acute pain as intervention were included. The comparison group used
Population Health Research Capsule
What do we already know about this issue?
At the lower sub-dissociative doses (< 0.5 mg/ kg IV dose), ketamine has been shown to have better analgesic property than opiates for the acute and chronic pain.
What was the research question?
What is the efficacy of low-dose ketamine for the control of acute pain in emergency setting?
What was the major finding of the study?
The pooled standard mean difference of ketamine for pain score was -0.45 (95%CI: -0.84 to -0.07; p<0.001) within 30 minutes.
How does this improve population health?
The study provides important information to clinicians and emergency physicians on the use of low-dose ketamine for management of acute pain in emergency setting.
opioids such as morphine, fentanyl, etc, or were placebocontrolled trials or standard care.
Outcome Measures
Our outcome measures were pain score, the need for rescue analgesic medication, and adverse effects (gastrointestinal, neurological, psychological or cardiopulmonary side effects). Studies reporting either the pain score or need for rescue analgesic medication were included.
Search Strategy
We systematically searched electronic databases, including PubMed Central, EMBASE, MEDLINE, and the Cochrane Library and search engines such as ScienceDirect and Google Scholar, for eligible studies using medical subject headings and free-text words. Individual search results were combined, and the final search was performed using appropriate Boolean operators (“OR” and “AND”) and narrowed down using the available filters on time period (from inception to October 2021), language (English language only), as summarized in the Supplementary Appendix.
Study Selection
We selected the relevant studies by screening the title, abstract, and keywords of the identified manuscripts. For the studies that met the eligibility criteria, we then reviewed and screened the full-text articles were. The eligibility criteria of the reviews were assessed. We included studies that
Volume 24, NO.3: May 2023 645 Western Journal of Emergency Medicine
et al.
Ying
in the
Emergency Setting
Efficacy of Low-dose Ketamine for Control of Acute Pain in the Emergency Setting Ying
met eligibility criteria with respect to design, participants, intervention, comparisons, and outcomes. All cases of disagreement were resolved by discussion.
Data Extraction
Data was manually extracted using a predefined structured data extraction form and included authors, title of study, year of publication, study period, study design, setting, country/ region, total sample size, outcome assessment details, average age, and primary and secondary outcomes in each approach. The primary investigator was responsible for entering the data, and the secondary investigator double-checked for accuracy.
Risk-of-bias (Quality) Assessment
Quality of included studies was assessed by two independent investigators using the revised Cochrane risk-ofbias tool (RoB 2) for RCTs.15 We assessed risk of bias under the following domains:
Domain 1: Bias risk arising from the process of randomization
Domain 2: Bias risk due to deviation from the intended intervention
Domain 3: Bias risk arising due to missing data on outcomes
Domain 4: Bias risk in the measurement of outcome
Domain 5: Bias risk in the selection of reported result. Based on the rating obtained from these domains, we classified the quality of evidence of each study as having “low bias risk,” “high bias risk,” and “some concerns.”
Statistical Analysis
We performed data analysis using STATA version 14.2. (StataCorp LLC, College Station, TX). For continuous data such as pain score and total analgesic requirement, we obtained mean, standard deviation, and total sample size for both groups. The pooled effect was calculated as standardized mean difference (SMD) with 95% confidence interval, as different scales were used by each of the studies for reporting pain scores. Since all the other outcomes were dichotomous, the number of events and participants in each group were entered to obtain the pooled effect estimate as a risk ratio (RR) with 95% CI. Visual representation of these pooled estimates was done by forest plot. We used the random-effects model with inverse variance method to calculate the weight of individual studies.16
Heterogeneity was evaluated by chi square of heterogeneity and the I2 statistic. A P-value less than 0.05 in chi square testing indicated significant heterogeneity, while we used the I2 value to quantify the heterogeneity using the following criteria: less than 25% = mild heterogeneity, 25-75% = moderate heterogeneity and >75% = substantial heterogeneity.16 We performed subgroup analysis and meta-regression to explore the source of heterogeneity using possible potential covariates such as dose of ketamine and comparison group. Publication bias was evaluated and visually represented using a funnel plot. We assessed the
asymmetry of plot using Egger’s test. A P-value < 0.10 was considered as statistically significant publication bias.17
Quality of Evidence
The risk of bias and quality of evidence for included studies were independently assessed by two investigators using Grading of Recommendations Assessment, Development and Evaluation (GRADE) guidelines.16 The GRADE approach consists of five components: 1) risk of bias assessment; 2) indirectness; 3) imprecision; 4) inconsistency; and 5) publication bias.
Risk of bias assessment: Determined using the Cochrane risk-of-bias tool
Indirectness: Assessed in terms of population, intervention, comparison, or outcomes
Imprecision: Determined the precision of the estimate obtained, based on sample size and CI
Inconsistency: Assessed evidence of heterogeneity using the I2 statistic and chi square test of heterogeneity
Publication bias: Assessed using Egger’s test and a funnel plot. Finally, we classified the quality of the included studies as “very low,” “low,” “moderate,” and “high” based on certainty of evidence.
RESULTS Study Selection
Figure 1 shows the PRISMA flowchart of the study selection process. During primary screening, 188 full-text studies were retrieved. Of them, 133 studies remained after removal of duplicates. An additional three articles were
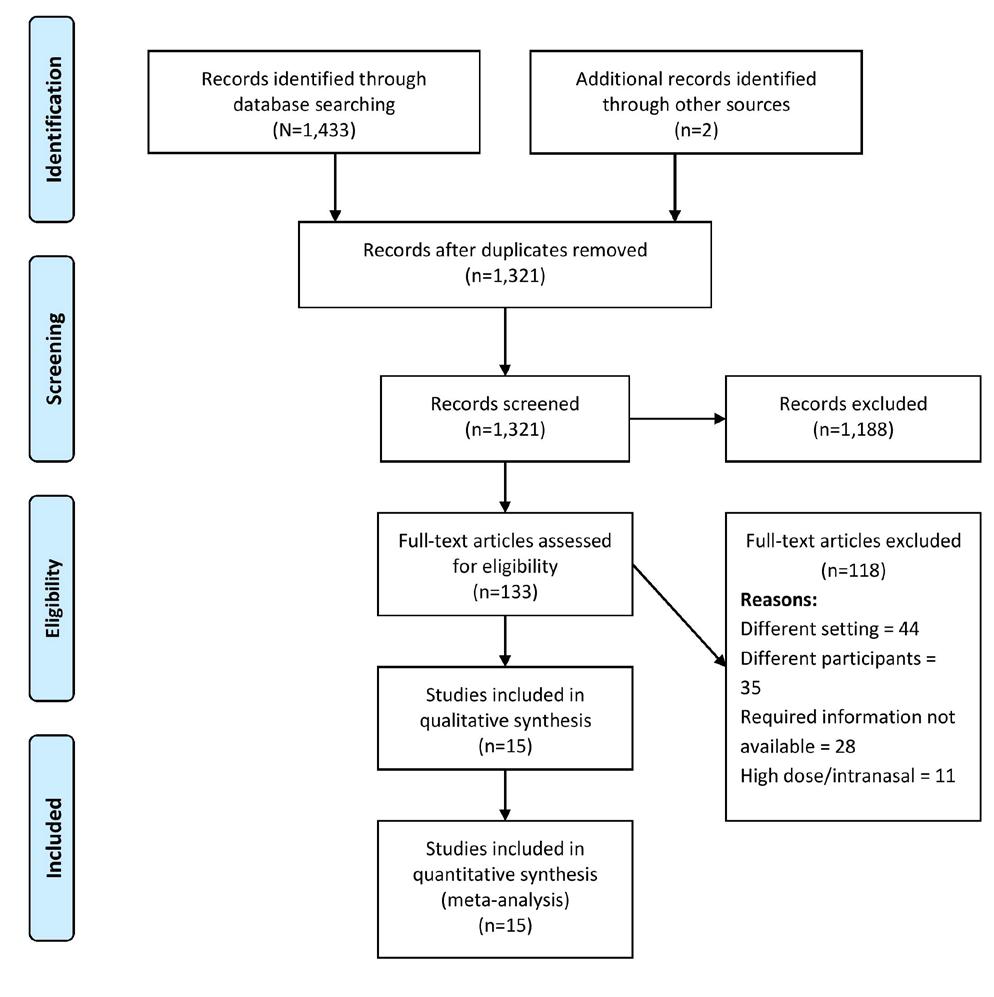
Western Journal of Emergency Medicine 646 Volume 24, NO.3: May 2023
et al.
Figure 1. PRISMA flowchart. PRISMA, Preferred Reporting Items for Systematic Reviews and Meta-Analyses.
Ying et al.
Efficacy of Low-dose Ketamine for Control of Acute Pain in the Emergency Setting
Table 1. Characteristics of the included studies (N=28).
with sickle cell disease who presented with acute sickle vasoocclusive crisis.
18-65 years old with acute moderate to severe pain and pain duration <7 days) who were deemed by their treating physician to require IV opioid
patients with three or more rib fractures admitted to a Level I trauma center
referred to EDs due to isolated limb traumatic injuries
18- 65 years of age with acute migraine at a single academic ED
Patients who had suffered kidney pain due to kidney stones referred to Ahvaz Imam
Hospital
patients with a severe acute pain defined as a VAS score of at least 60/100 were enrolled
Adult patients 1865 years with upper or lower extremity long bone fractures caused by blunt trauma referring to our ED
Elderly patients (age, ≥65 years) with three or more rib fractures admitted to a Level I trauma center
I, Intervention (ketamine) group; C, control/comparator group; FPS, Faces Pain Scale; NR, not reported; NRS, Numerical Rating Scale; VAS, Visual Analog Scale; USA, United States of America; ED, emergency department.
Volume 24, NO.3: May 2023 647 Western Journal of Emergency Medicine
Author and year Country Sample size Study participants Pain scale Route of administration of ketamine Dose of ketamine Comparator group Mean age Risk of bias Alshahrani 2021 Saudi Arabia I=138 C=140 Adults
NRS Intravenous 0.3 mg/ kg Morphine I=29.1 C=29.6 High Beaudoin 2014 USA I=20 C=20 Patients
NRS Intravenous 0.3 mg/ kg Morphine I=37.5 C=32.5 Some concerns Carver 2019 USA I=45 C=46 Adult
NRS Intravenous 2.5 μg/kg Placebo I=46 C=50 High Esfahani 2021 Iran I=36 C=37 Patients
NRS Intravenous 0.1 mg/ kg Morphine I=32.5 C=33.4 High Etchison 2018 USA I=16 C=18 Adults
NRS Intravenous 0.2 mg/ kg Placebo I=38.5 C=30.5 Some concerns Forouzan
I=68 C=68
2019 Iran
Khomeini
NRS Intravenous 0.3 mg/ kg Morphine NR High Galinski
I=33 C=32
VAS Intravenous 0.2 mg/ kg Placebo I=35 C=40 Some concerns
I=78 C=78
2007 France
Trauma
Jahanian 2018 Iran
VAS Intravenous 0.5 mg/ kg Morphine I=35.8 C=36.3 High
I=30 C=29
NRS Intravenous 0.2 mg/ kg Placebo I=75 C=73 High
Kugler 2019 USA
Efficacy of Low-dose Ketamine for Control of Acute Pain in the Emergency Setting
patients aged 18-70 years with a musculoskeletal pain score of 5 or more on 11-point NRS who were referred to EDs
with fractures of long bones, referred to the emergency unit.
18- 59 years with acute abdominal, flank, low back, or extremity pain were enrolled
patients
years and experiencing moderate to severe acute abdominal, flank, or musculoskeletal pain
patients
years and experiencing moderate to severe acute abdominal, flank, or musculoskeletal pain
Sin 2017 USA
Patients >18 years who presented to the ED with a chief complaint of acute pain with moderate to severe intensity
I, Intervention (ketamine) group; C, control/comparator group; FPS, Faces Pain Scale; NR, not reported; NRS, Numerical Rating Scale; VAS, Visual Analog Scale; USA,
retrieved from the bibliography of the screened articles. Studies underwent secondary screening that resulted in a total of 15 studies with 1,613 participants, which satisfied the inclusion criteria and were included in the analysis.9–11,18–29
Study Characteristics
We have included only RCTs in our review. Most studies (8/15) were conducted in the United States of America (US), followed by Middle Eastern countries such as Iran and Saudi Arabia. The mean age of study participants in the intervention arm ranged from 29.1-77.3 years, while in the control arm it ranged from 29.6-77.1.
The sample sizes among the included studies varied from 34-300. The IV dose of ketamine ranged from 0.1-0.5 mg/ kg. Morphine was the most commonly used opioid in the comparison group (10 studies) followed by placebo (normal saline in five studies). Regarding quality assessment, at least half of the studies had higher risk of bias (seven studies), while the remaining studies evidenced some concerns as per the RoB 2 checklist ( Table 1 ) .
Efficacy of Ketamine for Control of Acute Pain
Pain Score within 15 Minutes
Four studies reported on the difference in pain score
Western Journal of Emergency Medicine 648 Volume 24, NO.3: May 2023
et al. Author and year Country Sample size Study participants Pain scale Route of administration of ketamine Dose of ketamine Comparator group Mean age Risk of bias Mahshidfar
I=150 C=150 Trauma
NRS Intravenous 0.2 mg/ kg Morphine I=34.4 C=34.1 Some concerns Majidinejad
I=63 C=63 Patients
NRS Intravenous 0.5 mg/ kg Morphine I=35.1 C=53.6 Some concerns Miller
I=24 C=21 Patients
NRS Intravenous 0.3 mg/ kg Morphine I=31 C=29 Some concerns Motov 2015 USA I=45 C=45 ED
NRS Intravenous 0.3 mg/ kg Morphine I=35 C=36 Some concerns Motov
I=30 C=30 ED
NRS Intravenous 0.3 mg/ kg Morphine I=77.3 C=77.1 Some concerns
C=30
NRS Intravenous 0.3 mg/ kg Placebo I=41 C=48 High
Ying
2017 Iran
2014 Iran
2015 USA
18-55
2019 USA
18-55
I=30
Table 1. Continued.
United States of America; ED, emergency department.
Ying et al.
Efficacy of Low-dose Ketamine for Control of Acute Pain in the Emergency Setting
within 15 minutes. The pooled SMD was -0.12 (95% CI -0.50-0.25; I2=68.8%), indicating no significant difference between the ketamine and control groups in the control of pain within 15 minutes (Figure 2A). Analysis based on the dose of ketamine was not possible as each of the studies used different doses, making it difficult to provide a pooled estimate for each dose. Similarly, analysis based on the control group was not possible as all the studies used morphine in the control group. The quality of evidence was found to be low as per the GRADE approach.
Pain Score within 30 Minutes (15-29 minutes)
Seven studies reported on the difference in pain score within 30 minutes. The pooled SMD was -0.45 (95% CI -0.84- -0.07; I2=83.3%), indicating a significant decline in the pain score among the patients’ receiving ketamine when compared to the control arm within 30 minutes (Figure 2B) Sensitivity analysis did not affect the significant findings obtained in the primary analysis in terms of magnitude or direction of association because of small-study effects (Supplementary Figure 1). The most commonly used dose of ketamine (five studies) was 0.3 mg/kg and was associated with a significant difference in pain score (pooled SMD = -0.51, 95% CI -1.01- -0.01). Analysis based on the control group was not possible as all the studies (except Sin et al 2017) used morphine as control group. The quality of evidence was found to be low as per the GRADE approach.
Pain Score within 45 Minutes (30-44 minutes)
Eleven studies reported on the difference in pain score within 45 minutes. The pooled SMD was -0.05 (95% CI -0.41-0.31; I2=86.9%), indicating no significant difference in pain score between ketamine and the control group within 45 minutes (Figure 2C). Sensitivity analysis did not reveal any significant difference in the magnitude or direction of association because of small-study effects (Supplementary Figure 2). The funnel plot showed a symmetrical plot indicating the lack of publication bias (Supplementary Figure 3), and it was further confirmed by a nonsignificant Egger’s test (P=0.96). The quality of evidence was found to be low as per the GRADE approach.
Analysis based on the dose of ketamine did not show significant effect at any of the doses ranging from 0.1-0.5 mg/kg. Analysis based on the control group did not reveal a significant effect for ketamine when compared to morphine (pooled SMD = -0.11; 95% CI -0.3-0.13) or placebo (pooled SMD = 0.42, 95% CI -1.51-2.36). Univariable meta-regression revealed that none of these factors were responsible for the significant heterogeneity in the estimates. The quality of evidence was found to be low as per the GRADE approach.
Pain Score between 45-60 Minutes
Eight studies reported on the difference in pain score between 45-60 minutes. The pooled SMD was -0.07 (95% CI -0.41 to 0.26; I2=82%), indicating no significant difference in
pain score between the ketamine and control groups between 45-60 minutes (Figure 2D). Sensitivity analysis did not reveal any significant difference in the magnitude or direction of association because of small-study effects (Supplementary Figure 4). Analysis based on the dose of ketamine did not show significant effect at any of the doses ranging from 0.1-0.5 mg/kg. Analysis based on the control group was not possible as all the studies (except Sin et al 2017) used morphine in the control group. The quality of evidence was found to be low as per the GRADE approach.
Pain Score after 60 Minutes
Eight studies reported on the difference in pain score after 60 minutes. The pooled SMD was 0.17 (95% CI -0.070.42; I2=64.8%), indicating no significant difference in pain score between the ketamine group and control group after 60 minutes (Figure 2E). Sensitivity analysis did not reveal any significant difference in the magnitude or direction of association because of small-study effects (Supplementary Figure 5). Analysis based on the dose of ketamine was not possible as each of the studies used a different dose, making it difficult to provide a pooled estimate for each dose. Analysis based on the control group did not reveal a significant effect for ketamine when compared to morphine (pooled SMD = 0.28, 95% CI 0.05-0.62) or placebo (pooled SMD = -0.05, 95% CI -0.32-0.22). The quality of evidence was found to be low as per the GRADE approach.
Need for Rescue Analgesic Medication
Five studies reported on the difference in need for rescue analgesic medication between the ketamine and control groups. The pooled RR was 1.35 (95% CI 0.73- 2.50; I2=82.2%), indicating no significant difference in need for rescue analgesics between the ketamine and control groups (Figure 3). Sensitivity analysis did not reveal any significant difference in the magnitude or direction of association because of small-study effects (Supplementary Figure 6). Analysis based on the dose of ketamine did not show significant effect at any of the doses ranging from 0.1-0.5 mg/kg. Analysis based on the control group was not possible as all the studies (except Etchison et al 2018) used morphine in the control group. The quality of evidence was found to be low as per the GRADE approach.
Adverse Effects
Gastrointestinal Side Effects
Ten studies reported on the difference in gastrointestinal side effects (nausea and vomiting) between the ketamine and control groups. The pooled RR was 1.18 (95% CI 0.761.84; I2=28.3%), indicating no significant difference in the gastrointestinal side effects between the ketamine and control groups (Figure 4A). Analysis based on the dose of ketamine did not show any difference in gastrointestinal side effects at any of the doses ranging from 0.1-0.5 mg/kg. Analysis based on the control group revealed no significant difference
Volume 24, NO.3: May 2023 649 Western Journal of Emergency Medicine
compared to any of the control group. The quality of evidence was found to be low as per the GRADE approach.
Neurological Side Effects
Ten studies reported on the difference in neurological side effects (dizziness, drowsiness, emergence phenomena,
dysphoria/dissociation) between the ketamine and control groups. The pooled RR was 1.41 (95% CI 0.96-2.06; I2=29.7%), indicating no significant difference in the neurological side effects between the ketamine and control groups (Figure 4B). Analysis based on the dose of ketamine showed significantly higher risk of neurological side effects
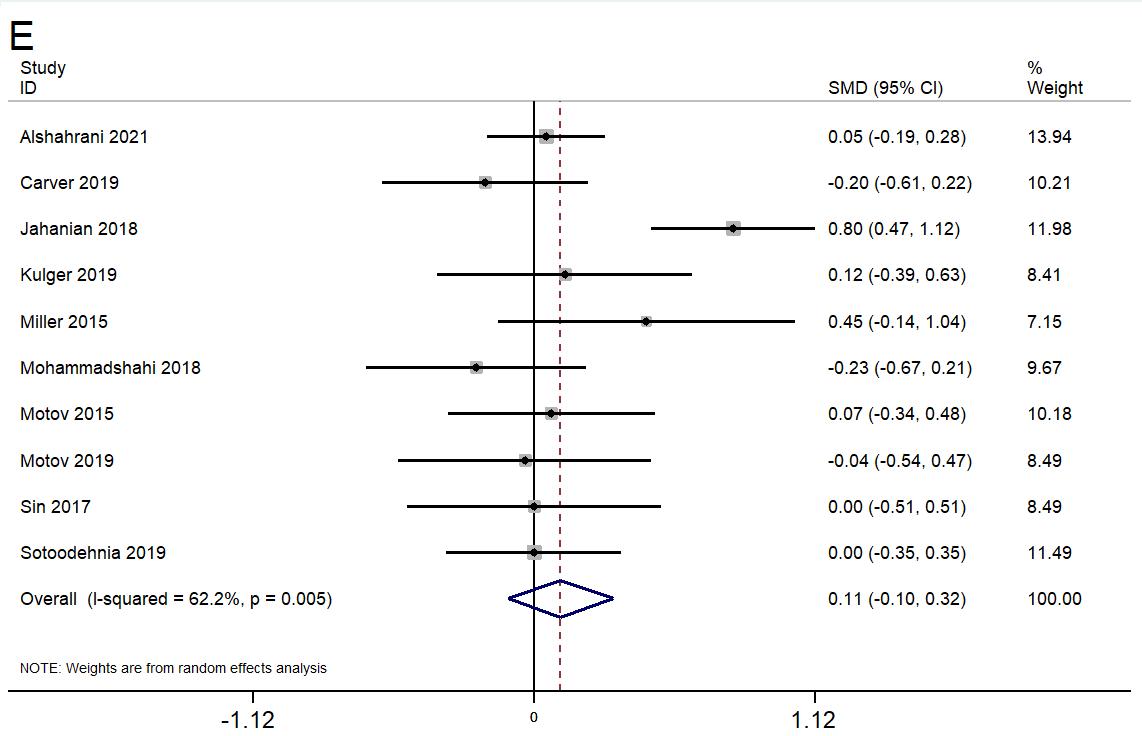
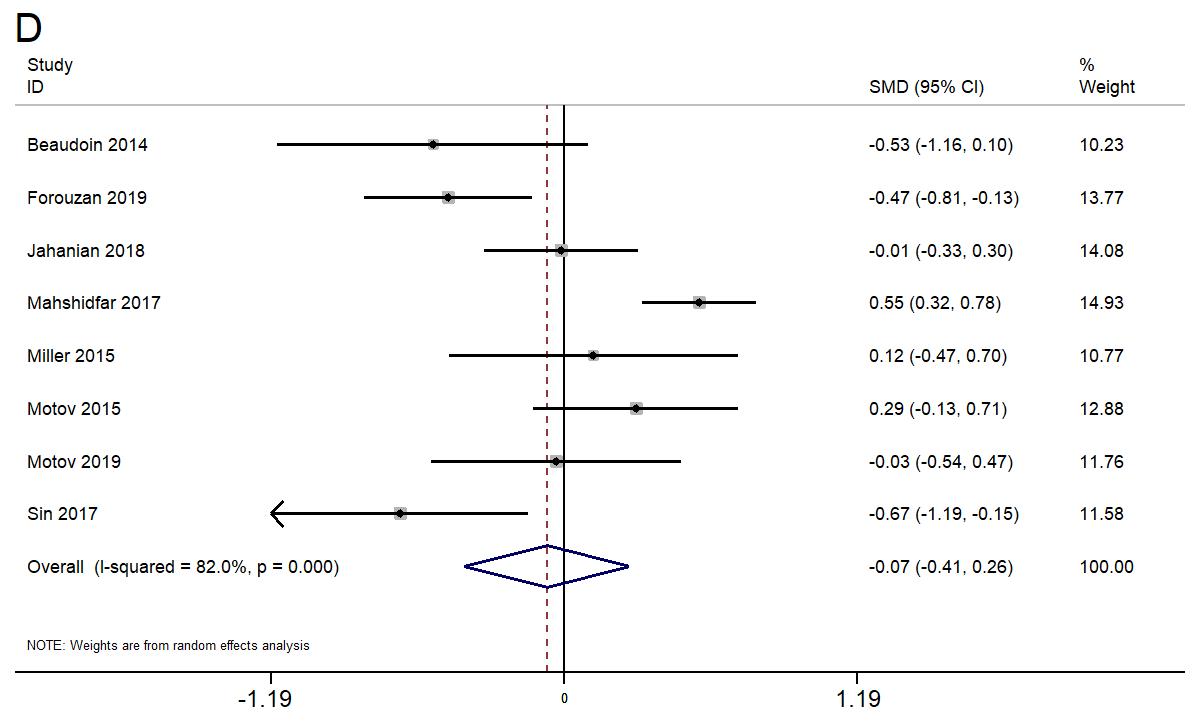
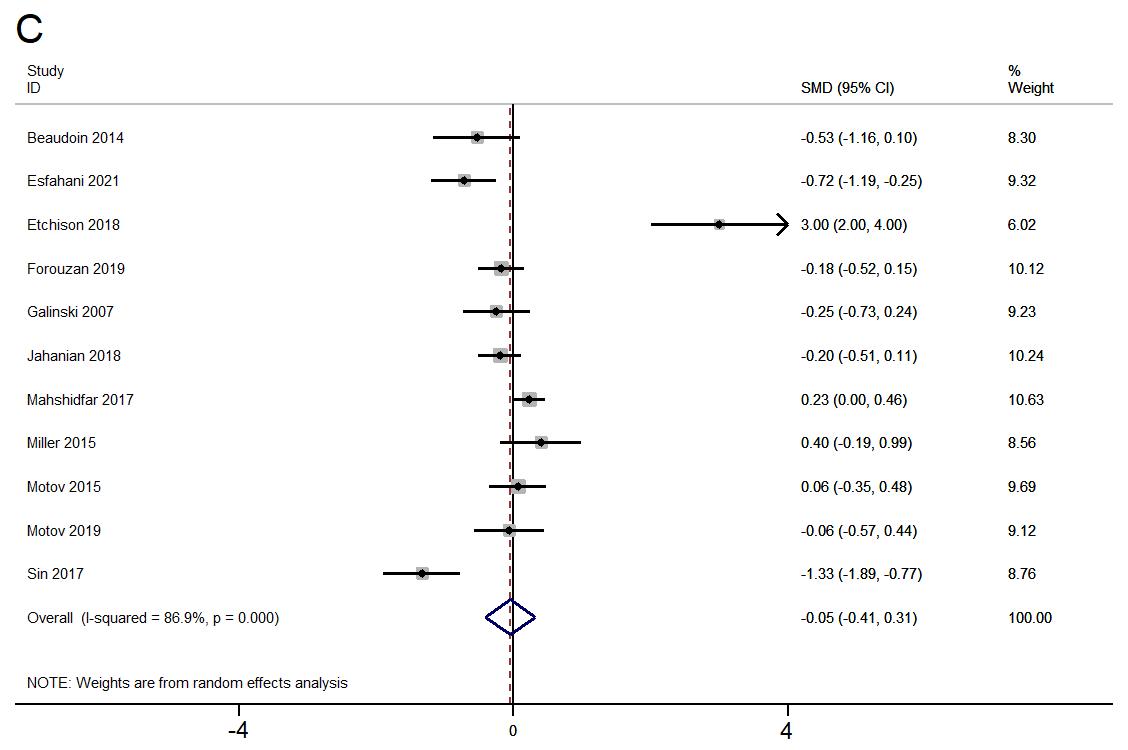
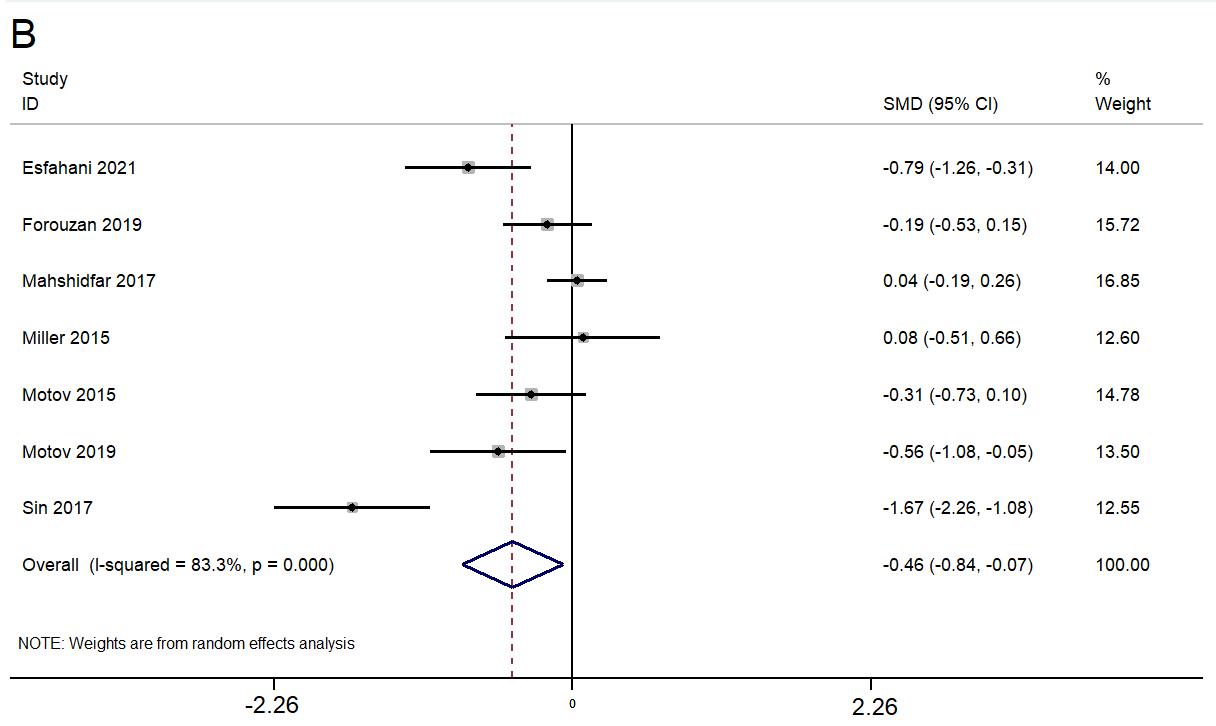
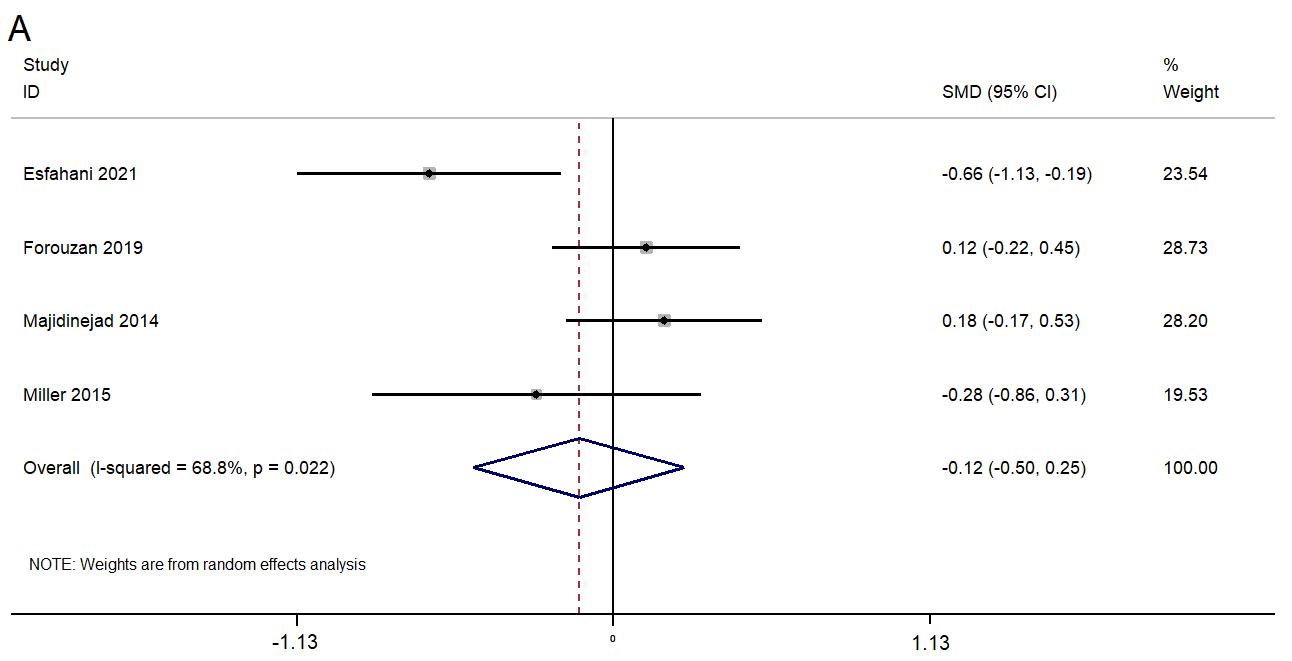
Western Journal of Emergency Medicine 650 Volume 24, NO.3: May 2023 Efficacy of Low-dose Ketamine for Control of Acute Pain in the Emergency Setting Ying et al.
Figure 2. Forest plot showing the difference in pain score between ketamine and control group A) within 15 minutes, B) within 30 minutes, C) within 45 minutes, D) within 60 minutes, and E) > 60 minutes.
at a dose of 0.3 mg/kg (pooled RR=1.82, 95% CI 1.17- 2.83), while it was not significant at a dose less than 0.3 mg/kg. Analysis based on the control group revealed no significant difference compared to any of the control group. The quality of evidence was found to be low as per the GRADE approach.
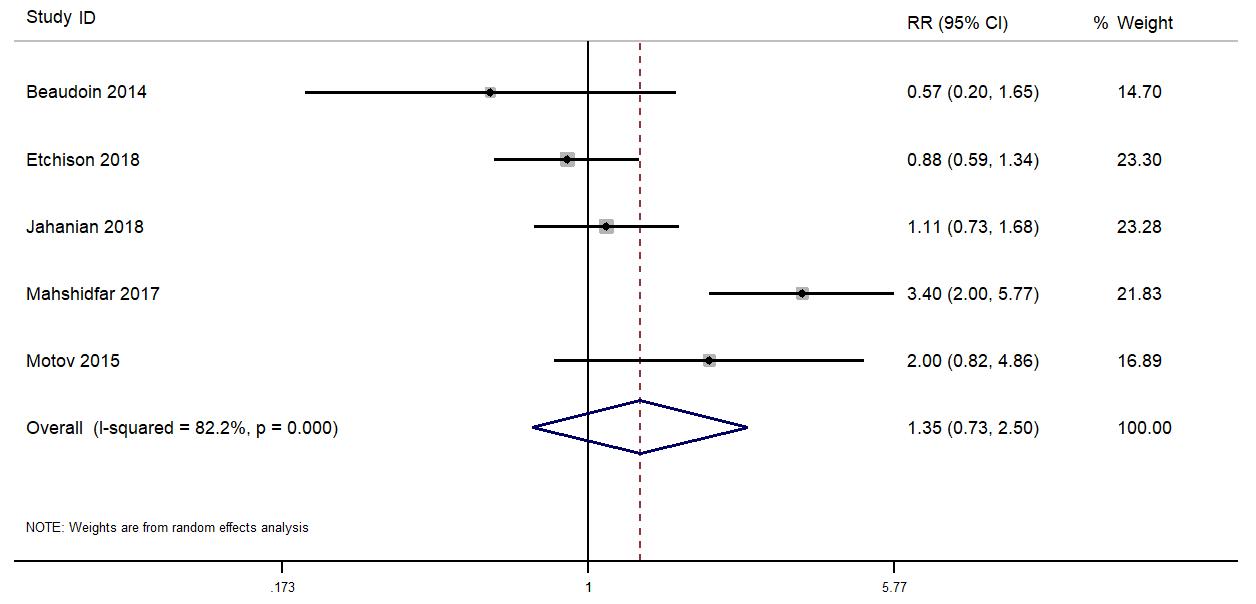
Psychological Side Effects
Six studies reported on the difference in psychological side effects (delirium, hallucinations, and mood changes) between the ketamine and control groups. The pooled RR was 2.83 (95% CI 0.98-8.18; I2=47%), indicating no significant difference in psychological side effects between the ketamine and control groups (Figure 4C). Subgroup analysis based on the route of administration, dose, or control group did not reveal any difference in terms of magnitude or direction of association. The quality of evidence was found to be low as per the GRADE approach.
Cardiopulmonary Side Effects
Seven studies reported on the difference in cardiopulmonary side effects (hypoxia, hypotension, and respiratory failure) between the ketamine and control groups. The pooled RR was 0.58 (95% CI 0.231.48; I 2=36.1%), indicating no significant difference in cardiopulmonary side effects between the ketamine and control groups ( Figure 4D ) . Subgroup analysis based on the route of administration, dose, or control group did not reveal any difference in terms of magnitude or direction of association. The quality of evidence was found to be low as per the GRADE approach.
DISCUSSION
Our aim in this systematic review was to obtain a comprehensive estimate of the efficacy and safety of lowdose ketamine for the control of acute pain among patients presenting to the ED. We found that ketamine causes a significant decline in the pain score within 30 minutes of infusion when compared to any control group. We also found
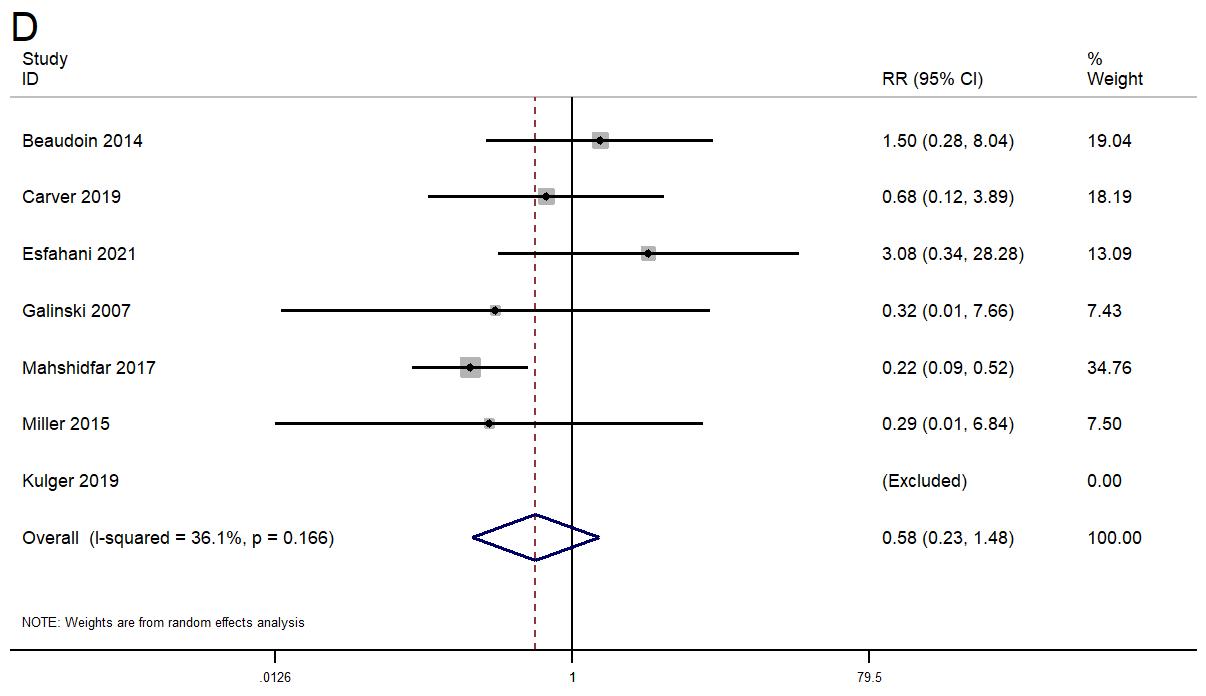
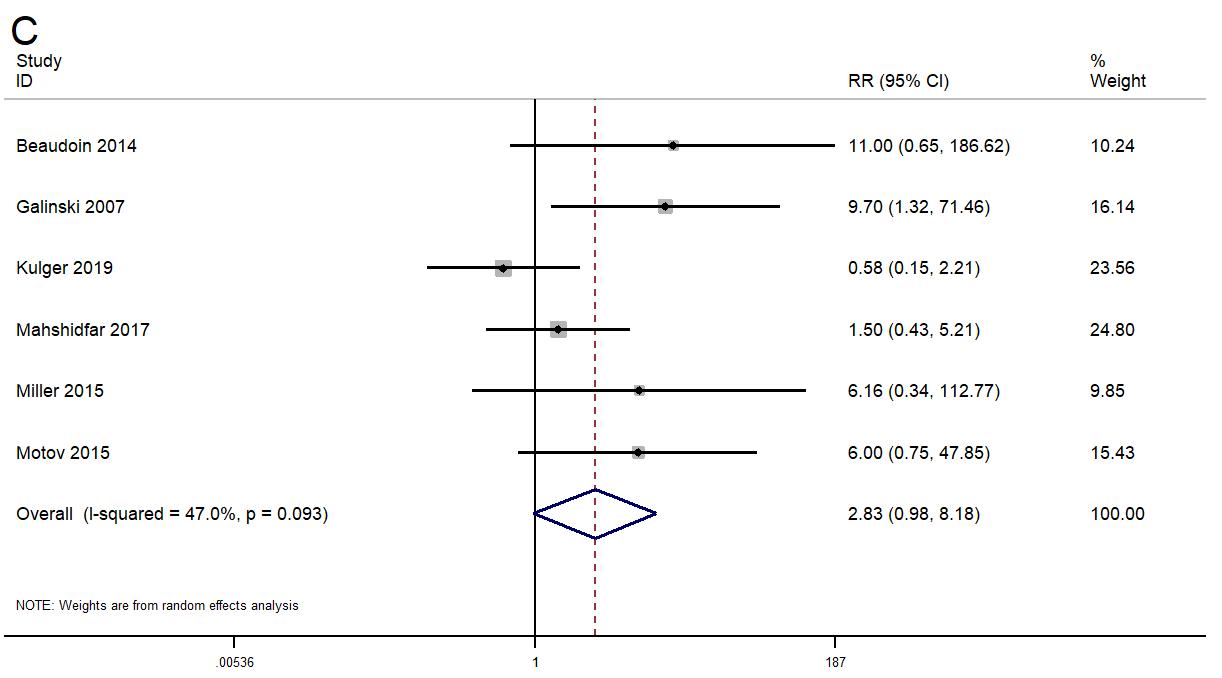
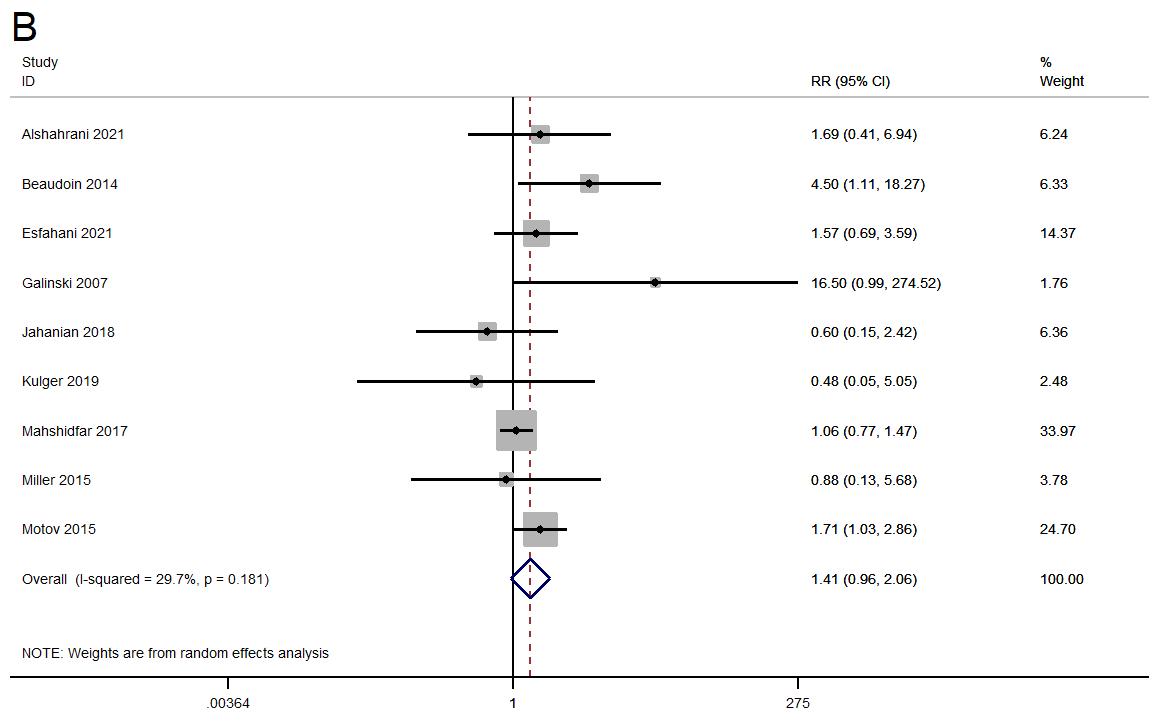
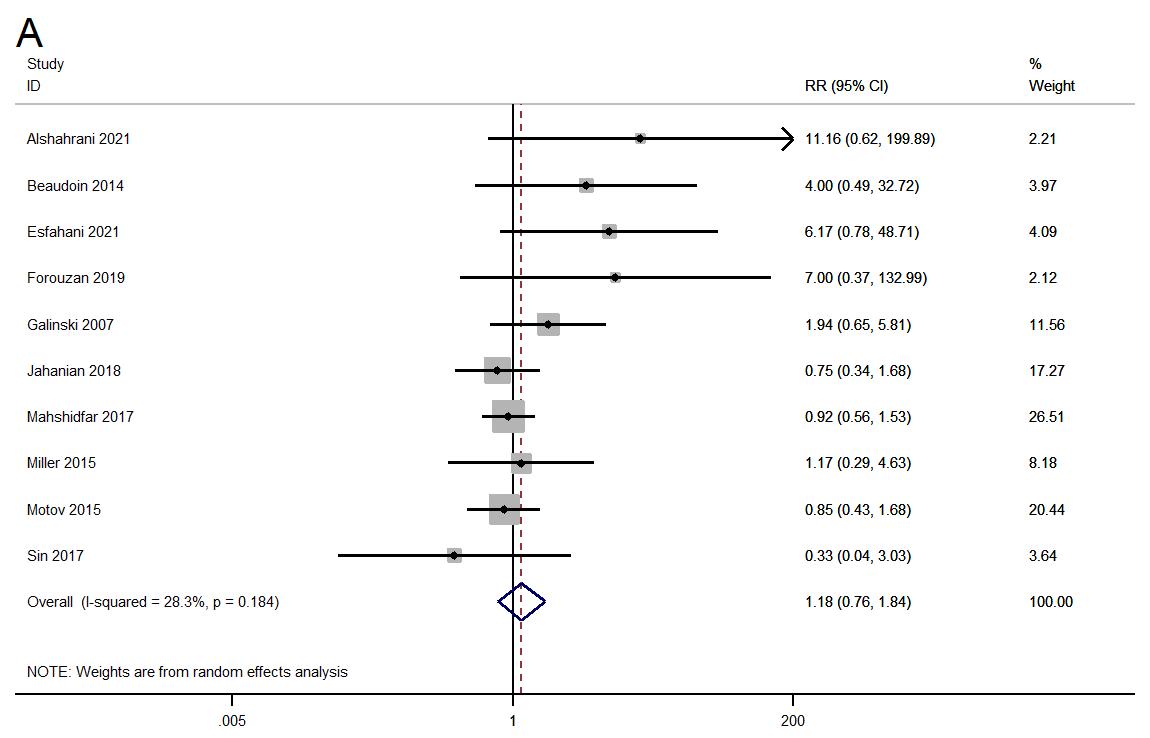
Volume 24, NO.3: May 2023 651 Western Journal of Emergency Medicine Ying et al. Efficacy of Low-dose Ketamine for Control of Acute Pain in the Emergency Setting
Figure 3. Forest plot showing the difference in need for rescue analgesic between the ketamine and control groups.
Figure 4. Forest plot showing the difference in adverse reactions between the ketamine and control groups. A) gastrointestinal side effects, B) neurological side effects, C) psychological side effects, and D) cardiopulmonary side effects.
Efficacy of Low-dose Ketamine for Control of Acute Pain in the Emergency Setting
that ketamine had maximum efficacy at a dosage of 0.3 mg/kg when administered through the IV route. However, primary evidence is limited on the dose-related analysis and conclusive evidence on dosage cannot be provided. Ketamine had better efficacy when compared to morphine and placebo. However, its effect was similar to morphine and placebo at other time intervals (>30 minutes). Previous reviews have also reported that ketamine had equivalent or higher efficacy in the pain score at short-term and long-term time intervals compared to opioids such as morphine or fentanyl.12,13,30 In addition, a review has also reported 0.3 mg/ kg as the optimal dose of ketamine.13
Mechanism of action of ketamine involves binding to the spinal μ receptors and increasing the efficacy of the opioid-induced signalling.31 In addition, ketamine also functions as a NMDA receptor antagonist and acts preferentially post-synoptically, causing a reduction in hyperexcitability.32 Therefore, the blockage of NMDA by ketamine might further improve the opioid efficacy leading to opioid-sparing effect.
We also assessed risk of various adverse effects associated with ketamine for the management of acute pain in emergency settings. We found that ketamine was associated with a significantly higher risk of neurological side effects at a dose of 0.3 mg/kg when compared to the opioid group of drugs. Previous reviews have also warned against the neurological complications of ketamine, especially at higher doses. Ketamine prevents serious adverse effects of opioids and inhibits the chronic pain that develops due to opioid tolerance.33,34 Ketamine inhibits nociception through the high affinity and selective interaction with the NMDA receptor.33,34At the full-anaesthetic dose, ketamine activates different types of opioid receptors, such as κ, μ, and σ opioid receptors, with various affinities.35,36 However, previous review has shown that a higher rate of neurological effects was associated with the intranasal route.37,38 Other adverse effects such as gastrointestinal, psychological, and cardiopulmonary effects were almost equivalent between the ketamine and opioid groups.
The major strength of this paper is that it provides an up-to-date, comprehensive review of the efficacy and safety of low-dose ketamine in the management of acute pain among patients presenting to the emergency setting. This review also includes a large number of studies to provide a reasonable estimate on burden. We performed additional sensitivity analysis, subgroup analysis, and meta-regression to provide a more robust estimate. We did not find significant publication bias, adding more credibility to the results.
LIMITATIONS
Our review did have certain limitations. Almost half of the included studies had high risk of bias. The chi square test for heterogeneity also revealed significant variability across the included studies. This could have led to biased estimates with limited generalizability. We tried to overcome this limitation by
performing meta-regression. However, meta-regression could not be performed for the majority of the outcomes due to the limitation in the number of studies (<10 studies). Ketamine works fairly quickly, yet only four studies reported pain scores within 15 minutes, and only seven studies reported them within 30 minutes. This was a limitation with the primary studies, in that it was not possible to really report the full pain effect of ketamine. Finally, we could not perform subgroup analysis based on the type of pain. Future studies could specifically focus on different types of pain conditions, as the mechanism and neurochemistry behind the pain pathways for each condition is entirely different.
CONCLUSION
Low-dose ketamine may have equivalent or higher efficacy and safety when compared to opioids for managing acute pain among patients presenting to the emergency care setting. However, we could not make a conclusive recommendation based on the available evidence. Hence, further studies are required to compare the combination of ketamine with specific opioids to identify the best approach to pain control. This will help clinicians manage their patients with the least chance of complications and an optimal success rate.
Address for Correspondence: Yuetun Zuo, MD, Changxing People’s Hospital of China, Department of Emergency Medicine, 66 Taihu Middle Road, Huzhou, Zhejiang, China. Email: heiming7k@163.com.
Conflicts of Interest: By the WestJEM article submission agreement, all authors are required to disclose all affiliations, funding sources and financial or management relationships that could be perceived as potential sources of bias. No author has professional or financial relationships with any companies that are relevant to this study. There are no conflicts of interest or sources of funding to declare.
Copyright: © 2023 Ying et al. This is an open access article distributed in accordance with the terms of the Creative Commons Attribution (CC BY 4.0) License. See: http://creativecommons.org/ licenses/by/4.0/
REFERENCES
1. Cordell WH, Keene KK, Giles BK, et al. The high prevalence of pain in emergency medical care. Am J Emerg Med. 2002;20:165–9.
2. Todd KH, Ducharme J, Choiniere M, et al. Pain in the emergency department: results of the pain and emergency medicine initiative (PEMI) multicenter study. J Pain. 2007;8:460–6.
3. Todd KH. A Review of Current and emerging approaches to pain management in the emergency department. Pain Ther. 2017;6:193–202.
4. Hawk K, D’Onofrio G. Emergency department screening and interventions for substance use disorders. Addict Sci Clin Pract. 2018;13:18.
Western Journal of Emergency Medicine 652 Volume 24, NO.3: May 2023
et al.
Ying
5. Ukkonen M, Jämsen E, Zeitlin R, et al. Emergency department visits in older patients: a population-based survey. BMC Emerg Med. 2019;19:20.
6. PubChem. Ketamine. Available at: https://pubchem.ncbi.nlm.nih.gov/ compound/3821. Accessed January 1, 2022.
7. Beatty L, MacQuarrie K, Zed P. Airway management pharmacology. In: Airway Management in Emergencies-A Free Open Access Living Textbook
8. Kurdi MS, Theerth KA, Deva RS. Ketamine: current applications in anesthesia, pain, and critical care. Anesth Essays Res. 2014;8:283–90.
9. Majidinejad S, Esmailian M, Emadi M. Comparison of intravenous ketamine with morphine in pain relief of long bones fractures: a double blind randomized clinical trial. Emerg (Tehran) 2014;2:77–80.
10. Motov S, Rockoff B, Cohen V, et al. Intravenous subdissociative-dose ketamine versus morphine for analgesia in the emergency department: a randomized controlled trial. Ann Emerg Med. 2015;66:222-229.e1.
11. Forouzan A, Masoumi K, Motamed H, et al. Comparison of the analgesic effect of intravenous ketamine versus intravenous morphine in reducing pain of renal colic patients: double-blind clinical trial study. Rev Recent Clin Trials. 2019;14:280–5.
12. Karlow N, Schlaepfer CH, Stoll CRT, et al. A systematic review and meta-analysis of ketamine as an alternative to opioids for acute pain in the emergency department. Acad Emerg Med. 2018;25:1086–97.
13. Lee EN, Lee JH. The effects of low-dose ketamine on acute pain in an emergency setting: a systematic review and meta-analysis. PLoS One. 2016;11:e0165461.
14. Page MJ, McKenzie JE, Bossuyt PM, et al. Updating guidance for reporting systematic reviews: development of the PRISMA 2020 statement. J Clin Epidemiol. 2021;:103–12.
15. Sterne JAC, Savović J, Page MJ, et al. RoB 2: a revised tool for assessing risk of bias in randomised trials. BMJ. 2019;366:l4898.
16. IDoStatistics. Higgins, J. P. T., & Green, S. (Eds.) (2008). Cochrane Handbook for Systematic Reviews of Interventions. 2016. Available at: https://idostatistics.com/higgins-green-2008-cochrane-handbooksystematic-reviews-interventions/. Accessed December 13, 2019.
17. Egger M, Smith GD, Schneider M, et al. Bias in meta-analysis detected by a simple, graphical test. BMJ. 1997;315:629–34.
18. Mahshidfar B, Mofidi M, Fattahi M, et al. Acute pain management in emergency department, low dose ketamine versus morphine, a randomized clinical trial. Anesth Pain Med. 2017;7:e60561.
19. Beaudoin FL, Lin C, Guan W, et al. Low-dose ketamine improves pain relief in patients receiving intravenous opioids for acute pain in the emergency department: results of a randomized, double-blind, clinical trial. Acad Emerg Med. 2014;21:1193–202.
20. Jahanian F, Hosseininejad SM, Amini Ahidashti H, et al. Efficacy and safety of morphine and low dose ketamine for pain control of patients with long bone fractures: a randomized, double-blind, clinical trial. Bull Emerg Trauma. 2018;6:31–6.
21. Esfahani H, Khazaeipour Z, Safaie A, et al. Ketamine sub-dissociative dose vs. morphine sulfate for acute pain control in patients with isolated limb injuries in the emergency department: a randomized, double-blind, clinical trial. Bull Emerg Trauma. 2021;9:73–9.
22. Motov S, Mann S, Drapkin J, et al. Intravenous subdissociative-dose ketamine versus morphine for acute geriatric pain in the emergency department: a randomized controlled trial. Am J Emerg Med. 2019;37:220–7.
23. Alshahrani MS, AlSulaibikh AH, ElTahan MR, et al. Ketamine administration for acute painful sickle cell crisis: a randomized controlled trial. Acad Emerg Med. 2022;29(2):150-8.
24. Carver TW, Kugler NW, Juul J, et al. Ketamine infusion for pain control in adult patients with multiple rib fractures: results of a randomized control trial. J Trauma Acute Care Surg. 2019;x:181–8.
25. Kugler NW, Carver TW, Juul J, et al. Ketamine infusion for pain control in elderly patients with multiple rib fractures: results of a randomized controlled trial. J Trauma Acute Care Surg. 2019;87:1181–8.
26. Etchison AR, Bos L, Ray M, et al. Low-dose ketamine does not improve migraine in the emergency department: a randomized placebocontrolled trial. West J Emerg Med. 2018;19:952–60.
27. Miller JP, Schauer SG, Ganem VJ, et al. Low-dose ketamine vs morphine for acute pain in the ED: a randomized controlled trial. Am J Emerg Med. 2015;33:402–8.
28. Galinski M, Dolveck F, Combes X, et al. Management of severe acute pain in emergency settings: ketamine reduces morphine consumption. Am J Emerg Med. 2007; 134:385–90.
29. Sin B, Tatunchak T, Paryavi M, et al. The use of ketamine for acute treatment of pain: a randomized, double-blind, placebo-controlled trial. J Emerg Med. 2017;52:601–8.
30. Balzer N, McLeod SL, Walsh C, et al. Low-dose ketamine for acute pain control in the emergency department: a systematic review and metaanalysis. Acad Emerg Med. 2021;28:444–54.
31. Gupta A, Devi LA, Gomes I. Potentiation of μ-opioid receptor-mediated signaling by ketamine. J Neurochem. 2011;119:294–302.
32. Dickenson AH. NMDA receptor antagonists: interactions with opioids. Acta Anaesthesiol Scand. 1997;41:112–5.
33. Stubhaug A, Breivik H, Eide PK, et al. Mapping of punctuate hyperalgesia around a surgical incision demonstrates that ketamine is a powerful suppressor of central sensitization to pain following surgery. Acta Anaesthesiol Scand 1997;41:1124–32.
34. Oye I, Paulsen O, Maurset A. Effects of ketamine on sensory perception: evidence for a role of N-methyl-D-aspartate receptors. J Pharmacol Exp Ther. 1992;260:1209–13.
35. Smith DJ, Bouchal RL, deSanctis CA, et al. Properties of the interaction between ketamine and opiate binding sites in vivo and in vitro. Neuropharmacology. 1987;26:1253–60.
36. Sarton E, Teppema LJ, Olievier C, et al. The involvement of the mu-opioid receptor in ketamine-induced respiratory depression and antinociception. Anesth Analg. 2001;93:1495–500.
37. Oliveira J E Silva L, Lee JY, Bellolio F, et al. Intranasal ketamine for acute pain management in children: a systematic review and metaanalysis. Am J Emerg Med. 2020;38(9):1860-6.
38. Seak YS, Nor J, Tuan Kamauzaman TH, et al. Efficacy and safety of intranasal ketamine for acute pain management in the emergency setting: a systematic review and meta-analysis. J Clin Med. 2021;10:3978.
Volume 24, NO.3: May 2023 653 Western Journal of Emergency Medicine Ying et al. Efficacy of Low-dose Ketamine for Control of Acute Pain in the Emergency Setting
A publication of CORD Educati
We believe that all learners should benefit from active learning. We are an online, open access, peer-reviewed journal-repository for EM educators in all major topic areas.
Scholarship
We believe educators should advance through the scholarship of their educational work. JETem gives you the opportunity to publish & distribute your outstanding, scholarly academic work.

em Journal of Education & Teaching in Emergency Medicine JET ™ published by eScholarship University of California visualem lect e tbl al bo ds podcasts small ps simulati www.jetem.org
your content or contact us to become a reviewer! c iculum inn ati s
Submit

Championing individual physician rights and workplace fairness JOIN CAL/AAEM! BENEFITS - Western Journal of Emergency Medicine Subscription - CAL/AAEM News Service email updates - Free and discounted registration to CAL/AAEM events - And more! CAL/AAEM NEWS SERVICE - Healthcare industry news - Public policy - Government issues - Legal cases and court decisions In collaboration with our official journal Join the CAL/AAEM Facebook Group to stay up-to-date: www.facebook.com/groups/calaaem www.aaem.org/calaaem AAEM-0720-255
E volv ED: Redefining EM
CALIFORNIA ACEP’S ANNUAL CONFERENCE 2023


Education is targeted to Medical Students and Residents, but all are welcome to attend.

Friday, September 8, 2023
The Sheraton Pasadena