
Artificial Ducts Created via High-Power HF Radio Waves at EISCAT

Arctic and Antarctic Research Institute, St. Petersburg 199397, Russia
*
Author to whom correspondence should be addressed.
Remote Sens. 2023, 15(9), 2300; https://doi.org/10.3390/rs15092300
Submission received: 13 March 2023
/
Revised: 19 April 2023
/
Accepted: 24 April 2023
/
Published: 27 April 2023
(This article belongs to the Section Atmospheric Remote Sensing)
Abstract
:Ducts (field-aligned plasma density enhancements) provide a link into the magnetosphere and can guide whistler waves. Inside ducts, wave-particle interactions occur efficiently; therefore, their presence contributes to the removal of energetic particles from the magnetosphere. We present experimental results concerning the characteristics, behavior, and excitation thresholds of ducts induced by extraordinary (X-mode) polarized high-power HF radio waves emitted towards the magnetic zenith (MZ) into the upper ionosphere at EISCAT (European Incoherent SCATter). The features and behavior of ducts were diagnosed by the EISCAT incoherent scatter radar (ISR) at Tromsø and the CUTLASS (SuperDARN) Finland radar at Hankasalmi. The state of the ionosphere was monitored by the Dynasonde in Tromsø. It was found that the electron density Ne enhancements inside ducts were of 50–80% above the background Ne values and their transverse size (normal to the magnetic flux tube) corresponded to about 3–4° in the north–south direction. They were generated during magnetically quiet periods and extended from ~300 to 320 km up to the upper altitude limit of the EISCAT radar measurements (600–700 km), when heater frequencies were both below and above the critical frequency of the F2 layer (fH ≤ foF2 and fH > foF2), regardless of whether HF-induced plasma and ion lines were generated or not. Comparing the O-/X-mode effects from the EISCAT radar observations, it was shown that the creation of the strong Ne ducts is a typical characteristic of the X-mode pulses. As a rule, electron density enhancements were not observed during O-mode pulses. A plausible mechanism for the creation of X-mode artificial ducts is discussed.
1. Introduction
Ducts (field-aligned plasma density enhancements) provide a link into the magnetosphere and can guide whistler waves along the geomagnetic field. Whistler waves are generated by very low frequency (VLF) transmitters or lightning discharges [1,2,3,4]. They can efficiently precipitate energetic particles from the magnetosphere into the ionosphere by scattering high-energy electrons into the loss cone via cyclotron resonance [5]. The controlled radiation of VLF waves into the magnetosphere can significantly reduce the lifetime of high-energy electrons. Hence, VLF whistler mode waves can be used to remediate enhancements of relativistic electrons from radiation belts, both those naturally occurring due to extreme space weather events and those of anthropogenic origin, for example, those due to high-altitude nuclear explosions [6].
The most efficient transport of VLF wave energy occurs if the whistler is guided along the magnetic field by a field-aligned plasma density enhancement (duct); that is, where inside the duct the plasma density is higher than the ambient density [7,8,9,10]. Whistler waves guided by such ducts into the magnetosphere are known to play an important role on radiation belt dynamics [7,8]. Within ducts, the wave–particle interactions, which lead to the acceleration and precipitation of particles into the ionosphere, occur efficiently; therefore, their presence contributes to the remediation of energetic particles from the magnetosphere and, consequently, affects magnetosphere–ionosphere interactions and energy [10]. Ducts can exist in natural conditions, especially during magnetic storms and sub-storms, and can be created artificially.
One of the known effective methods for creating artificial ducts is heating of the ionosphere with ordinary (O-mode) polarized powerful HF radio waves (pump waves). The most efficient interaction between O-mode HF pump waves and ionosphere plasma occurs at the reflection altitude and upper hybrid resonance height, giving rise the generation of various phenomena in the ionosphere’s F-region [11,12,13,14]. The main mechanism for creating artificial ducts involves the modification of the ionosphere via the O-mode HF pump waves. This leads to strong increases of the electron temperature Te in the F region of the ionosphere. The bulk of the increased Te produces a pressure gradient pushing plasma along the magnetic flux tube [15,16]. Ducts in the top of the ionosphere during ionosphere modification via the O-mode HF pump waves were studied aboard satellites (see, for example, [15,16,17,18,19,20]).
Results of systematic studies of artificial ducts over the HAARP facility aboard the DMSP and DEMETER satellites at altitudes of 660 and 840 km, respectively, are reported and summarized [15,16,17]. They are based on HAARP experiments in which HF pump waves with O polarization were emitted at various frequencies during quiet and disturbed magnetic conditions. It was found that the relative ion density perturbations (for O+ ions) in the ducts over HAARP were typically 15–40% in the late evening, while those in the morning and daytime hours were only 3–13% [17]. Moreover, ducts were created most efficiently at heater frequencies near the maximum plasma frequency foF2 and the second harmonic of the electron gyro-frequency [17]. A model developed by Milikh et al. [21] could explain some experimental observations and help with choosing optimal pump frequencies and duration of pump pulses for artificial duct formation.
During O-mode HF heating experiments at the Heater facility in Tromsø, artificial ion upflows (O+ ions) from the ionosphere were detected and investigated by the EISCAT ISR [22,23,24,25] and aboard DMSP satellites [15,16,18].
Observations of plasma features in the top middle latitude of the ionosphere from aboard the DEMETER and DMSP satellites revealed the creation of ducts (plasma density enhancements) via high-power O-polarized HF radio waves radiated from the Sura heating facility near N. Novgorod (Russia) into the ionosphere F-region at the pump frequencies of fH < foF2 [24,25]. The most intense ion density (for O+ ions) enhancements of up to 20–40% were generated in the late evening, while those in the morning hours were only 2–5% [19]. The electron density enhancements were weaker, as compared with the ion density ducts, and did not exceed 15–20% in the late evening. In the daytime, with O-mode HF heating at frequencies of fH < foF2, ducts were not generated [25].
Until now, studies of artificial ducts (field-aligned plasma density enhancements) have been limited to the use of high-power HF pump waves with O polarization. The reflection height of extraordinary (X-mode) polarized pump waves is below both the upper hybrid altitude and the reflection height of the O-mode HF pump waves. Hence, it does not reach the resonant heights where Langmuir and upper-hybrid waves exist [11,12,26].
However, a variety of phenomena excited by X-mode high-power HF radio waves in the high-latitude upper (F-region) ionosphere, which were thought to be impossible, have been found for the first time by scientists from AARI in recent years. Among them are artificial field-aligned irregularities [27,28], HF-induced optical emissions [29], Langmuir and ion acoustic plasma waves [30,31], and narrowband stimulated electromagnetic emission [32].
This paper examines new issues related to the creation of artificial ducts (field-aligned electron density enhancements) in the high-latitude upper ionosphere induced by X-mode HF pump waves radiated from the EISCAT/Heating facility. The features and behaviors of ducts were diagnosed via the EISCAT UHF radar and the CUTLASS Finland radar. We investigate, in detail, the duct features, including their intensity, spatial scale, and their relation to artificial field-aligned irregularities. Next, X- and O-mode phenomena are compared under identical background conditions. Finally, the thresholds (minimum electric fields) required for the excitation of ducts due to X-mode HF pumping are determined.
2. Experimental Arrangement
The creation of artificial ducts (field-aligned electron density enhancements) in the high-latitude upper ionosphere was achieved by the EISCAT HF Heating facility (69.6° N, 19.2° E) located near Tromsø, Norway [33]. The results of numerous Russian experiments, conducted at the EISCAT/Heating facility, were used for this investigation.
In all experiments, the high-power high-frequency (HF) radio waves (pump waves) were injected from the ground into the near-Earth space environment along the magnetic field line (12° south from vertical) at frequencies fH both below and above the critical frequency of the F2 layer (fH ≤ foF2 and fH > foF2). The magnetic zenith (MZ) at Tromsø corresponds to an elevation of 78° (12° south from vertical). Experiments have been conducted during magnetically quiet periods. The HF Array 1 with a beamwidth of 5–6° (at −3 dB level), operating in the frequency range fH = 5.423–7.953 MHz, was used. The effective radiated power (ERP) changed in various experiments from 450 to 840 MW.
On 18 February 2012 and 12 October 2011, extraordinary (X-mode) polarized powerful HF radio waves were radiated at fixed frequencies of 6.2 and 7.953 MHz, respectively, with a transmission scheme of 10 min on and 5 min off. On 20 and 28 October 2013 and 3 November 2013, an alternating injection of ordinary (O-mode) and extraordinary (X-mode) polarized HF pump waves was produced at fH of 6.2 and 7.953 MHz in cycles of 5 min on, 2.5 min off, 20 min on, and 10 min off and 10 min on and 5 min off, respectively. On 31 October 2015 and 26 October 2021, the X-mode HF power-stepping experiments were performed at heater frequencies of 7.1 and 6.77 MHz, respectively, with 2 min power steps in the sequence of 10, 25, 50, 75, 100, 100, 75, 50, 25, and 10% of the maximum effective radiated power.
The EISCAT UHF incoherent scatter radar running at 930 MHz (further down the ISR) [34], located in close proximity to the EISCAT/Heating facility at Tromsø, was utilized for observations of HF-induced phenomena over a wide range of heights from 80 to 700 km. The ISRs measure the total returned power and frequency spectrum of the received signal. Based on the theory of incoherent scattering (ref. [35,36] and references therein), the frequency spectrum of the received signal provides information about electron density Ne, electron and ion temperatures (Te and Ti), ion mass, and plasma velocity Vi. The total returned power depends on the number of electrons and gives an estimate of the ionospheric electron density. The width of the spectrum depends on the ratio of the ion temperature to the ion mass, and the overall shift of the spectrum corresponds to the bulk drift motion of the ions (the plasma velocity). The shape of the ion line spectrum is a sensitive function of the ratio of the electron and ion temperatures. The offset frequencies of the upshifted and downshifted plasma lines were also determined by the electron density. In the course of the HF pumping experiments, the ISR provided investigations of elongated plasma waves such as Langmuir (L) and ion-acoustic (IA) plasma waves. These were evidenced directly from the ISR frequency spectra as HF-enhanced plasma (HFPL) and ion (HFIL) lines. Therefore, the occurrence of HFPL and HFIL in the ISR spectra indicates the excitation of Langmuir and ion-acoustic plasma waves induced by HF pumping in the high-latitude ionosphere F-region.
The processing and display of the ISR data was implemented using GUISDAP (The Grand Unified Incoherent Scatter Design and Analysis Package) software [37] using “beata” code with an altitude resolution of 3 (1.7) km and an integration time of 5, 10, 20 and 30 s in different experiments. The reliability of determining the plasma parameters was controlled by the value of the Residual parameter R ≤ 2 [37]. The residual shows how well the measured spectra agree with the theoretical spectra for a Maxwellian plasma.
In most experiments, the ISR ran in the magnetic field alignment pointing in a fixed azimuth direction of 186 degrees (south). However, in some experiments, to determine the transverse size of ducts, stepping ISR elevation angles were applied in the following sequence: 74–76–77–78–79–80–82–84–86–90° (2 min for each angle).
Artificial field-aligned irregularities (AFAIs) were probed by the CUTLASS (SuperDARN) Finland radar [38] at Hankasalmi (62.3°N; 26.6°E) located ~1000 km south of the EISCAT/Heating. The CUTLASS radar ran beam 5 centered over the EISCAT/Heating simultaneously at several frequencies in a range from 10 to 20 MHz. Due to the Bragg scatter condition, CUTLASS can detect irregularities with a spatial scale perpendicular to the magnetic field l⊥ ≈ 7.5–15 m (l⊥ = c/2frad, where c is the velocity of light and frad is the CUTLASS frequency). A time resolution of 3 s and a 15 km range gate were utilized. The first gate started from a range of 480 km. The CUTLASS run modes were identical to those utilized in [29].
The state of the ionosphere during the experiments was monitored by the Dynasonde at Tromsø. The viewing geometry is schematically shown in Figure 1.
3. Observational Results
3.1. Characteristics of Artificial Ducts Created via X-Mode HF Pump Waves
Below we consider experimental results concerning the distinctive characteristics of ducts (field-aligned electron density enhancements) created via X-mode HF pump waves radiated from the EISCAT/Heating facility into the near-Earth space environment towards the MZ.
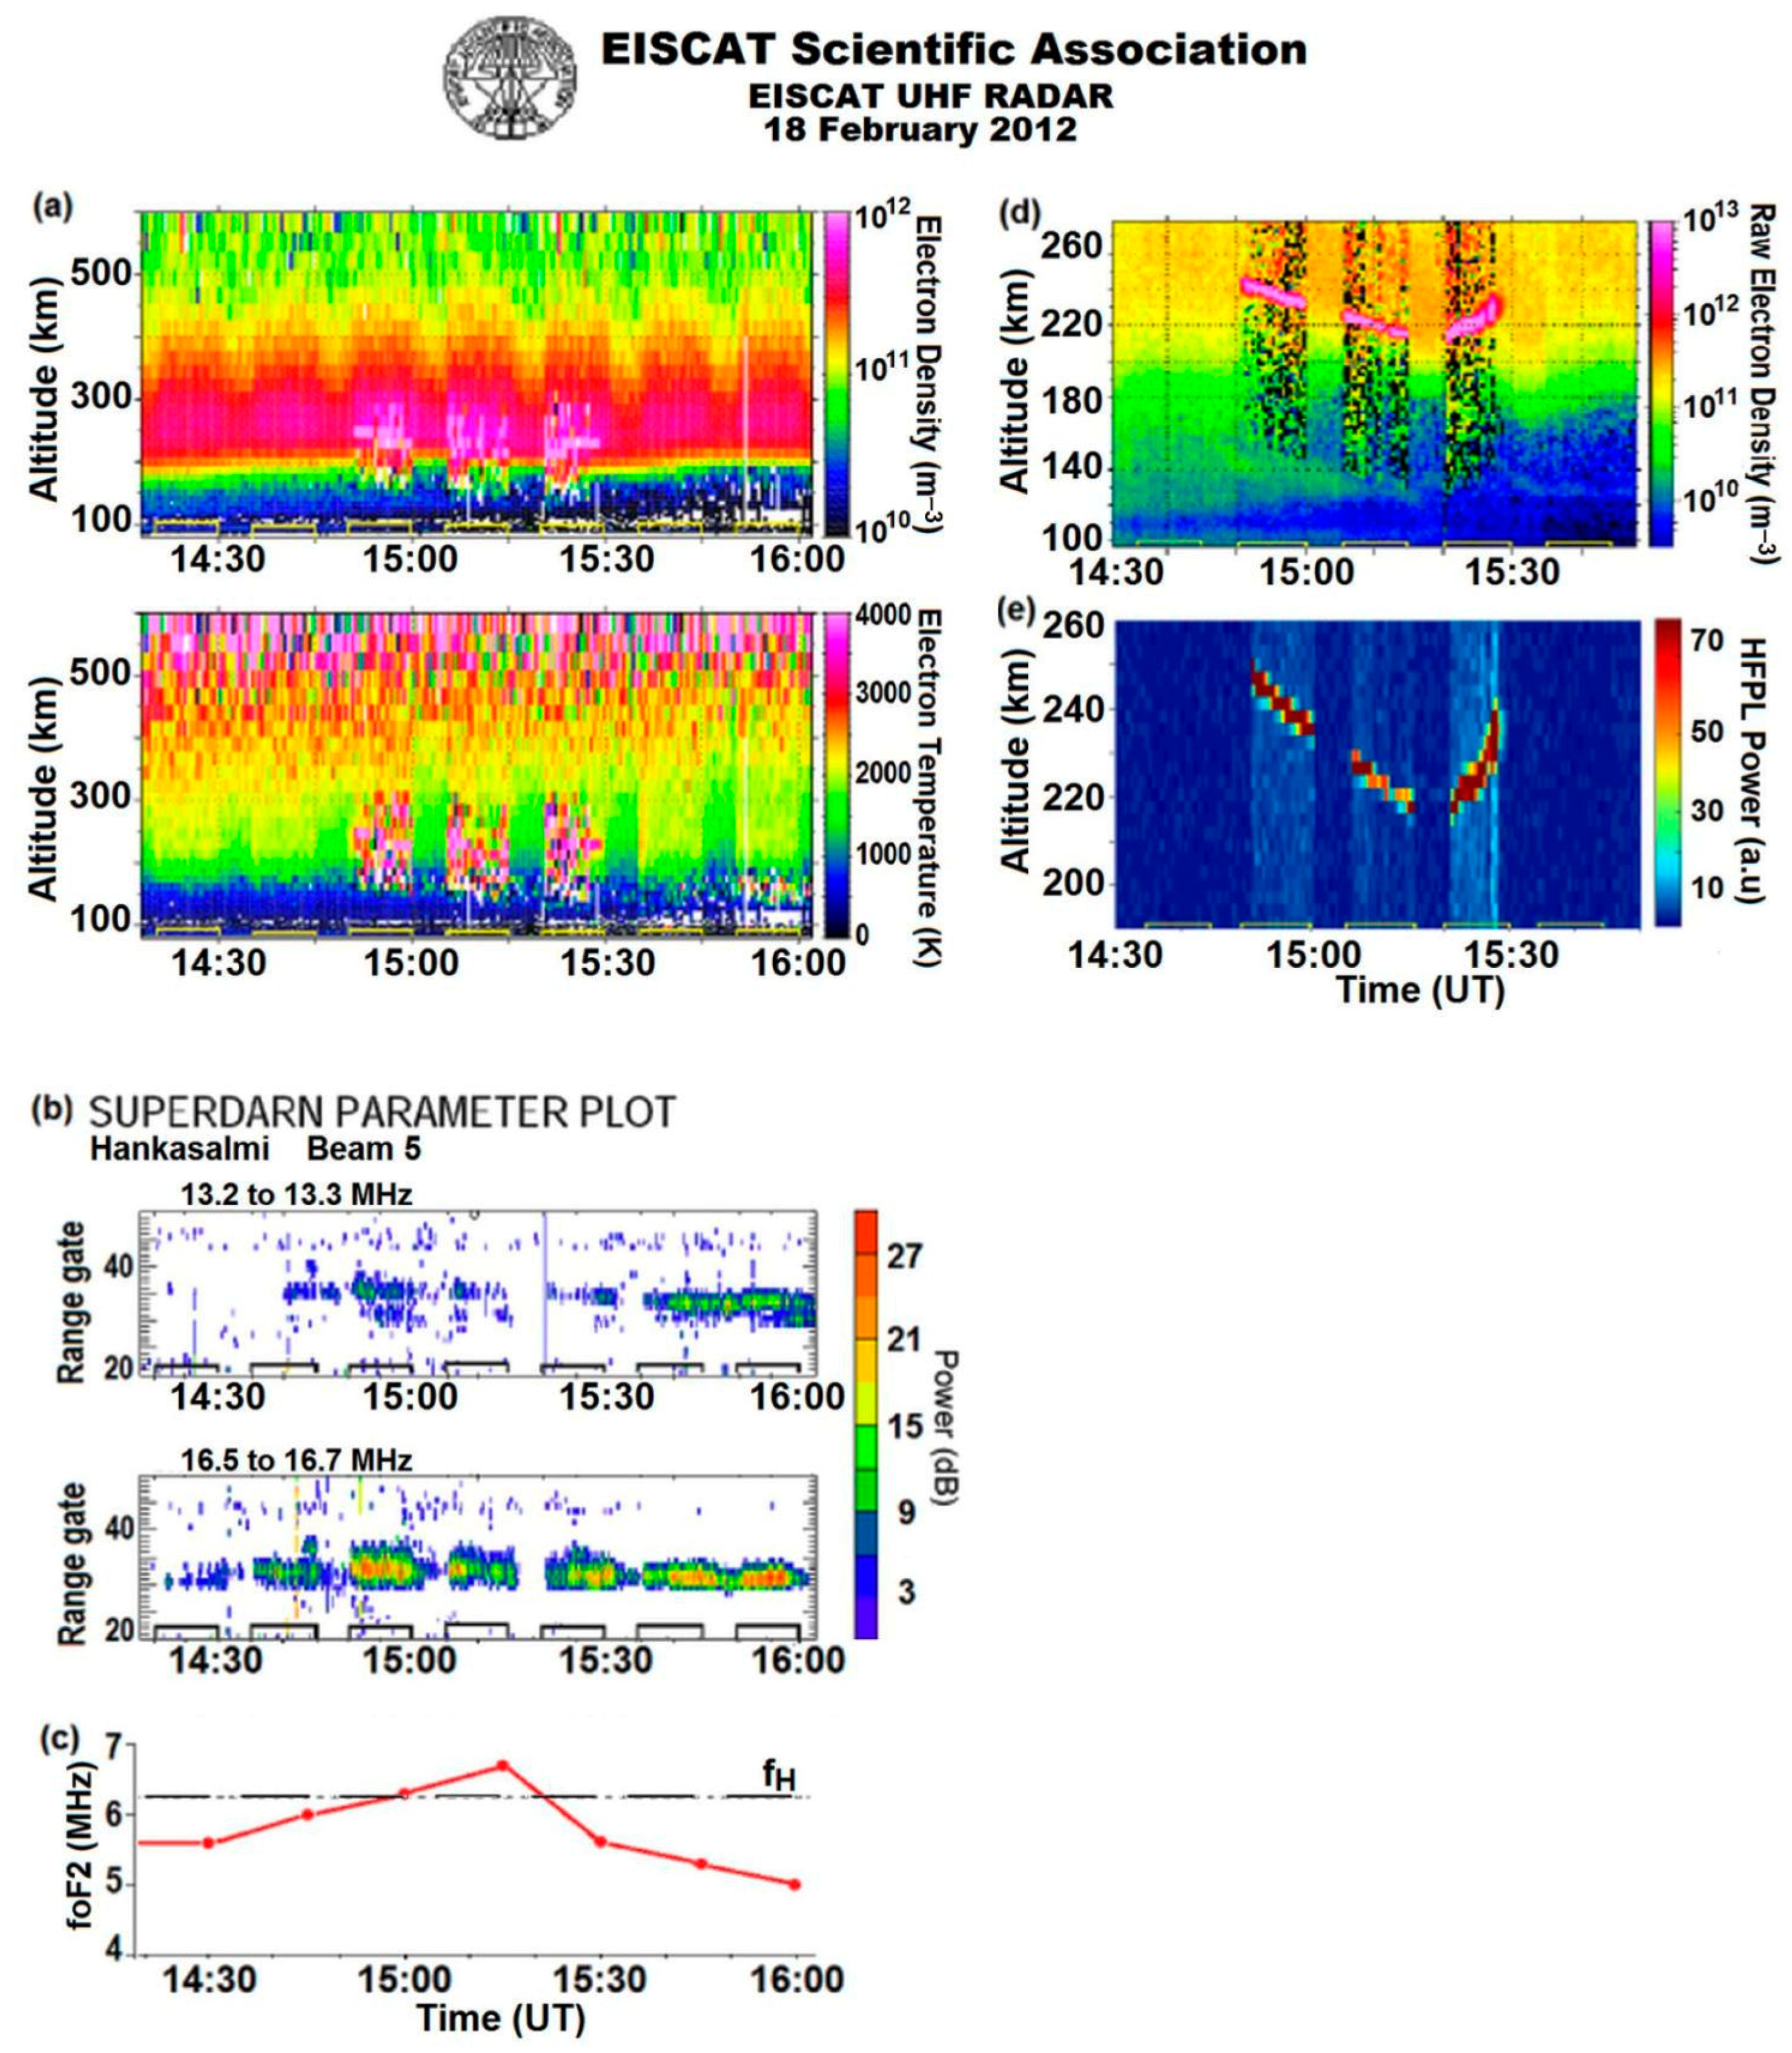
Figure 2 shows the observational results obtained by the ISR, CUTLASS Finland radar, and Dynasonde during the X-mode heating experiment on 18 February 2012, when the pump wave was injected at fH = 6.2 MHz towards the MZ under effective radiated power ERP = 512 MW.
There is evidence in Figure 2 that field-aligned Ne enhancements by 50–70% relative to background values occurred from ~300 km up to ~550 km during all heater-on pulses. They were accompanied by not-too-strong Te increases due to Ohmic electron heating. It is important that Ne ducts were generated when heater frequencies were both below and above the maximum plasma frequency of the F2 layer (fH ≤ foF2 or fH > foF2) regardless of whether the HFPL and HFIL were excited or not. The occurrence of Ne ducts was accompanied by the excitation of AFAIs. Backscatter from AFAIs was observed by the CUTLASS (SuperDARN) radar at frequencies of ~13.2 and 16.5 MHz (see Figure 2b), which corresponds to the AFAI spatial size across the geomagnetic field l⊥ ≈ 11.4 and 9.1 m (l⊥ = c/2frad, where c is the velocity of light and frad is the CUTLASS operational frequency). A distinctive feature in the behavior of ducts and AFAIs is their independence from the generation of the HFPL and HFIL. Comparing panels (a), (b), and (d) in Figure 2, it is evident that the generation of Ne ducts and AFAIs occurred independently of the excitation of HF-induced plasma and ion lines. Note that the presence of HFIL in ISR spectra during the heater-on pulses of 14:50–15:00, 15:05–15:15, and 15:20–15:30 UT does not allow for the use of standard radar spectrum analysis in order to obtain reliable estimates of the electron density Ne and temperature Te in the range of heights occupied by the HFILs. At heights above 300 km, in which HFILs were not observed, the Ne values were the same as in heating pulses in the absence of HFILs (for example, compare the pump pulses at 14:35–14:45 UT and 14:50–15:00 UT in Figure 2).
Further, we analyze the development in time-based Ne enhancements after turning the HF heating facility on and off. For this purpose, we considered an ISR analysis with a 5 s integration time of the electron density Ne in a wide range of heights obtained during X-mode experiments at fH = 6.2 and 7.953 MHz. Figure 3 depicts the temporal evolution of field-aligned Ne enhancements after the onset of X-mode heating on 18 February 2012 and 12 October 2011. Note that in these events HFPLs and HFILs were not observed.
As can be seen, Ne enhancements began after turning on the EISCAT/Heating facility and reached saturation after 50–60 s. The decay time of the Ne enhancements was about 2–5 min after the EISCAT/Heating was switched off.
3.2. Comparison of the X- and O-Mode Phenomena in Identical Background Conditions
The comparison of phenomena induced by the O- and X-mode HF pump waves in identical background conditions has been of interest. Such a comparison was made for alternating O-/X-mode experiments on 20 and 28 October 2013 and 3 November 2013.
Figure 4 shows the EISCAT ISR observations during the experiment on 20 October 2013 from 13 to 13:30 UT. Alternating O-/X-mode HF pumping was produced under quiet geophysical conditions with pulses of 5 min on and 2.5 min off at frequencies of 6.2 and 7.953 MHz. The critical frequency of the F2 layer during the experiment was within 9.5–9.8 MHz. Therefore, the heater frequencies fH were less than the foF2 (fH < foF2). The ERP were of 560 MW and 840 MW at pump frequencies of 6.2 and 7.953 MHz, respectively.
Figure 4 demonstrates that during O-mode pulses, strong Te increases of up to 3000–3500 K occurred. Such Te increases are typical for O-mode HF heating at frequencies of less than the maximum plasma frequency foF2 (see, for example, [22]). The electron heating was accompanied by the occurrence of HFPLs and HFILs that indicate the development of parametric decay instability (PDI) [13,14,26]. Note that at fH = 6.2 MHz, the PDI was only generated as an immediate response to turning on the EISCAT/Heating facility. However, an O-mode heating at a frequency of 7.953 MHz produced the re-appearance of the HFILDOWN and HFILUP, which existed throughout the whole pump pulse. Similar behavior also occurred in other EISCAT O-mode pumping experiments [30,31].
In contrast to this, during X-mode heating, large Ne enhancements accompanied by not-too-strong Te increases were observed. This is a typical behavior of plasma parameters during X-mode pumping [30,31]. As follows from Figure 4, HFILs occurred both at a frequency of 6.2 MHz and at 7.9 MHz and were more intense compared to the O-mode HFILs. Figure 5 demonstrates the behavior of Ne enhancements and intensities of HFILDOWN, HFIL0, and HFILUP at fixed altitudes during the course of X-mode HF heating at fH = 6.2 and 7.953 MHz on 20 October 2013.
As evident in Figure 4 and Figure 5, the “zero” component was observed in ISR spectra, which is a typical manifestation of oscillating two-stream instability (OTSI) [13,14,26]. As can be seen from Figure 5, Ne enhancements began from ~300 km, which is well above the X-mode reflection altitude, and extended up to altitudes of ~550 km. Similar to the events of 18 February 2012 and 12 October 2011, the growth time of the Ne enhancements was about 50–60 s and their decay time exceeded 2 min after the EISCAT/Heating was switched off.
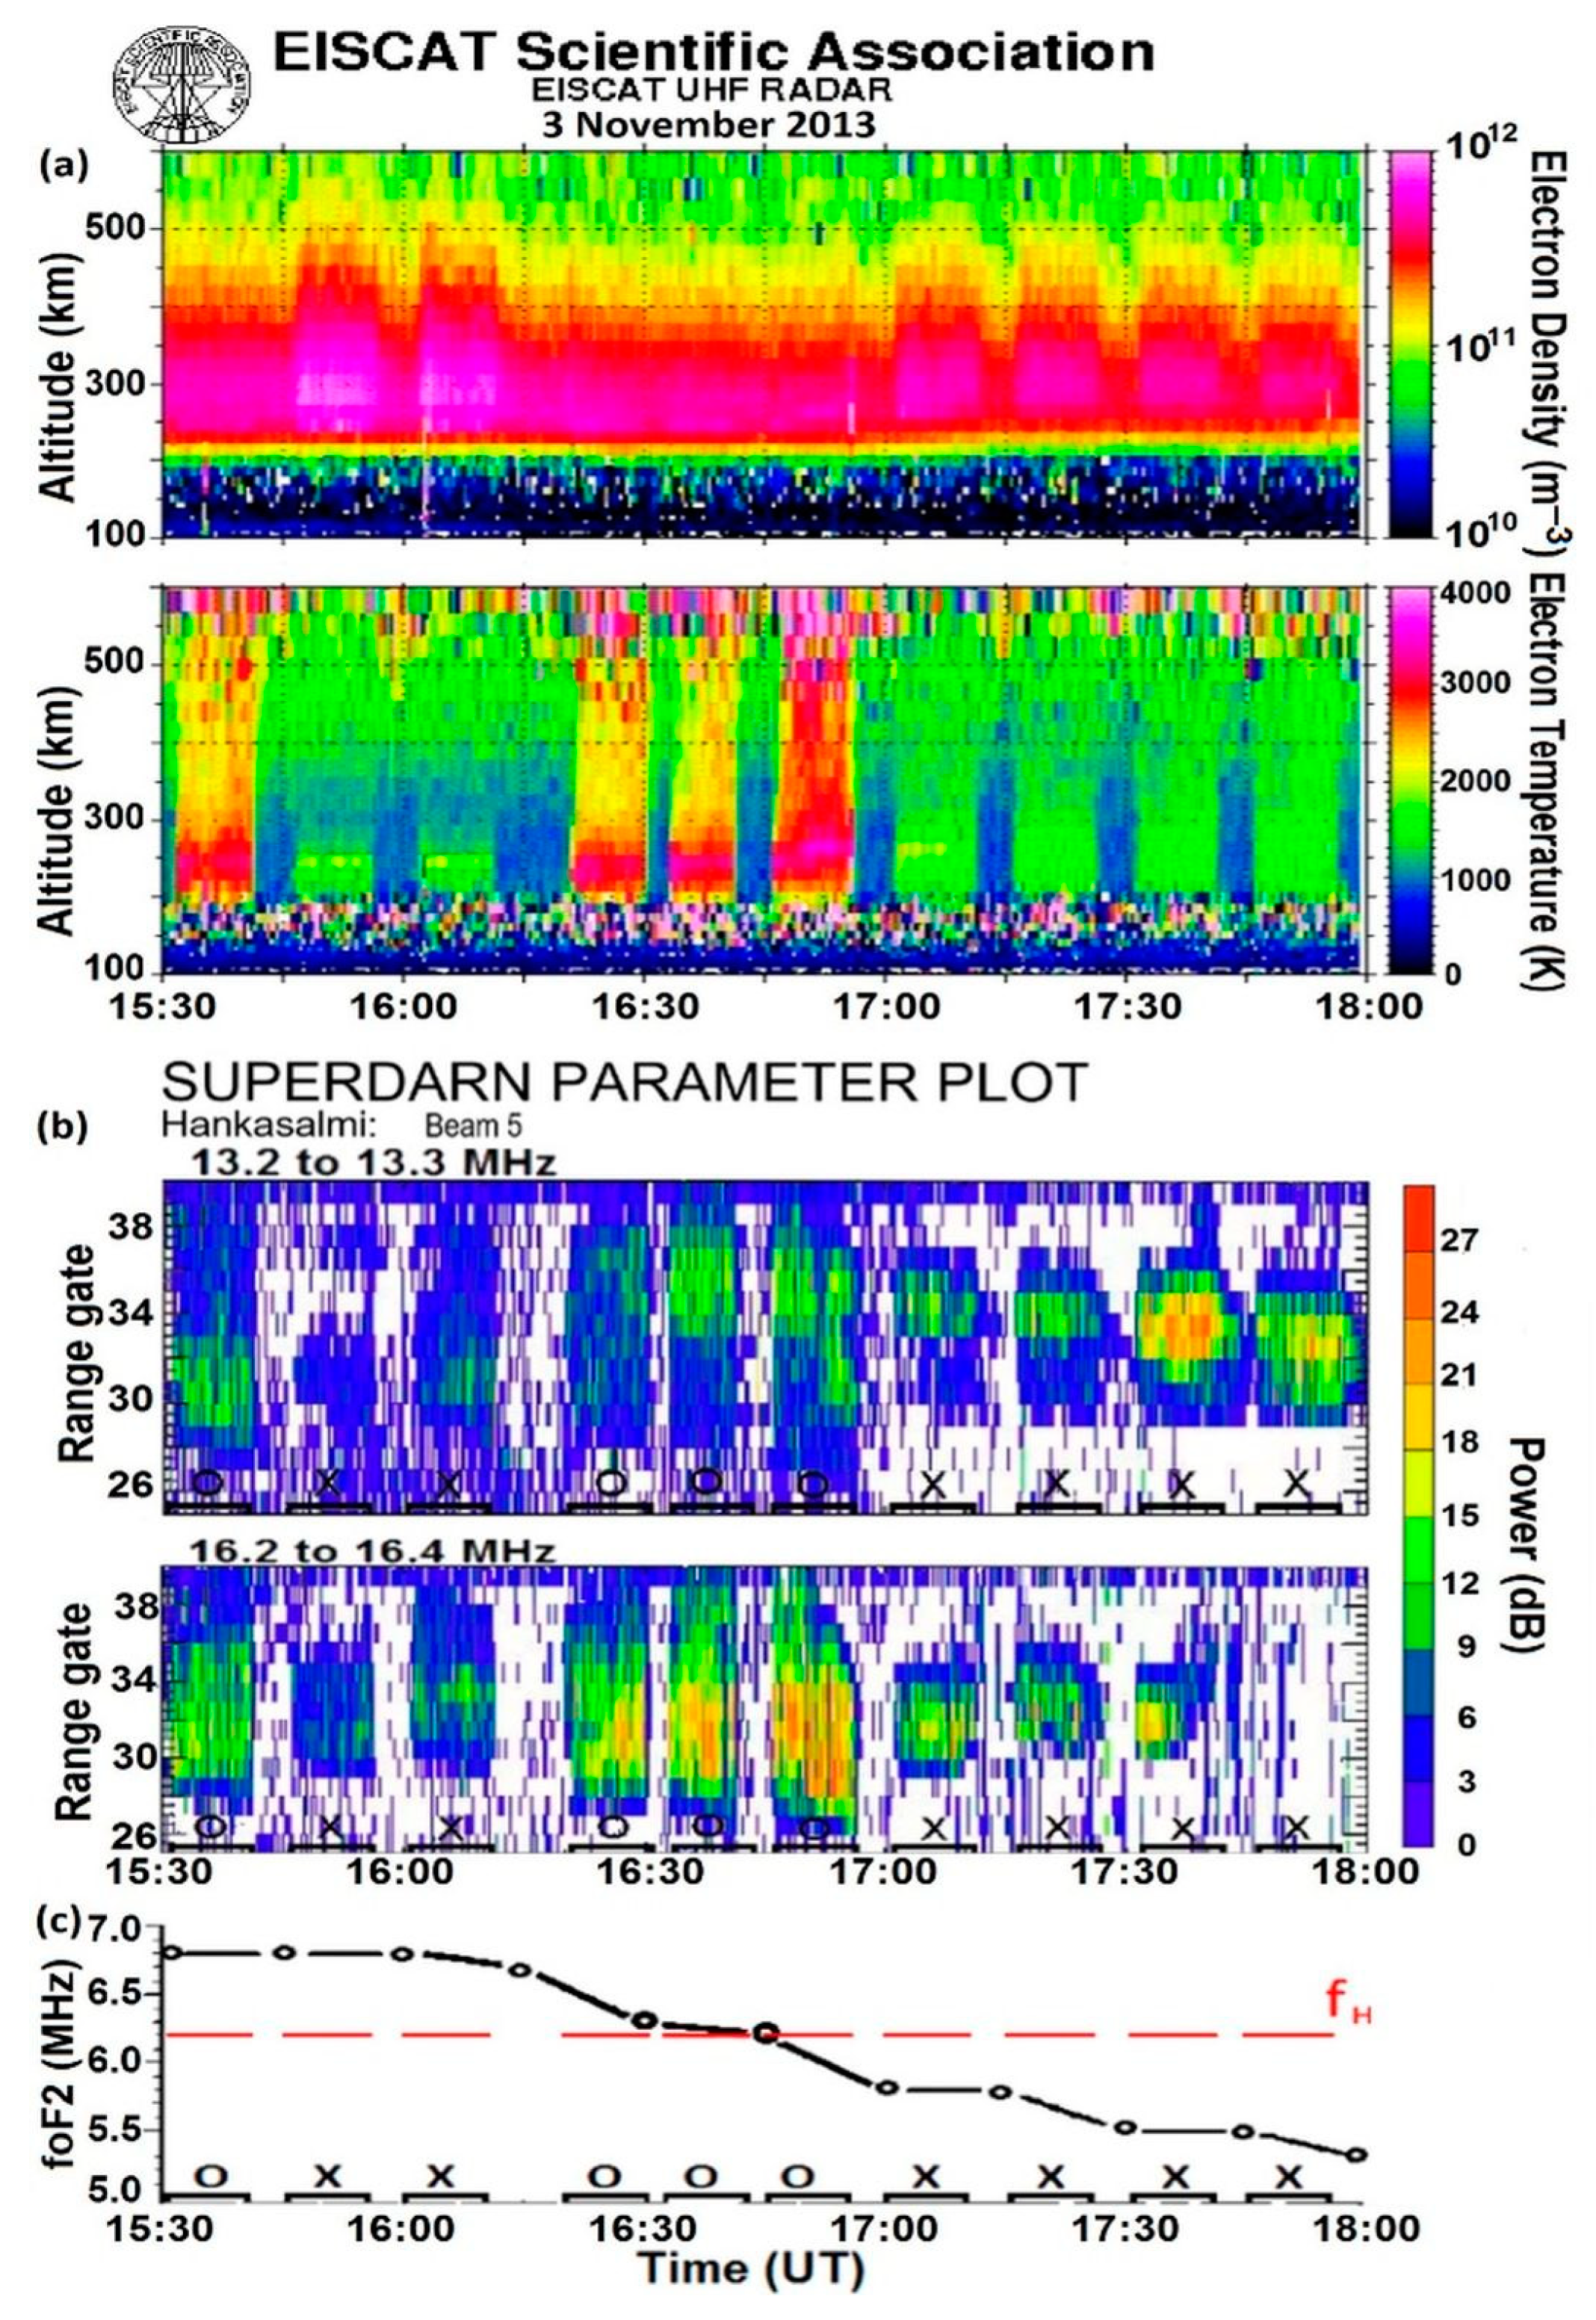
Figure 6 demonstrates observational results obtained by the ISR, CUTLASS Finland radar, and Dynasonde during an alternating O-/X-mode experiment on 3 November 2013 from 15:30 to 18:00 UT when the pump wave was injected at fH = 6.2 MHz towards the MZ at ERP = 450 MW. In the course of the experiment, the ratio of the heater frequency of 6.2 MHz to the maximum plasma frequency foF2 changed from 0.92 to 1.2. This allows for the investigation and comparison of the behavior of Ne, Te, and AFAIs caused by X- and O-mode HF heating at frequencies both below and above foF2.
As can be seen from Figure 6, during the alternating O-/X-mode heating from 15:30 to 17:00 UT, phenomena induced by both the O- and X-mode pump waves can be excited due to the fH ≤ foF2. In such conditions, an O-mode heating led to strong Te increases up to 3000 K, accompanied by the excitation of intense AFAIs with the scale perpendicular to the magnetic field l⊥ ≈ 11.4 and 9.1 m. Note that in three consecutive heater-on pulses between 16:15 and 17 UT, weak Ne enhancements were observed during O-mode HF pumping when the pump frequency was very close to the critical frequency of the F2 layer (fH~foF2). In the course of O-mode HF pumping at fH < foF2, Ne enhancements were not observed at all. This is clearly shown in Figure 4 when O-mode HF heating was produced at frequencies 6.2 and 7.953 under fH/foF2 = 0.65 and 0.83, respectively.
In the course of the X-mode heating, large field-aligned Ne increases by 60–80% relative to the background values were observed. They extended along the magnetic field up to the upper altitude limit of the ISR measurements. Such Ne behavior is typical for all X-mode heating events. In contrast to the O-mode experiments, the Te increases were similar to the Te values from other X-mode experiments and did not exceed the background values by more than 20–25%.
Despite the fact that AFAIs were generated both during O- and X-mode heating for the conditions of fH ≤ foF2, the power of the X-mode AFAIs was ~6–9 dB lower compared to the O-mode AFAIs. It is important to emphasize that the size of the artificially perturbed region occupied by AFAIs was much larger when observed with O-heating than with X-heating and reached an extension of 90–105 km (6–7 gates between 28–35 range gates) from the CUTLASS measurements (see Figure 6b). In the same conditions, the size of the perturbed region with X-mode AFAIs had an extension of only 45 km (3 gates between 30–33 range gates).
From 17 to 18 UT, when the heater frequency exceeded the critical frequency (fH > foF2), only X-mode HF pumping was carried out. In such conditions, the Te values increased by 50% above the background level. The backscatter from the AFAIs enhanced and the extension of the perturbed region with AFAIs reached ~60 km.
Results from the EISCAT ISR measurements have demonstrated that creating strong Ne ducts is a phenomenon typical for X-mode pulses, while during O-mode pulses the Ne enhancements did not usually occur. Let us emphasize again that Ne ducts induced by X-mode HF pumping were created at pump frequencies both below and above the foF2. Along with this, we should note that there are some specific conditions during which field-aligned Ne enhancements can be excited during O-mode heating. Experimental results obtained at the EISCAT HF heating facility have shown that Ne enhancements occurred when the frequency of the ordinary polarized HF pump wave was close to the electron gyro-harmonics and/or to the maximum plasma frequency of the F2 layer [39,40,41].
The important feature of the artificial ducts (field-aligned electron density enhancements) is their transverse size. EISCAT ISR measurements in elevation angle stepping mode make it possible to estimate the width of ducts. Let us consider the results obtained during the elevation angle stepping experiment on 28 October 2015. In the course of the experiment, the EISCAT HF Heating facility radiated continuously for 20 min towards the magnetic zenith (12° south from vertical) at the pump frequency of 7.953 MHz by using the HF Array 1 with a beamwidth of about 6°. The duct reached saturation after 50–60 s and then it existed continuously throughout the whole 20 min heater-on cycle. The EISCAT ISR (930 MHz) with a beamwidth of 0.6° in angle stepping mode was used to investigate the fine structure of the plasma parameters inside the HF-illuminated ionosphere. During a 20 min heater-on pulse, the ISR elevation angles changed in the following sequence: 74–76–77–78–79–80–82–84–86–90° (2 min at each angle). At the same time, the ISR operated in a fixed azimuth direction of 186 degrees (south).
Figure 7 shows altitude–time plots of the electron density Ne and temperature Te of the ISR analysis with a 20 s integration time on 28 October 2013 during alternating X-/O-mode heating at fH = 7.953 MHz in pulses of 20 min on and 10 min off. The experiment was carried out during magnetically quiet periods when the heater frequency was less than the critical frequency of the F2 layer (fH < foF2). During the 20 min heater-on cycle, the ISR operated in elevation angle stepping mode from 74° to 90°.
As is evident from Figure 7, in the course of the X-mode heater-on cycle from 13:01 to 13:21 UT, the largest Ne enhancements of about 50% above the background Ne values were observed within the ISR elevation angles of 77–79°. The field-aligned pointed ISR at Tromsø corresponds to 78°. The duct extended along the local magnetic flux tube from ~260 to 500 km and its transverse size (normal to the magnetic flux tube) corresponds to 3° in the north–south direction. Thus, for example, at the altitude of 300 km, it corresponds to the transverse size of the duct of ~16 km, which is ~two times less than a beamwidth of the HF Array 1 of the HF heating facility utilized in the experiments. Te increases of about 30% were also observed within 77–79° of the ISR elevation angles.
During the O-mode heater-on cycle from 13:31 to 13:51 UT, strong Te increases up to 3000 K (200% above background values) occurred within the ISR elevation angles of 76–82°, which corresponds to the beamwidth of the HF Array 1. Therefore, the increase of the Te during the O-mode HF heating was observed in a region which is two times wider than the transverse size of the Ne duct in the course of X-mode pumping. As in all previous O-mode pump pulses, Ne enhancements were not observed.
In the course of the experiment, the backscatter from the AFAIs was observed by the CUTLASS (SuperDARN) radar at frequencies of ~16, 18, and 20 MHz, which corresponds to the AFAI size perpendicular to the magnetic field of l⊥ ≈ 9.4, 8.3 and 7.5 m, respectively (see Figure 8).
As seen in Figure 8, the power of the CUTLASS radar backscatter during X-mode HF pumping was less when compared to the O-mode backscatter. It is important to emphasize that the size of the artificially perturbed region occupied by the X-mode AFAIs was ~15–30 km (1–2 range gates between 30–32 gates), while the horizontal extent of the patch occupied by the O-mode AFAIs reached 45–60 km (3–4 range gates between 29–33 gates). Note that the analogous behavior of the O- and X-mode AFAIs was also observed on 3 November 2013 from 15:30 to 17 UT when fH was below foF2 (see Figure 6).
3.3. Experimental Thresholds of Excitation of Electron Density Ducts
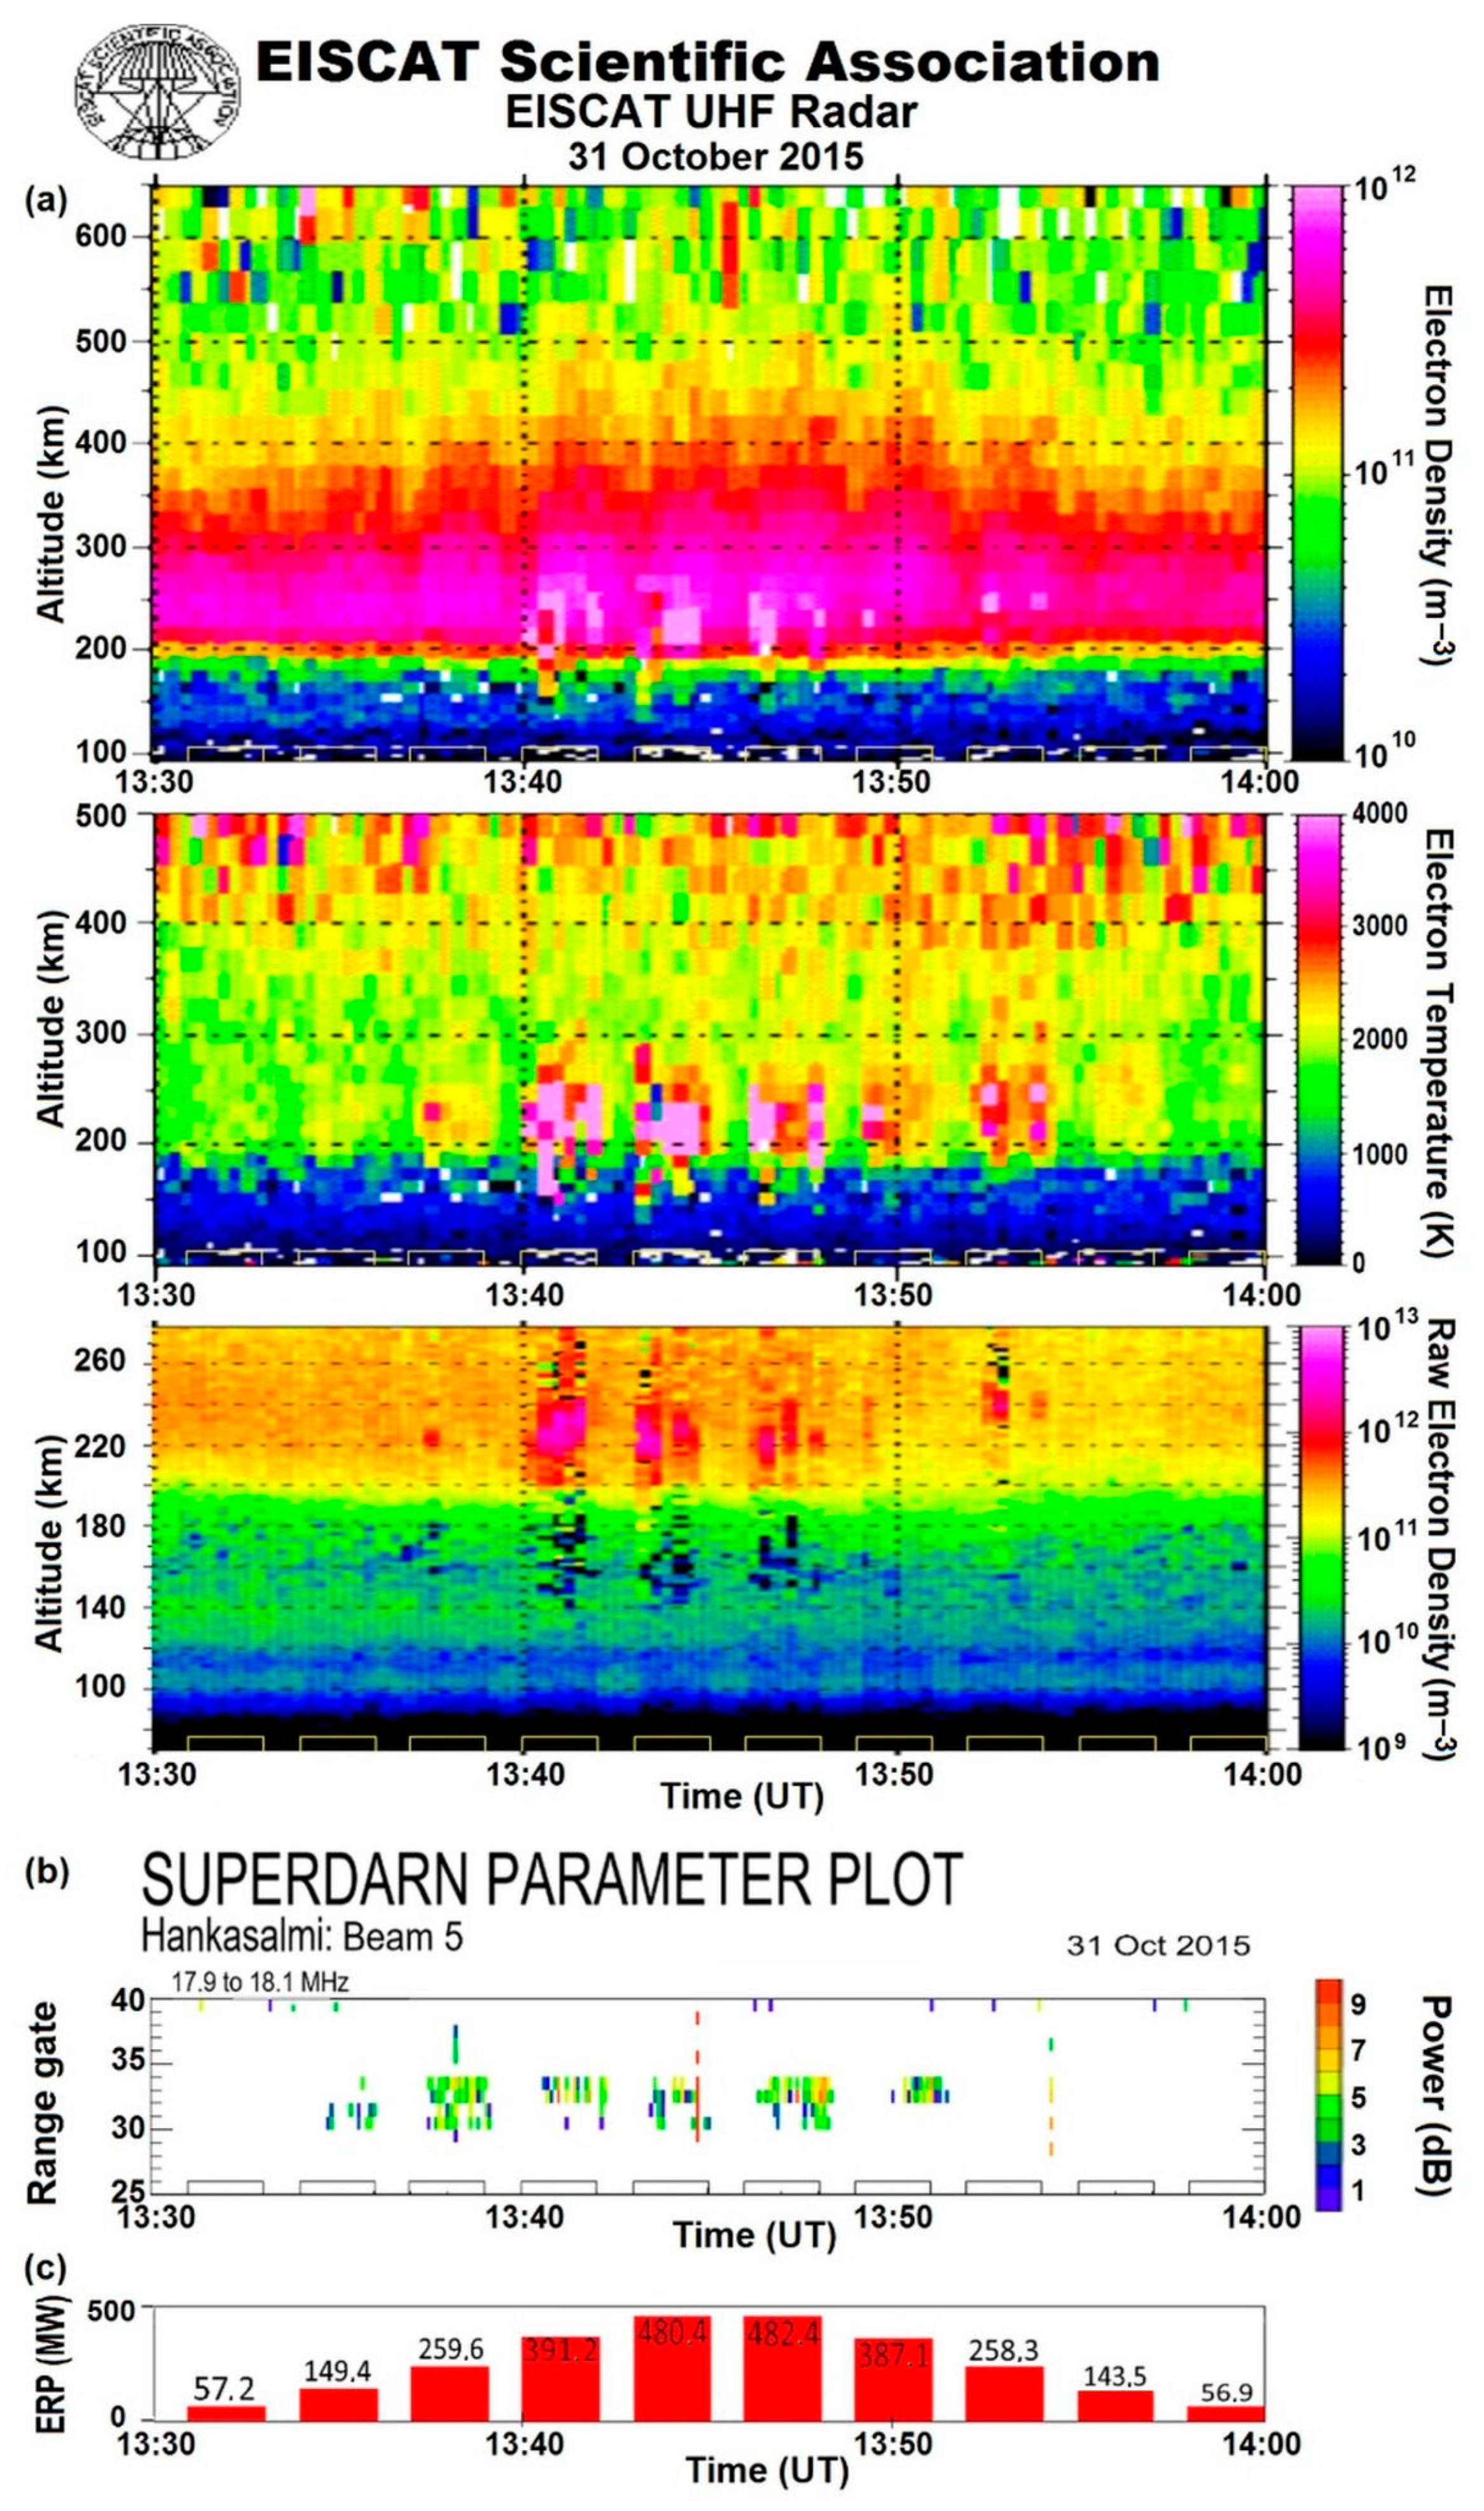
HF power-stepping experiments at the EISCAT/Heating facility make it possible to determine the excitation thresholds of artificial ducts (field-aligned Ne enhancements) in the high-latitude upper ionosphere caused by X-mode HF pump waves. We examined the results of two X-mode HF power-stepping experiments conducted on 31 October 2015 from 13:30 to 14 UT and on 26 October 2021 from 13:20 to 14 UT. On 31 October 2015, X-mode HF heating was produced towards the MZ at the pump frequency of 7.1 MHz in 2 min on and 1 min off cycles. From cycle to cycle, the ERP was approximately changed in the following sequence: 10, 25, 50, 75, 100, 100, 75, 50, 25, and 10% from the maximum effective radiated power. During the experiments, the maximum plasma frequency foF2 dropped from 6.6 to 5.8 MHz due to the fH being above foF2 (fH > foF2). As a reminder, contrary to the phenomena induced by the O-mode HF heating, the X-mode effects may be excited when the heater frequencies were both below and above the maximum plasma frequency of the F2 layer (fH ≤ foF2 and fH > foF2). Figure 9 presents the observational results obtained during the X-mode HF power-stepping experiment on 31 October 2015.
As seen from Figure 9, the electron density enhancements Ne accompanied by not-too-strong Te increases due to Ohmic heating occurred in the first power step from 13:31 to 13:33 UT when ERP was 57.2 MW. AFAIs appeared in the next power step from 13:34 to 13:36 UT when ERP was 149.4 MW. The coherent backscatter from the EISCAT ISR leading to the enhanced ion line spectra (HF-enhanced ion lines—HFIL) was observed in the pulse from 13:40 to 13:42 UT when ERP reached 391.1 MW. Recall that in the range of altitudes where the HFILs are observed, correct estimates of the Ne and Te cannot be obtained. During the experiment, the strong ISR backscatter (labeled as the raw electron density) occurred at an altitude range from ~190 to 240 km in heater-on pulses between 13:40 and 13:50 UT at the highest ERP. However, above these heights the actual values of the Ne and Te are determined from the IST analysis. Comparing the behavior of Ne enhancements, AFAIs, and HFILs, it is clearly shown that the excitation of Ne enhancements required the minimum ERP in the comparison with the ERP needed to excite AFAIs and HFIL.
On 26 October 2021 from 13:20 to 14 UT, powerful HF radio waves were emitted at fH = 6.77 MHz with the transmission scheme of 2 min on and 2 min off with approximately 2 min power steps of 10, 25, 50, 75, 100, 100, 75, 50, 25, and 10% from the maximum ERP. During the experiment, the maximum plasma frequency of the F2 layer varied in the range of foF2 = 6.1–6.6 MHz. Thus, the heater frequency was near or just above the foF2. Observational results from the ISR measurements during the X-mode HF power-stepping experiment on 26 October 2021 are shown in Figure 10.
As seen from Figure 10, intense field-aligned Ne enhancements at altitudes up to about 500 km accompanied by Ohmic electron heating appeared in the first power step from 13.20 to 13.22 UT at the minimum ERP = 73 MW used in the experiment. The persistent HFILs and HFPLs, which existed through the whole pump pulse, appeared only from 13.40 to 13.42 UT when the ERP reached its maximum of about 414 MW. Thereafter, the HFILs and HFPLs continued to be excited in spite of the power steps going down. Their intensity greatly decreased at ERP = 120 MW, and then they disappeared under ERP = 67 MW. Such temporal evolution of HFILs and HFPLs with the ERP dropping could be explained by the preconditioning effect which led to the decrease of the excitation thresholds of the HFILs and HFPLs.
4. Discussion
We reported on experimental results concerning artificial duct (field-aligned electron density enhancements) features and their relationship with other phenomena induced by extraordinary (X-mode) polarized high-power HF radio waves in the high-latitude upper (F-region) ionosphere obtained during specially oriented HF heating experiments at EISCAT in Tromsø. Similar field-aligned electron density enhancements above the reflection altitude of the HF pump wave were also observed in our other HF heating experiments at EISCAT. As was found, Ne enhancement is typical for X-mode HF heating experiments at various pump frequencies when HF pump waves are emitted into the upper ionosphere towards the MZ (12° south from vertical) [31,42]. It is important to emphasize that artificial electron density ducts can be generated in a controlled way on a repeatable basis.
Ducts of enhanced electron density Ne − Neo/Neo = 50–80% from the background Neo level accompanied by slight increases in electron temperature of ~30% were generated during magnetically quiet periods at various heater frequencies (fH = 5.4–8.0 MHz) which were both below and above the maximum plasma frequency of the F2 layer (fH ≤ foF2 and fH > foF2). They were observed in morning, daytime, and evening hours. The results obtained during the ISR elevation angle-stepping experiment revealed that the largest Ne enhancements were observed within ISR elevation angles of 77–79°. The field-aligned pointed ISR at Tromsø corresponds to 78°. Ducts extended along the local magnetic flux tube from ~260–300 to 500–550 km and had a transverse size of 3° in the north–south direction. Thus, their transverse size is about two times less than a beamwidth of the HF Array 1 of the EISCAT/Heating facility utilized in the experiments.
In contrast, during the O-mode heating, the electron density enhancements were usually absent. As was shown, the Ne enhancements were not observed at the pump frequencies of 6.2 and 7.953 under fH/foF2 = 0.65 and 0.83, respectively (see Figure 4). However, weak Ne enhancements were observed during O-mode HF pumping when the pump frequency was very close to the critical frequency of the F2 layer (fH~foF2) (see Figure 6). We should note that there are some specific conditions when field-aligned Ne enhancements can be excited during O-mode heating. Experimental results obtained at the EISCAT HF heating facility have shown that Ne enhancements occurred when the frequency of the ordinary polarized HF pump wave was close to the electron gyro-harmonics and/or to the maximum plasma frequency of the F2 layer [39,40,41]. HAARP experiments aboard the DEMETER and DMSP satellites have also revealed that ducts were created most efficiently at heater frequencies near the maximum plasma frequency foF2 and the second harmonic of the electron gyro-frequency [17].
Let us estimate the threshold electric field required to create an artificial Ne duct in a free space ENe. By using the well-known expression [5]
for conditions of power-stepping experiments (ERP = 57–73 MW and R = 250 km), we find that the threshold electric field required to create an artificial duct corresponds to ENe = 0.24–0.27 V/m. At the same time, the threshold electric field required to generate the persistent HFILs and HFPLs corresponds to EHFIL = 0.68–0.7 V/m. The ISR can detect the HF-enhanced plasma and ion lines (HFPL and HFIL) in the radar spectra, which is a direct indication of the excitation of Langmuir and ion-acoustic plasma waves. Since the ISR detects Langmuir and ion-acoustic plasma waves as backscattered, then at the heights occupied by HFILs and HFPLs, the Ne and Te cannot be reliably determined [37]. Nevertheless, as was demonstrated, the excitation of Ne ducts during X-mode heating occurred regardless of whether the HFIL and HFPL were excited or not (see, for example, Figure 2 and Figure 6). Moreover, as we have shown, they have different thresholds of excitation. The threshold electric field required to create Ne enhancements corresponds to ENe = 0.24–0.27 V/m, while the generation of persistent HFILs and HFPLs requires much higher electric fields of EHFIL = 0.68–0.7 V/m. However, they can coexist at high ERP.
Summarizing the features of artificial Ne ducts obtained via numerous EISCAT experiments, we should highlight the following:
- Field-aligned electron density enhancements of Ne − Neo/Neo = 50–80% from the background Neo level;
- Extend along the magnetic flux tube from ~300 to 500 km;
- A transverse size in the north–south direction of 3–4°;
- A duct development time of 50–60 s;
- A duct decay time (time after the EISCAT/Heating is switched off) within 2–5 min;
- A threshold electric field of 0.24–0.27 V/m (in a free space).
It is interesting to compare the features of X-mode Ne ducts from the EISCAT ISR observations, as reported in this article, and the O-mode Ne ducts observed aboard the DEMETER and DMSP satellites [9,10,11,12,13,14]. It was found that the X-mode ducts are more intense, and they are excited during HF heating at frequencies not only below, but also above the maximum plasma frequency of the F2 layer. Moreover, the optimal time for creating O-mode ducts is about 10 min [9,11], while the X-mode ducts reach their maximum intensity after only 50–60 s. In addition, O-mode ducts were not excited at all in the daytime [13,14], while intense X-mode ducts were generated in the morning, evening, and daytime. Therefore, X-mode HF pumping is a more efficient method for creating artificial Ne ducts compared to O-mode heating.
What is the origin of artificial ducts induced by extraordinary polarized high-power HF radio waves?
The basic mechanism for the generation of the O-mode Ne ducts observed aboard the DMSP and DEMETER satellites is thermal electron heating producing a pressure gradient pushing plasma along a magnetic flux tube [15,17,18]. The X-mode artificial ducts are created by electron acceleration along the magnetic field line. The acceleration of electrons began from an altitude of ~280 to 300 km, which is higher than the X-mode reflection altitude by 30–50 km, and extended along the magnetic field line up to 500–550 km. The acceleration of electrons was confirmed by the high ratio of green to red lines of radio-induced optical emission (0.35–0.5) during X-mode heating at EISCAT [29]. We assume that electron acceleration can occur due to the fact that the rotation of the electric field of a circularly X-polarized HF heater wave occurs in the same direction as the gyro-motion of electrons. We cannot also exclude that other unknown acceleration mechanisms are in play. According to the investigations presented in [43,44,45], the flux of accelerated electrons can produce an increased production of ionization.
The transverse size of the Ne ducts, which was about two times less than a beamwidth of the HF Array 1, utilized in the experiments gives reason to suggest that strong self-focusing of the X-mode HF wave along the magnetic flux tube occurred. However, in accordance with the theory of thermal self-focusing instability [46], the O-mode generally produces stronger Te enhancements compared with the X-mode, and thereby should cause stronger self-focusing of the pump wave. We assume that during X-mode HF pumping, the other efficient mechanism of self-focusing acts, possibly the striction type. In any case, the X-mode HF beam self-focusing must amplify the electron acceleration along the magnetic flux tube.
The obtained results give us grounds to believe that the Ne duct gives rise to the generation of X-mode AFAIs. Let us compare the Ne and Te behavior from the ISR observations and the AFAIs from the CUTLASS Finland radar measurements during alternating O-/X-mode heating (compare Figure 7 and Figure 8).
It is well known that O-mode AFAIs are excited at the pump frequencies of fH ≤ foF2 through thermal (resonance) parametric instability [12,47]. As was found, the extent of the patch occupied by O-mode AFAIs corresponded to the size of the artificially perturbed patch with increased Te values. In this region, strong Te increases of up to 3000 K (200% above background values) occurred within the ISR elevation angles of 76–82° which corresponded to the beamwidth of the HF Array 1 (see Figure 7 and Figure 8). The largest Te increases were observed during HF pumping along the magnetic flux tube, which is explained by the effect of the magnetic zenith [48].
From the CUTLASS measurements, it is shown that the extent of the patch occupied by X-mode AFAIs was approximately two times smaller than the size of the artificially perturbed patch with O-mode AFAIs and corresponded to the transverse size of the Ne duct (see Figure 7 and Figure 8). We believe that the Ne duct gives rise to the generation of X-mode AFAIs. Strong horizontal gradients in the electron density exist on the boundaries of the Ne duct. The generalized Rayleigh–Taylor (R–T) instability can be excited on electron density gradients in the presence of the electric field of the X-mode HF pump wave, producing a wide spectrum of irregularities [49]. At the reflection height of the X-mode pump wave, the electric field is perpendicular to the magnetic field (to the electron density gradient) and acts on both plasma parts.
Thus, the sequence of processes occurring during X-mode heating and leading to the creation of field-aligned electron density enhancements (ducts) begins with the self-focusing of the X-mode HF beam and the acceleration of electrons along the magnetic flux tube, leading to the increased production of ionization. In turn, the Ne ducts give rise to the excitation of AFAIs, which play a key role in the generation of HF-induced plasma and ion lines and narrowband stimulated electromagnetic emission.
Despite a large amount of experimental data demonstrating the generation of various phenomena in the high-latitude upper (F-region) ionosphere induced by powerful HF radio waves with extraordinary (X-mode) polarization, there is still no adequate theory explaining the generation of these phenomena, which were thought to be impossible.
5. Conclusions
Ducts (field-aligned plasma density enhancements) provide a link into the magnetosphere; therefore, their existence contributes to the remediation of energetic particles from the magnetosphere and, consequently, affects magnetosphere–ionosphere interactions and energy. As was found, powerful HF radio waves with X-mode polarization radiated into the high-latitude upper (F-region) ionosphere towards the MZ are able to create intense electron density ducts.
It was found that X-mode electron density ducts over EISCAT occurred during magnetically quiet periods in the morning, daytime, and early evening hours at various heater frequencies (fH = 5.4–8.0 MHz) which were both below and above the maximum plasma frequency of the F2 layer (fH ≤ foF2 and fH > foF2). The intensity of the ducts was Ne − Neo/Neo = 50–80%, where Neo is an electron density outside the duct, and their transverse size in the north–south direction was 3–4°. They began from ~260 to 300 and extended along the geomagnetic field up to the upper height limit of ISR measurements.
It was revealed that excitation of the X-mode Ne ducts occurs regardless of whether HFPLs and HFILs were generated or not. Moreover, as was found, they have different thresholds of excitation. The threshold electric field required to excite Ne ducts is ENe. = 0.24–0.27 V/m, while the excitation of persistent HFILs and HFPLs requires much higher electric fields of EHFIL = 0.68–0.7 V/m.
It was found that the transverse size of the Ne duct corresponded to the horizontal size of the patch occupied by the X-mode AFAIs. We suggest that the strong horizontal gradients of the electron density on the boundaries of the Ne duct give rise to the generation of X-mode AFAIs. The generalized Rayleigh–Taylor (R–T) instability can be excited on electron density gradients in the presence of the electric field of X-mode pump wave, producing a wide spectrum of irregularities.
We assume that the basic mechanism for the creation of X-mode artificial ducts could be the acceleration of electrons leading to enhanced production of electron density. Self-focusing of the X-mode HF beam and rotation of the electric field of X-polarized HF pump waves in the same direction as electron gyro-motion can lead to electron acceleration. Further investigations are called for on artificial ducts which can contribute to the removal of energetic particles from the magnetosphere and radiation belts and can be generated in a controlled way on a repeatable basis.
Author Contributions
Conceptualization, N.F.B.; methodology, N.F.B.; software, T.D.B.; investigation and analysis, N.F.B., T.D.B., A.S.K. and I.M.E.; writing—original draft preparation, N.F.B.; writing—review and editing, N.F.B., T.D.B., A.S.K. and I.M.E. All authors have read and agreed to the published version of the manuscript.
Funding
The research was supported by a grant No 22-17-00020 from the Russian Science Foundation. Grant information is available on the website https://rscf.en/project/22-17-00020 (accessed on 11 May 2022).
Data Availability Statement
Publicly available data sets were analyzed in this study. The data supporting the conclusions can be obtained through the EISCAT Madrigal database (https://portal.eiscat.se/madrigal/, accessed on 1 August 2022).
Acknowledgments
EISCAT is an international scientific association supported by research organizations in China (CRIRP), Finland (SA), Japan (NIPR and STEL), Norway (NFR), Sweden (VR), and the United Kingdom (NERC). The authors acknowledge the use of CUTLASS (SuperDARN) data. We are grateful to T. Yeoman for the CUTLASS data, I. Haggstrom for the discussion of the EISCAT ISR data, and Erik Varberg for the calculations of effective radiated powers and beam patterns during power-stepping experiments. Authors are grateful to the reviewers for useful comments.
Conflicts of Interest
The authors declare no conflict of interest.
Abbreviations
The following abbreviations are frequently used in this manuscript:
| AFAI | Artificial field-aligned irregularity |
| CUTLASS | Co-operative UK Twin Located Auroral Sounding System |
| EISCAT | European Incoherent SCATter |
| ERP | Effective radiated power |
| HF | High-frequency |
| HFIL | HF-enhanced ion line |
| HFILDOWN | Downshifted HF-enhanced ion line |
| HFIL0 | Non-shifted HF-enhanced ion line |
| HFILUP | Upshifted HF-enhanced ion line |
| HFPL | HF-induced plasma line |
| ISR | Incoherent scatter radar |
| MZ | Magnetic zenith |
| UHF | Ultra-high-frequency |
| UT | Universal time |
References
- Storey, L.R.O. An investigation of whistling atmospherics. Philos. Trans. R. Soc. Lond. A Math. Phys. Eng. Sci. 1953, 246, 113–141. [Google Scholar] [CrossRef]
- Helliwell, R.A. Whistlers and Related Ionospheric Phenomena; Stanford University Press: Stanford, CA, USA, 1965. [Google Scholar]
- Siingh, D.; Singh, A.K.; Patel, R.P.; Singh, R.; Singh, R.P.; Veenadhari, B.; Mukherjee, M. Thunderstorms, Lightning, Sprites and Magnetospheric Whistler-Mode Radio Waves. Surv. Geophys. 2008, 29, 499–551. [Google Scholar] [CrossRef]
- Dunckel, N.; Helliwell, R.A. Whistler-mode emissions on the OGO 1 satellite. J. Geophys. Res. 1969, 74, 6371–6385. [Google Scholar] [CrossRef]
- Woodroffe, J.R.; Streltsov, A.V.; Vartanyan, A.; Milikh, G.M. Whistler propagation in ionospheric density ducts: Simulations and DEMETER observations. J. Geophys. Res. Space Phys. 2013, 118, 7011–7018. [Google Scholar] [CrossRef]
- Inan, U.S.; Bell, T.F.; Bortnik, J.; Albert, J.M. Controlled precipitation of radiation belt electrons. J. Geophys. Res. 2003, 108, 1186. [Google Scholar] [CrossRef]
- Koons, H. Observations of large-amplitude, whistler-mode wave ducts in the outer plasmasphere. J. Geophys. Res. 1989, 94, 15393–15397. [Google Scholar] [CrossRef]
- Carpenter, D.L.; Spasojević, M.A.; Bell, T.F.; Inan, U.S.; Reinisch, B.W.; Galkin, I.A.; Benson, R.F.; Green, J.L.; Fung, S.F.; Boardsen, S.A. Small-scale field-aligned plasmaspheric density structures inferred from the Radio Plasma Imager on IMAGE. J. Geophys. Res. 2002, 107, SMP22-1–SMP22-19. [Google Scholar] [CrossRef]
- Streltsov, A.V.; Lampe, M.; Ganguli, G. Whistler propagation in nonsymmetrical density channels. J. Geophys. Res. 2007, 112, A06226. [Google Scholar] [CrossRef]
- Sonwalkar, V.S. The influence of plasma density irregularities on Whistler-mode wave propagation. Lect. Notes Phys. 2006, 687, 141–190. [Google Scholar] [CrossRef]
- Robinson, T.R. The heating of the high latitude ionosphere by high power radio waves. Phys. Rep. 1989, 179, 79–209. [Google Scholar] [CrossRef]
- Gurevich, A.V. Nonlinear effects in the ionosphere. Phys. Uspekhi 2007, 50, 1091–1121. [Google Scholar] [CrossRef]
- Kuo, S.P. Overview of Ionospheric Modification by High Frequency (HF) Heaters-Theory. Prog. Electromagn. Res. B 2014, 60, 141–155. [Google Scholar] [CrossRef]
- DuBois, D.F.; Rose, H.A.; Russell, D. Space and time distribution of HF excited Langmuir turbulence in the ionosphere: Comparison of theory and experiment. J. Geophys. Res. 1993, 98, 17543–17567. [Google Scholar] [CrossRef]
- Milikh, G.M.; Papadopoulos, K.; Shroff, H.; Chang, C.; Wallace, T.; Mishin, E.; Parrot, M.; Berthelier, J. Formation of artificial ionospheric ducts. Geophys. Res. Lett. 2008, 35, L17104. [Google Scholar] [CrossRef]
- Fallen, C.T.; Secan, J.A.; Watkins, B.J. In-situ measurements of topside ionosphere electron density enhancement during an HF-modification experiment. Geophys. Res. Lett. 2011, 38, L08101. [Google Scholar] [CrossRef]
- Vartanyan, A.; Milikh, G.M.; Mishin, E.; Parrot, M.; Galkin, I.; Reinisch, B.; Huba, J.; Joyce, G.; Papadopoulos, K. Artificial ducts caused by HF heating of the ionosphere by HAARP. J. Geophys. Res. 2012, 117, A10307. [Google Scholar] [CrossRef]
- Blagoveshchenskaya, N.F.; Borisova, T.D.; Rietveld, M.T.; Yeoman, T.K.; Wright, D.M.; Rother, M.; Lühr, H.; Mishin, E.V.; Roth, C. Results of Russian Experiments Dealing with the Impact of Powerful HF Radio waves on the High Latitude Ionosphere Using the EISCAT Facilities. Geomagn. Aeron. 2011, 51, 1109–1120. [Google Scholar] [CrossRef]
- Frolov, V.L.; Rapoport, V.O.; Komrakov, G.P.; Belov, A.S.; Markov, G.A.; Parrot, M.; Rauch, J.L.; Mishin, E.V. Density ducts formed by heating the Earth’s ionosphere with high-power HF radio waves. JETP Lett. 2008, 88, 790–794. [Google Scholar] [CrossRef]
- Frolov, V.L.; Rapoport, V.O.; Schorokhova, E.A.; Belov, A.S.; Parrot, M.; Rauch, J.-L. Features of the electromagnetic and plasma disturbances induced at the altitudes of the earth’s outer ionosphere by modification of the ionospheric F2 region using high-power radio waves radiated by the Sura heating facility. Radiophys. Quantum Electron. 2016, 59, 177–198. [Google Scholar] [CrossRef]
- Milikh, G.M.; Demekhov, A.; Vartanyan, A.; Mishin, E.V.; Huba, J. A new model for formation of artificial ducts due to ionospheric HF-heating. Geophys. Res. Lett. 2012, 39, L10102. [Google Scholar] [CrossRef]
- Rietveld, M.T.; Kosch, M.T.; Blagoveshchenskaya, N.F.; Kornienko, V.A.; Leyser, T.B.; Yeoman, T.M. Ionospheric electron heating, optical emissions, and striations induced by powerful HF radio waves at high latitudes: Aspect angle dependence. J. Geophys. Res. 2003, 108, 1141–1156. [Google Scholar] [CrossRef]
- Kosch, M.; Ogava, Y.; Rietveld, M.; Nozawa, S.; Fujii, R. An analysis of pump-induced artificial ionospheric ion upwelling at EISCAT. J. Geophys. Res. 2010, 115, A12317. [Google Scholar] [CrossRef]
- Kosch, M.J.; Vickers, H.; Ogawa, Y.; Senior, A.; Blagoveshchenskaya, N. First observation of the anomalous electric field in the topside ionosphere by ionospheric modification over EISCAT. Geophys. Res. Lett. 2014, 41, 7427–7435. [Google Scholar] [CrossRef]
- Blagoveshchenskaya, N.F.; Kornienko, V.A.; Borisova, T.D.; Rietveld, M.T.; Bõsinger, T.; Thidé, B.; Leyser, T.B.; Brekke, A. Heater-induced phenomena in a coupled ionosphere–magnetosphere system. Adv. Space Res. 2006, 38, 2495–2502. [Google Scholar] [CrossRef]
- Stubbe, P. Review of ionospheric modification experiments at Tromso. J. Atmos. Terr. Phys. 1996, 58, 349–368. [Google Scholar] [CrossRef]
- Blagoveshchenskaya, N.F.; Borisova, T.D.; Yeoman, T.; Rietveld, M.T.; Ivanova, I.M.; Baddeley, L.J. Artificial field-aligned irregularities in the high-latitude F region of the ionosphere induced by an X-mode HF heater wave. Geophys. Res. Lett. 2011, 38, L08802. [Google Scholar] [CrossRef]
- Blagoveshchenskaya, N.F.; Borisova, T.D.; Kalishin, A.S.; Yeoman, T.K.; Schmelev, Y.A.; Leonenko, E.E. Characterization of Artificial, Small-Scale, Ionospheric Irregularities in the High-Latitude F Region Induced by High-Power, High-Frequency Radio Waves of Extraordinary Polarization. Geomagn. Aeron. 2019, 59, 759–773. [Google Scholar] [CrossRef]
- Blagoveshchenskaya, N.F.; Borisova, T.D.; Kosch, M.; Sergienko, T.; Brändström, U.; Yeoman, T.K.; Häggström, I. Optical and Ionospheric Phenomena at EISCAT under Continuous X-mode HF Pumping. J. Geophys. Res. Space Phys. 2014, 119, 10483–10498. [Google Scholar] [CrossRef]
- Blagoveshchenskaya, N.F.; Borisova, T.D.; Yeoman, T.K. Comment on the article “Parametric Instability Induced by X-Mode Wave Heating at EISCAT” by Wang et al. 2016. J. Geophys. Res. Space Phys. 2017, 122, 12570–12586. [Google Scholar] [CrossRef]
- Blagoveshchenskaya, N.F.; Borisova, T.D.; Kalishin, A.S.; Yeoman, T.K.; Häggström, I. Distinctive features of Langmuir and Ion-acoustic Turbulences induced by O- and X-mode HF Pumping at EISCAT. J. Geophys. Res. Space Phys. 2020, 125, e2020JA028203. [Google Scholar] [CrossRef]
- Kalishin, A.S.; Blagoveshchenskaya, N.F.; Borisova, T.D.; Yeoman, T.K. Ion Gyro-Harmonic Structures in Stimulated Emission Excited by X-Mode High Power HF Radio Waves at EISCAT. J. Geophys. Res. Space Phys. 2021, 126, e2020JA028989. [Google Scholar] [CrossRef]
- Rietveld, M.T.; Senior, A.; Markkanen, J.; Westman, A. New capabilities of the upgraded EISCAT high-power HF facility. Radio Sci. 2016, 51, 1533–1546. [Google Scholar] [CrossRef]
- Rishbeth, H.; Eyken, T. EISCAT: Early history and the first ten years of operation. J. Atmos. Sol. Terr. Phys. 1993, 55, 525–542. [Google Scholar] [CrossRef]
- Beynon, W.J.G.; Williams, P.J.S. Incoherent scatter of radio waves from the ionosphere. Rep. Prog. Phys. 1975, 41, 909–956. [Google Scholar] [CrossRef]
- Alcaydé, D. (Ed.) Incoherent Scatter Theory, Practice and Science: Collection of Lectures Given in Cargese; EISCAT Technical Report 97/53; EISCAT Scientific Association: Kiruna, Sweden, 1997; p. 314. [Google Scholar]
- Lehtinen, M.S.; Huuskonen, A. General incoherent scatter analysis and GUISDAP. J. Atmos. Sol. Terr. Phys. 1996, 58, 435–452. [Google Scholar] [CrossRef]
- Lester, M.; Chapman, P.J.; Cowley, S.W.H.; Crooks, S.J.; Davies, J.A.; Hamadyk, P.; McWilliams, K.A.; Milan, S.E.; Parsons, M.J.; Payne, D.B.; et al. Stereo CUTLASS: A new capability for the SuperDARN radars. Ann. Geophys. 2004, 22, 459–473. [Google Scholar] [CrossRef]
- Borisova, T.D.; Blagoveshchenskaya, N.F.; Kalishin, A.S.; Kosch, M.; Senior, A.; Rietveld, M.T.; Yeoman, T.K.; Häggström, I. Phenomena in the high-latitude ionospheric F region induced by a HF heater wave at frequencies near the fourth electron gyroharmonic. Radiophys. Quant. Electr. 2014, 57, 1–19. [Google Scholar] [CrossRef]
- Borisova, T.D.; Blagoveshchenskaya, N.F.; Kalishin, A.S.; Rietveld, M.T.; Yeoman, T.K.; Hägström, I. Modification of the high-latitude ionospheric Fregion by high-power HF radio waves at frequencies near the fifth and sixth electron gyroharmonics. Radiophys. Quantum Electron. 2016, 59, 561–585. [Google Scholar] [CrossRef]
- Wu, J.; Wu, J.; Xu, Z. Results of ionospheric heating experiments involving an enhancement in electron density in the high latitude ionosphere. Plasma Sci. Technol. 2016, 18, 890–896. [Google Scholar] [CrossRef]
- Blagoveshchenskaya, N.F.; Borisova, T.D.; Kalishin, A.S.; Egorov, I.M.; Zagorskiy, G.A. Disturbances of electron density in the high latitude upper (F-region) ionosphere induced by X-mode HF pump waves from EISCAT UHF radar observations. Probl. Arktikii Antarktiki Arct. Antarct. Res. 2022, 68, 248–257. [Google Scholar] [CrossRef]
- Carlson, H.C.; Djuth, F.T.; Zhang, L.D. Creating space plasma from the ground. J. Geophys. Res. Space Phys. 2016, 122, 978–999. [Google Scholar] [CrossRef]
- Carlson, H.C.; Wickwar, V.B.; Mantas, G.P. Observations of fluxes of suprathermal electrons accelerated by HF excited instabilities. J. Atmos. Terr. Phys. 1982, 44, 1089–1100. [Google Scholar] [CrossRef]
- Pedersen, T.R.; Esposito, R.; Starks, M.; McCarrick, M. Quantitative determination of HF radio-induced optical emission production efficiency at high latitudes. J. Geophys. Res. 2008, 113, A11316. [Google Scholar] [CrossRef]
- Gurevich, A.V. Nonlinear Phenomena in the Ionosphere; Springer: New York, NY, USA, 1978. [Google Scholar]
- Grach, S.M.; Trakhtengerts, V.Y. Parametric excitation of ionospheric irregularities extended along the magnetic field. Radiophys. Quant. Electron. 1975, 18, 951–957. [Google Scholar] [CrossRef]
- Gurevich, A.V.; Zybin, K.P.; Carlson, H.C.; Pedersen, T. Magnetic zenith effect in ionospheric modifications. Phys. Lett. A 2002, 305, 264–274. [Google Scholar] [CrossRef]
- Kelley, M.C. The Earth’s Ionosphere: Plasma Physics and Electrodynamics; Academic Press: San Diego, CA, USA, 1989. [Google Scholar]
Figure 1.
Viewing geometry demonstrating the locations of the EISCAT ISR, EISCAT/Heating facility, and CUTLASS Finland radar.
Figure 1.
Viewing geometry demonstrating the locations of the EISCAT ISR, EISCAT/Heating facility, and CUTLASS Finland radar.

Figure 2.
Observational results from multi-instrument diagnostics during the experiment on 18 February 2012 from 14:15 to 16:02 UT. A powerful X-polarized HF radio wave was injected at fH = 6.2 MHz towards the MZ under ERP = 512 MW. The pump pulses are labeled on the time axis. (a) Altitude–time distribution of the electron density (Ne) and temperature (Te) obtained by the ISR with a 30 s integration time. The Ne subplot shows the behavior of the electron density depending on the altitude from 90 to ~600 km and time. The color box on the right provides the values of the electron density in m–3 on a logarithmic scale from 1010 (blue dark color) to 1012 (red and pink color). A logarithmic scale is used due to the electron density changing greatly with altitude. The Te subplot is the same, but for the electron temperature. Here, a linear scale is used: (b) range–time plots of the CUTLASS backscatter power at frequencies ~13 and 16 MHz derived from beam 5, (c) time behavior of the critical frequency of the F2 layer foF2 and heater frequency fH, (d) altitude–time distribution of the raw electron density (Nraw), and (e) intensities of HF-induced plasma lines (HFPL) with a 30 s integration time.

Figure 3.
Temporal behavior of Ne at fixed altitudes from ISR observations. The heater-on cycles are shown on the time axis. (a) An X-mode HF heater wave was emitted on 18 February 2012 from 15:35 to 15:45 UT at a frequency of 6.2 MHz (fH > foF2) under ERP = 512 MW (b) An X-mode HF heater wave was emitted on 12 October 2011 from 14:50 to 15:00 UT at a frequency of 7.953 (fH > foF2) under ERP = 820 MW.

Figure 4.
Altitude–time plots of the ISR analysis with a 20 s integration time of the electron density Ne and temperature Te and intensities of the downshifted, non-shifted, and upshifted HF-enhanced ion lines (HFILDOWN, HFIL0, and HFILUP) with a 20 s integration time during alternating O-/X-mode HF heating at 6.2/7.953 MHz on 20 October 2013 from 13:00 to 13:30 UT. HF transmission pulses are shown on the time axis in all panels. Polarization and the value of the pump frequency are given on the axis of time in the top panel.

Figure 5.
Plots of the ISR analysis with a 10 s integration time of the electron density Ne at fixed altitudes and intensities of the HFILDOWN, HFIL0, and HFILUP at fixed altitudes during X-mode HF pumping at fH = 6.2 and 7.953 MHz on 20 October 2013 from 13:15 to 13:30 UT. X-mode transmission cycles are shown on the axis of time.

Figure 6.
Observational results from multi-instrument diagnostics during an alternating O-/X-mode HF pumping experiment on 3 November 2013 from 15:30 to 18:00 UT. The O-/X-polarized HF radio waves were injected at fH = 6.2 MHz towards the MZ under ERP = 450 MW. The pump pulses of 10 min on and 5 min off and the polarization of the HF pump wave are labeled on the time axis. (a) Altitude–time plots of the electron density Ne and temperature Te from the ISR analysis with a 30 s integration time, (b) range-time plots of the CUTLASS backscatter powers at frequencies ~13 and 16 MHz derived from beam 5, and (c) time plot of the critical frequency of the F2 layer (foF2) and heater frequency fH.

Figure 7.
Observational results from the ISR on 28 October 2013 from 13 to 14 UT. Alternating X-/O-mode heating was carried out at fH = 7.953 MГц (fH < foF2) towards the MZ under ERP = 840 MW in cycles of 20 min on and 10 min off. (a) Altitude–time plots of the electron density Ne and temperature Te; from the ISR analysis with a 20 s integration time. (b) Variations in time of the Ne and Te at fixed altitudes. During the 20 min HF transmission pulse, the EISCAT ISR ran in elevation angle stepping mode from 74° to 90° (2 min at each angle). The sequence of changing the ISR elevation angle during the X- and O-mode HF transmission pulses is illustrated in the bottom panel.

Figure 8.
The intensity of artificial backscatter and range–time plots of the CUTLASS backscatter power at frequencies of ~16, 18, and 20 MHz derived from beam 5 during the alternating X-/O-mode heating on 28 October 2013 from 12:58 to 14 UT. The EISCAT/Heating facility radiated towards the magnetic zenith at pump frequency fH = 7.953 MHz in cycles of 20 min on and 10 min off.

Figure 9.
Observational results obtained during the power-stepping experiment on 31 October 2015 from 13:30 to 14:00 UT. Powerful X-polarized HF radio waves were injected at fH = 7.1 MHz towards the MZ with the transmission scheme of 2 min on and 1 min off. (a) Altitude–time plots of the electron density Ne, temperature Te, and the raw electron density Nraw from the ISR analysis with a 20 s integration time, (b) range–time plots of the CUTLASS backscatter power at frequency ~18 MHz derived from beam 5, and (c) the time evolution of the ERP in MW. The pump pulses and ERP values for every pulse in MW are shown on this panel.

Figure 10.
EISCAT UHF ISR observations with a 10 s integration time in the course of the X-mode HF power-stepping experiment on 26 October 2021 from 13:20 to 14:00 UT showing the altitude–time evolution of the Ne, Te, intensities of down- and upshifted HF-enhanced ion lines (HFILDOWN and HFILUP) and HF-induced plasma lines (HFPL). The X-mode HF pump wave was radiated at a frequency of 6.77 MHz towards the magnetic zenith by using the transmission scheme of 2 min on and 2 min off. The pump pulses and ERP values for every pulse in MW are shown on the bottom panel.

Disclaimer/Publisher’s Note: The statements, opinions and data contained in all publications are solely those of the individual author(s) and contributor(s) and not of MDPI and/or the editor(s). MDPI and/or the editor(s) disclaim responsibility for any injury to people or property resulting from any ideas, methods, instructions or products referred to in the content. |
© 2023 by the authors. Licensee MDPI, Basel, Switzerland. This article is an open access article distributed under the terms and conditions of the Creative Commons Attribution (CC BY) license (https://creativecommons.org/licenses/by/4.0/).
Share and Cite
MDPI and ACS Style
Blagoveshchenskaya, N.F.; Borisova, T.D.; Kalishin, A.S.; Egorov, I.M. Artificial Ducts Created via High-Power HF Radio Waves at EISCAT. Remote Sens. 2023, 15, 2300. https://doi.org/10.3390/rs15092300
AMA Style
Blagoveshchenskaya NF, Borisova TD, Kalishin AS, Egorov IM. Artificial Ducts Created via High-Power HF Radio Waves at EISCAT. Remote Sensing. 2023; 15(9):2300. https://doi.org/10.3390/rs15092300
Chicago/Turabian StyleBlagoveshchenskaya, Nataly F., Tatiana D. Borisova, Alexey S. Kalishin, and Ivan M. Egorov. 2023. "Artificial Ducts Created via High-Power HF Radio Waves at EISCAT" Remote Sensing 15, no. 9: 2300. https://doi.org/10.3390/rs15092300
Note that from the first issue of 2016, this journal uses article numbers instead of page numbers. See further details here.