1. Introduction
Seismic reflection methods have been used for mineral exploration and mine planning for several decades (e.g., [
1,
2,
3,
4] and the references therein). Traditionally, mineral prospecting has mainly concentrated on the use of electromagnetic and potential field methods. However, the growing demand for mineral resources in modern day society continuously fuels the search for new deposits. This drives mineral exploration into increasingly deeper levels, which exceed the coverage of the traditional techniques [
5,
6]. Reflection seismics, on the other hand, offers depth penetration and high spatial resolution down to several kilometers of depth. Although the application of seismic methods to mineral exploration poses various challenges, several successful cases, including surveys from Australia [
7], Canada [
8,
9,
10,
11], Scandinavia [
12,
13,
14,
15,
16,
17,
18,
19,
20] and South Africa [
21,
22,
23], have demonstrated the feasibility of the method.
Despite these successes, some challenges still remain, which have restrained the use of seismic methods on a wider scale for industrial applications. One important reason is that mineral deposits are often located in hardrock rather than sedimentary environments. Hardrock settings are usually dominated by igneous and metamorphic rocks that have undergone severe deformation due to tectonic processes [
1]. This causes various challenges for seismic methods: (1) The predominant rock types usually exhibit high seismic velocities (≈4–8 km/s [
24]), causing the spatial resolution to be lower compared to sedimentary environments. (2) The rocks often show less variation in terms of their elastic properties [
6], which results in weaker reflective signals arising from the geological interfaces (i.e., low Signal-to-Noise Ratio (SNR)). (3) The tectonic activities produce irregularly-shaped geological interfaces, which cause the seismic wavefield to be dominated by similar proportions of diffractions and reflections [
5,
25,
26]. (4) The tectonic processes often result in steeply-dipping geological units, which are difficult to image with surface-based acquisitions.
As a result of these factors, seismic sections obtained in hardrock mining and mineral exploration settings often lack well-pronounced, continuous reflectors, but are characterized by piecewise, disconnected reflectivity patterns, which can be difficult to interpret.
In order to tackle the above-mentioned challenges and to make seismic reflection methods more attractive for mineral exploration, various attempts have been made to increase the overall efficiency and to lower the costs of seismic surveys. One way is to integrate seismic reflection methods with other geophysical and geological techniques that are conventionally used in mineral exploration (e.g., [
22,
27]). Another promising approach is to combine strategically different forms of seismic acquisition. 2D surveys can be carried out for exploration at a regional-scale, followed a combination of a smaller-scale 3D survey and borehole seismic measurements for more focused exploration and precise resource delineation [
6,
16,
28]. For resource delineation, borehole seismic surveys have been proven to be particularly useful, implementing either crosshole tomography approaches [
29,
30,
31] or reflectivity imaging [
32,
33,
34,
35,
36,
37] using Vertical Seismic Profiling (VSP) methods. Additionally, the application of new technologies, such as passive seismic imaging methods [
38] or the use of fiber-optic technologies [
39], provides new possibilities for seismic surveying.
The presented work is part of a larger international research collaboration, which aims at the development of COst-effective Geophysical Imaging Techniques for supporting Ongoing MINeral exploration in Europe (COGITO-MIN). The COGITO-MIN project involved acquisition and integration of multi-scale seismic methods including surface-based 2D and 3D active-source and passive seismic measurements and an underground in-mine VSP survey using conventional and fiber-optic technologies. This work addresses the VSP measurements that were carried out inside the Kylylahti polymetallic mine.
For this purpose, we first explain the geological setting of the survey area and its petrophysical characteristics. Next, we describe the experimental setup of the VSP survey inside the Kylylahti mine and compare the used VSP systems in terms of their technological characteristics and data quality. To facilitate interpretation of the acquired VSP data, we then present a realistic seismic forward modeling study, which helps to identify target reflections and link them to the predominant geological contrasts. Finally, we present reflectivity images of the acquired and synthetic VSP datasets and discuss their geological interpretation in relation to borehole data.
2. Geological and Petrophysical Setting
2.1. Geological Setting
The Kylylahti mine is located in the Outokumpu mining district, where the first copper mine was opened in 1913. The predominant geology of this area is described in detail by [
40]. In the Kylylahti area, the geology can be characterized in terms of four units (see
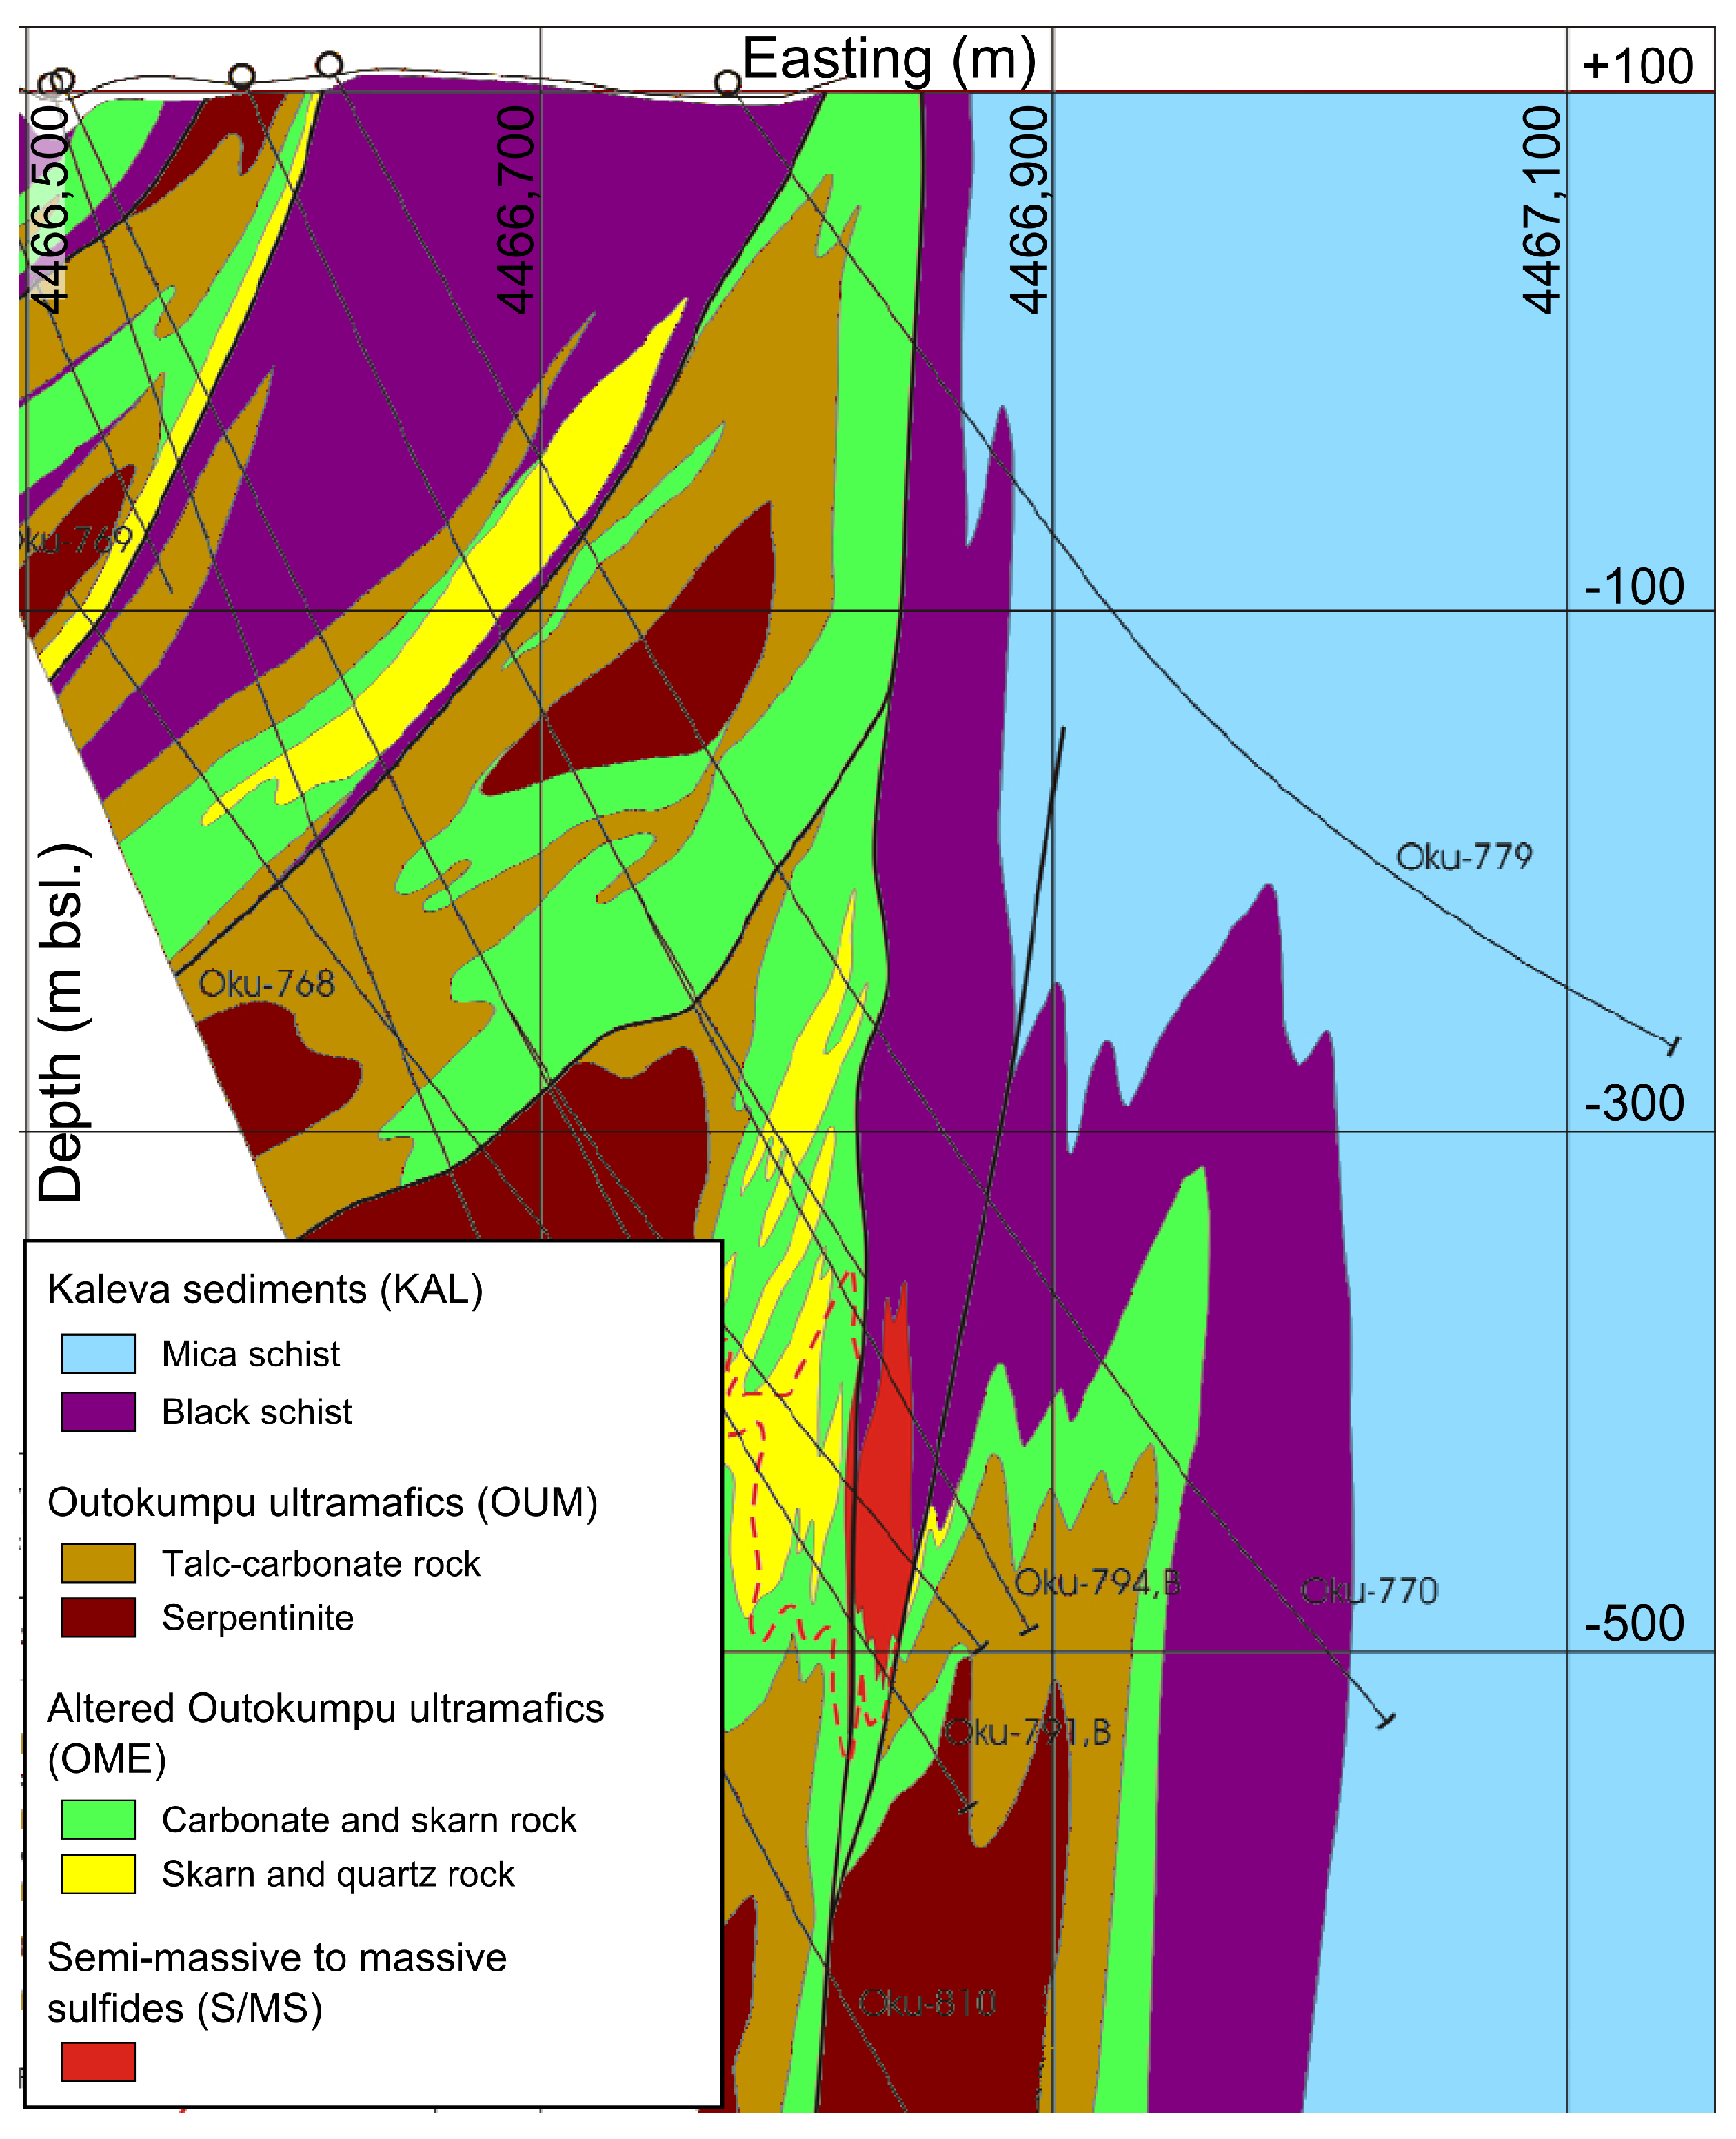
Figure 1): (1) The Kylylahti deposit, a Semi-massive to massive sulfide (S/MS) mineralization, is associated with (2) ultramafic rocks Outokumpu ultramafics (OUM) that mainly consist of serpentinite and talc-carbonate rocks. These are fringed by (3) alteration zones of a few to several tens of meters thickness composed of carbonate-skarn-quartz rocks, the Altered Outokumpu ultramafics (OME). In combination, the nearly N-S trending and near-vertical OUM and OME units are called the Outokumpu assemblage rocks, which are embedded in (4) the regional Kaleva Sedimentary Belt (KAL). The Kaleva sediments consist of mica schist and black schist. They form a near-vertical contrast with the Outokumpu assemblage rocks (OUM + OME). Moreover, black schist interlayers also occur in the severely folded Outokumpu assemblage package, where various rock contacts are repeated several times.
The Kylylahti S/MS deposit is located in a steeply-dipping contact between black schists and carbonate-skarn-quartz rocks (
Figure 1). It has the shape of a ≈1.3 km-long, N-S trending lens, which reaches into a depth of ≈750 m below sea level. The maximum thickness and height are 30 m and 170 m, respectively. The shape of the S/MS deposit in combination with the severely folded and near-vertical geological contrasts makes this deposit a very challenging imaging target for surface-based seismic surveys. For this reason, the in-mine VSP measurements provide the most promising tool for accurate delineation of the deposit.
2.2. Petrophysics
Whether or not a mineral deposit is detectable using the seismic reflection method depends on the distribution of the elastic properties throughout the predominant geological units. These properties are the density
and the seismic P- and S-wave velocities
and
, respectively. Those form the seismic impedances:
which are related to the seismic reflectivity:
Equation (
2) describes the seismic reflection coefficient that is caused by the impedance contrast of two subsequent geological layers 1 and 2. The coefficient can be computed for either P- or S-waves. It is directly proportional to the amount of seismic energy that is reflected back from an impedance contrast (the reflector) under normal incidence. The more general cases of arbitrary incidence are mathematically described by the Zoeppritz equations [
41,
42].
The reflective contrast between many mineral deposits and their host-rocks has long been recognized [
1,
43,
44,
45] and has led to successful application of the seismic reflection method for mineral exploration, in particular for the exploration of sulfide deposits [
24,
46,
47,
48]. For the Kylylahti mine area, detailed petrophysical laboratory measurements of about 200 rock samples revealed a strong impedance contrast between the S/MS mineralization and its various host rock units [
49] (
Figure 2).
In addition, the petrophysical analysis reveals that various weaker reflections can be expected from within the Outokumpu assemblage unit. In particular, the talc-carbonate rocks exhibit a significantly lower P-wave velocity than the serpentinites. Both rock types belong to the OUM and form a clear and distinctive contrast evidenced by various borehole logs. On the other hand, the OME rocks are much more difficult to distinguish lithologically, which complicates precise logging and the geological interpretation of the obtained VSP images (see
Section 6).
3. Vertical Seismic Profiling at the Kylylahti Mine Site
3.1. In-Mine VSP Acquisition
The Kylylahti survey campaign was launched in early fall 2016. As part of this survey, the underground VSP measurements were carried out inside the Kylylahti polymetallic mine (
Figure 3). The imminent goal of the VSP survey was to image a massive-to-semi-massive sulfide mineralization.
In comparison to surface-based seismic acquisition, the underground VSP measurements have several advantages in this setting. First, their sources and receivers are located within the bedrock and in direct vicinity of the target mineralization. This means that the deteriorating effect of the near-surface is avoided by these types of measurements. Second, they operate at much higher dominant frequency (≈180 Hz), which provides a significantly higher spatial resolution than the surface-based measurements. Third, their acquisition geometry is more appropriate to image the sulfide deposit, which embodies a nearly vertical lens of only a few tens of meters thickness [
40]. The VSP measurements illuminate the deposit from the side, and therefore, they are much more likely to record a pronounced reflection. For these reasons, the underground VSP measurements represent the most promising tool for detailed imaging of the sulfide deposit amongst the various seismic methods carried out in the Kylylahti survey.
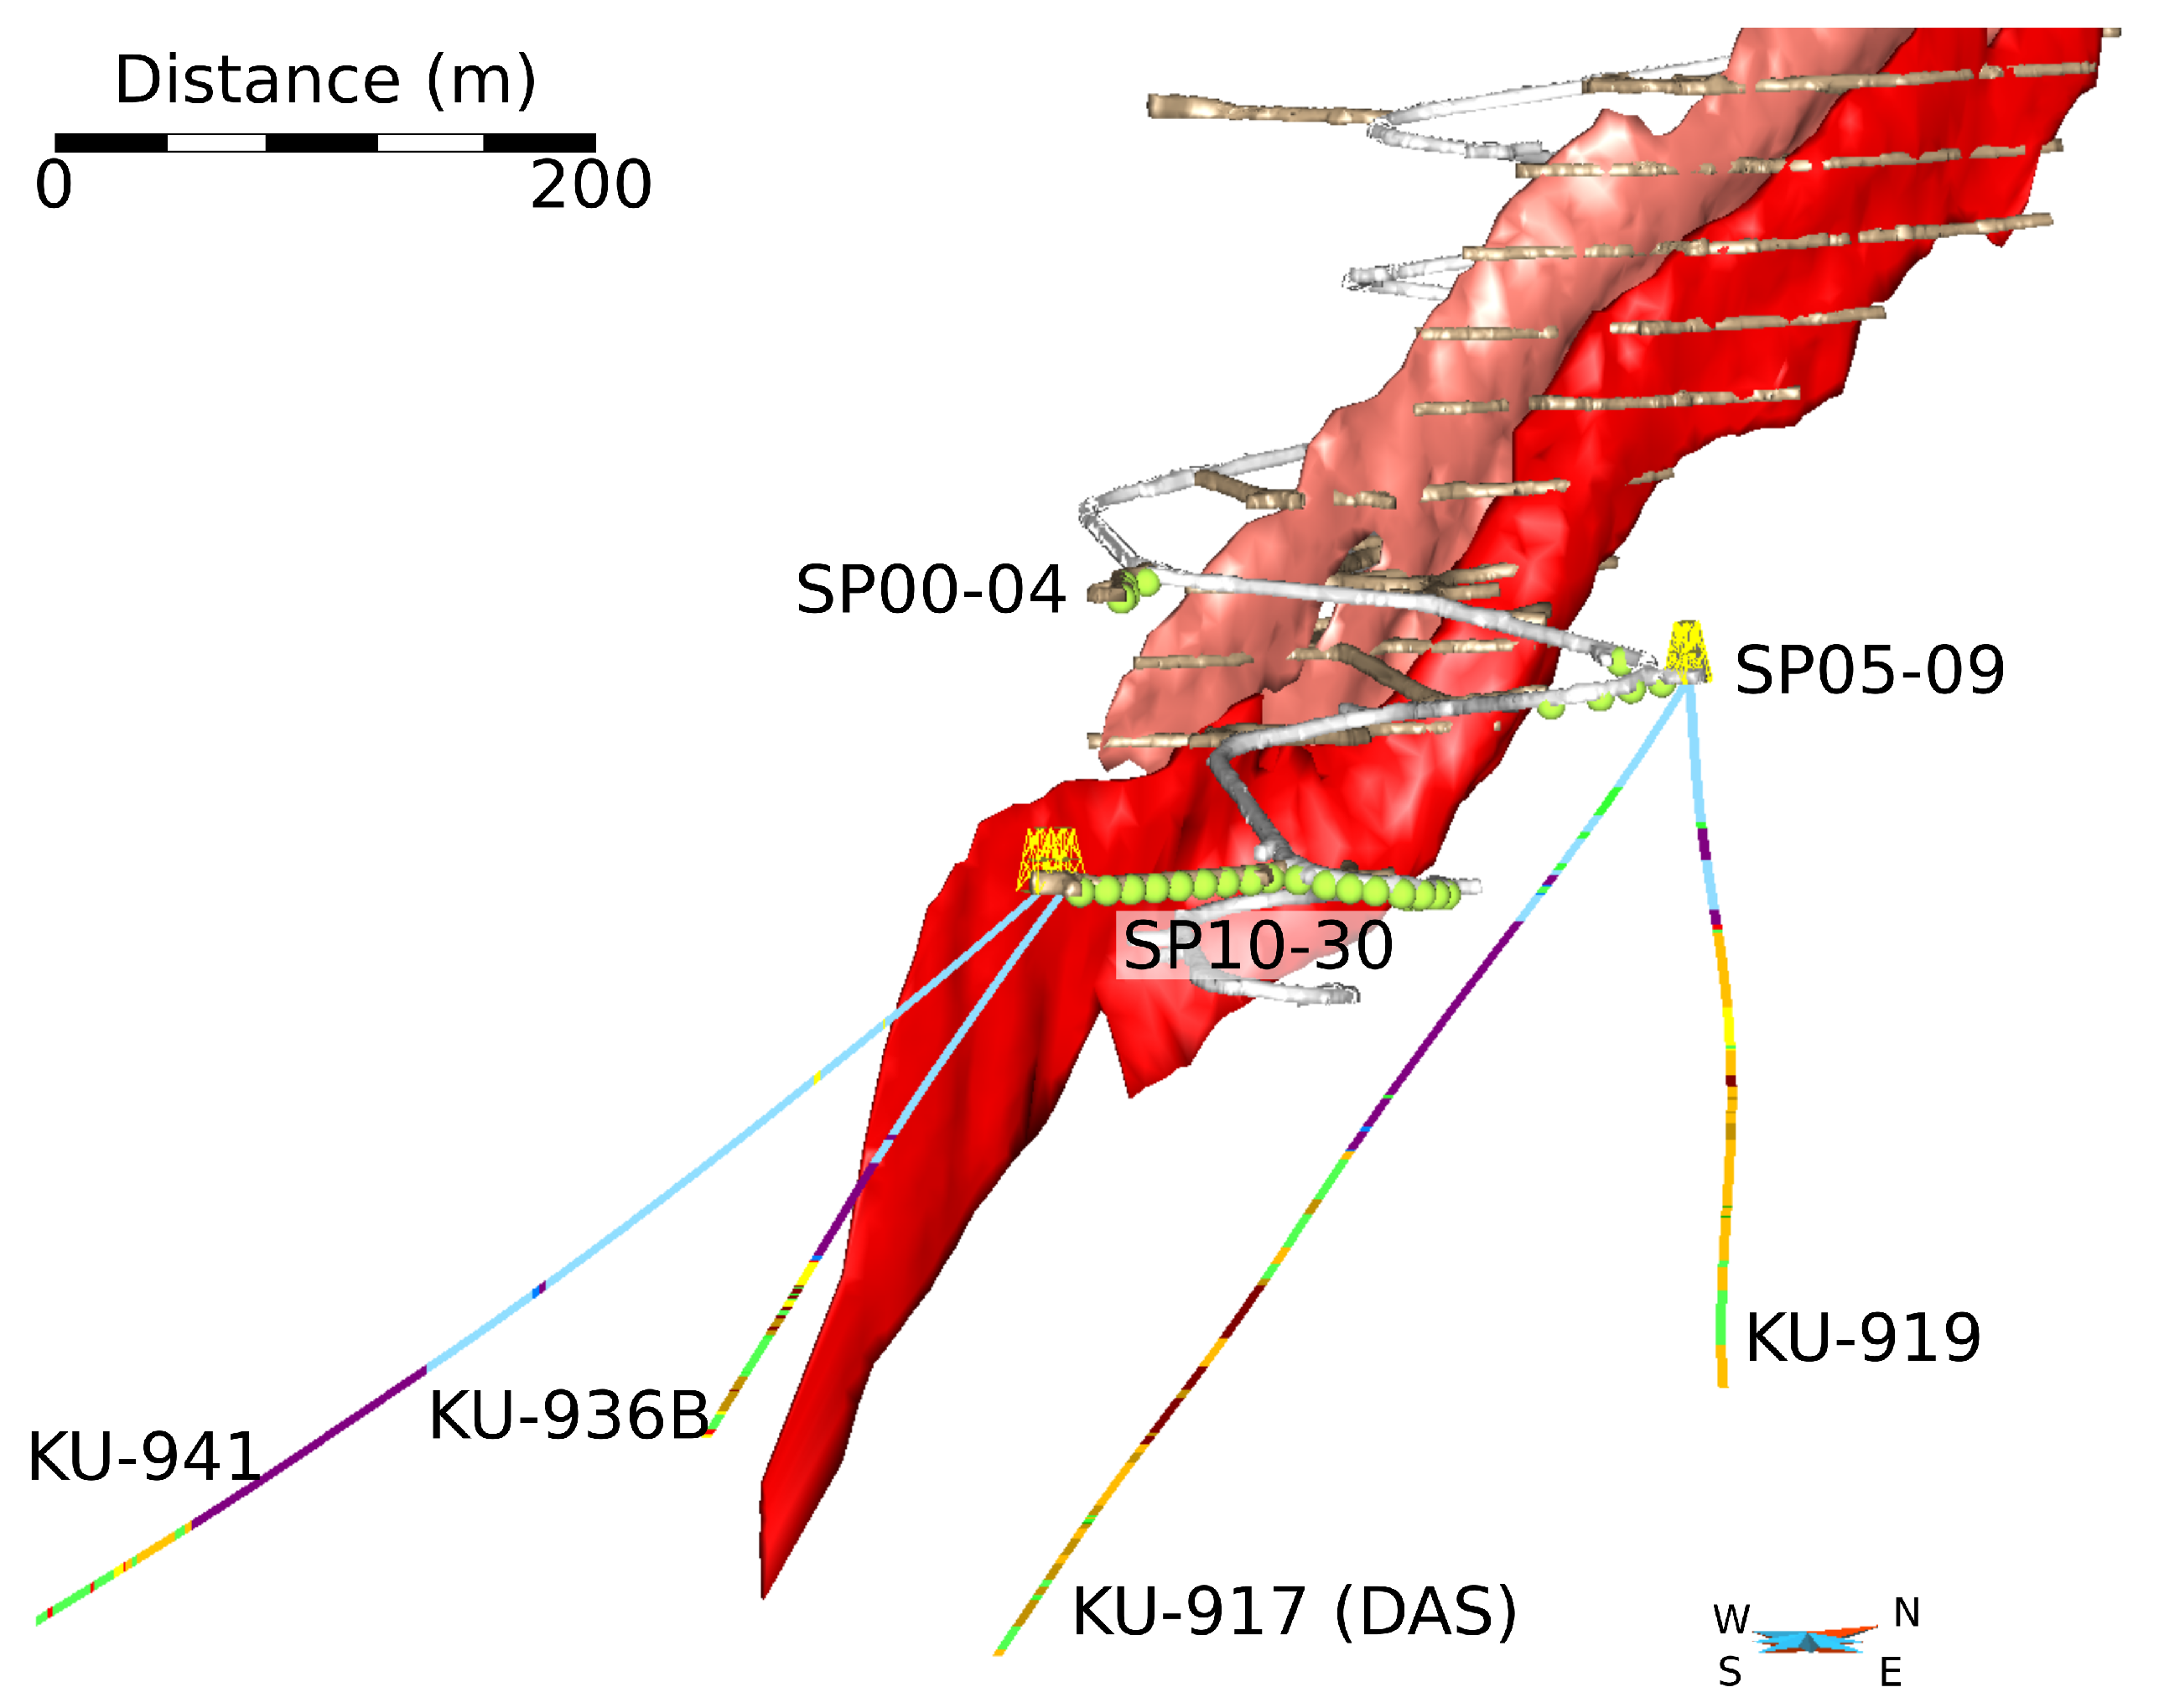
The acquisition configuration of the VSP experiment is shown in
Figure 3 and summarized in
Table 1. In total, four boreholes from prior exploration drilling were used, which are located adjacent to and inclined towards the target mineralization (
Figure 3). The VSP recording systems were deployed in these boreholes. A VIBSIST-200 system was used as a seismic source, which represents a multi-impact, time-distributed source [
50,
51]. The advantages of this system consist of its mobility, the high frequency of the source signal (180 Hz) and the high signal-to-noise ratio that is achieved by stacking of multiple impacts. The source was fired from 31 distinct shot locations inside the mine tunnels. The locations can be grouped into three different depth levels: the first five shots (SP00–04) were located in a tunnel above the mineralization at ≈550 m depth; shots SP05–09 were positioned at ≈580 m along the main decline; and shots SP10–30 were located in a tunnel at 635 m depth below mean sea level. Data recorded from the first group of shots were found to have almost no reflected energy, which is most likely due to the acquisition geometry. Thus, these shots were excluded from the detailed analysis and interpretation later on.
All the boreholes were equipped with a conventional VSP system using three-component (3C) geophones as seismic receivers. Varying geophone spacings along the cable were applied (see
Table 1). Depending on the spacing, the length of the entire recording system varied between 160 m and 240 m. Hence, in order to survey one complete borehole length, the geophone string had to be lowered successively, followed by a repetition of all the associated shots for each new receiver configuration.
3.2. Distributed Acoustic Sensing
In addition to the conventional VSP acquisition, a fiber-optic Distributed Acoustic Sensing (DAS) measurement was also carried out in borehole KU-917. DAS represents a new technology based on Optical Time-Domain Reflectometry (OTDR) [
39,
52,
53]. In contrast to conventional VSP systems, DAS uses one single fiber-optic cable as a continuous sensor, which is connected to a data interrogator unit. The interrogator emits a laser pulse down the cable, which is back-scattered by small material fluctuations within the fiber. If the cable is subjected to elastic strain, this results in a phase difference in the backscattering response, which is measured over a spatial interval along the cable, the gauge length. The phase difference taken over the gauge length is the optical measuring quantity. It is proportional to the subjected strain rate, which is internally computed and output by the interrogator.
The Kylylahti DAS experiment was carried out using the commercial iDAS™ system provided by Silixa Ltd. (Elstree, UK) in combination with a single straight fiber. Due to operational reasons, the cable could not be cemented in the borehole, but rested against the borehole wall. The borehole was filled with water. The borehole inclination ranged between 37 and 42 degrees from the vertical.
In practice, the sampling resolution in the fiber-optic cable is determined by the speed of light throughout the fiber. In our case, the sampling interval was set to 1 m. However, as mentioned above, the system’s output signal represents an average over a spatial window, the gauge length, which depends on the width of the laser pulse. In our study, the gauge length was set to a default value of 10 m, which represents the effective spatial resolution of the system. In principle, this value can be decreased; however, the choice of the optimal gauge length is a trade-off between resolution and signal-to-noise ratio (e.g., [
54]).
DAS allows simultaneous measurement over one cable ranging up to several tens of kilometers. For VSP applications, this implies that no shot repetition is required to survey one borehole. Thus, the reduced logistical effort and high acquisition speed make DAS a promising low-cost alternative for conventional geophone-based systems. So far, DAS has been used in various geoscientific applications, which primarily include monitoring of carbon-sequestration storage sites (e.g., [
55,
56,
57]), hydro-carbon reservoir monitoring (e.g., [
58,
59,
60]) and, recently, noise recording for near-surface traffic monitoring [
61] and in-mine safety applications [
62]. However, to our knowledge, no applications for hardrock mineral exploration had been conducted before this experiment.
4. Processing and Comparison of DAS versus 3C VSP Data
After successful acquisition, geophone VSP and DAS VSP data were processed using a VSP-specific processing flow (
Figure 4). Most elements in the flow were commonly applied to both datasets, except for the component rotation, which was only done for the geophone VSP data. For this, A 3C rotation was used, based on polarity analysis of the first arrival maximum energy direction of incidence. Commonly-applied processing steps include suppression of direct P- and S-wave arrivals, denoising, the time-varying deconvolution method based on adaptive linear filtering techniques, bandpass filtering and amplitude recovery. The specific parameterizations of these steps varied slightly between the DAS and VSP records due to the different nature of the data.
The Image Point (IP) transform [
63] represents a crucial processing step, which allows separation and extraction of target wave energy (e.g., P-wave reflections) in the IP space. Moreover, it provides the basis for further processing steps such as dip filtering and coherency enhancement, which are also carried out in the IP space. Dip filtering was used to emphasize features within a dip range of
from the vertical, which is based on the a priori knowledge of the orientation of the geological contrasts in the area. The processing flow is concluded with 3D IP migration, which provides reflectivity images in 3D space that are used for geological interpretation.
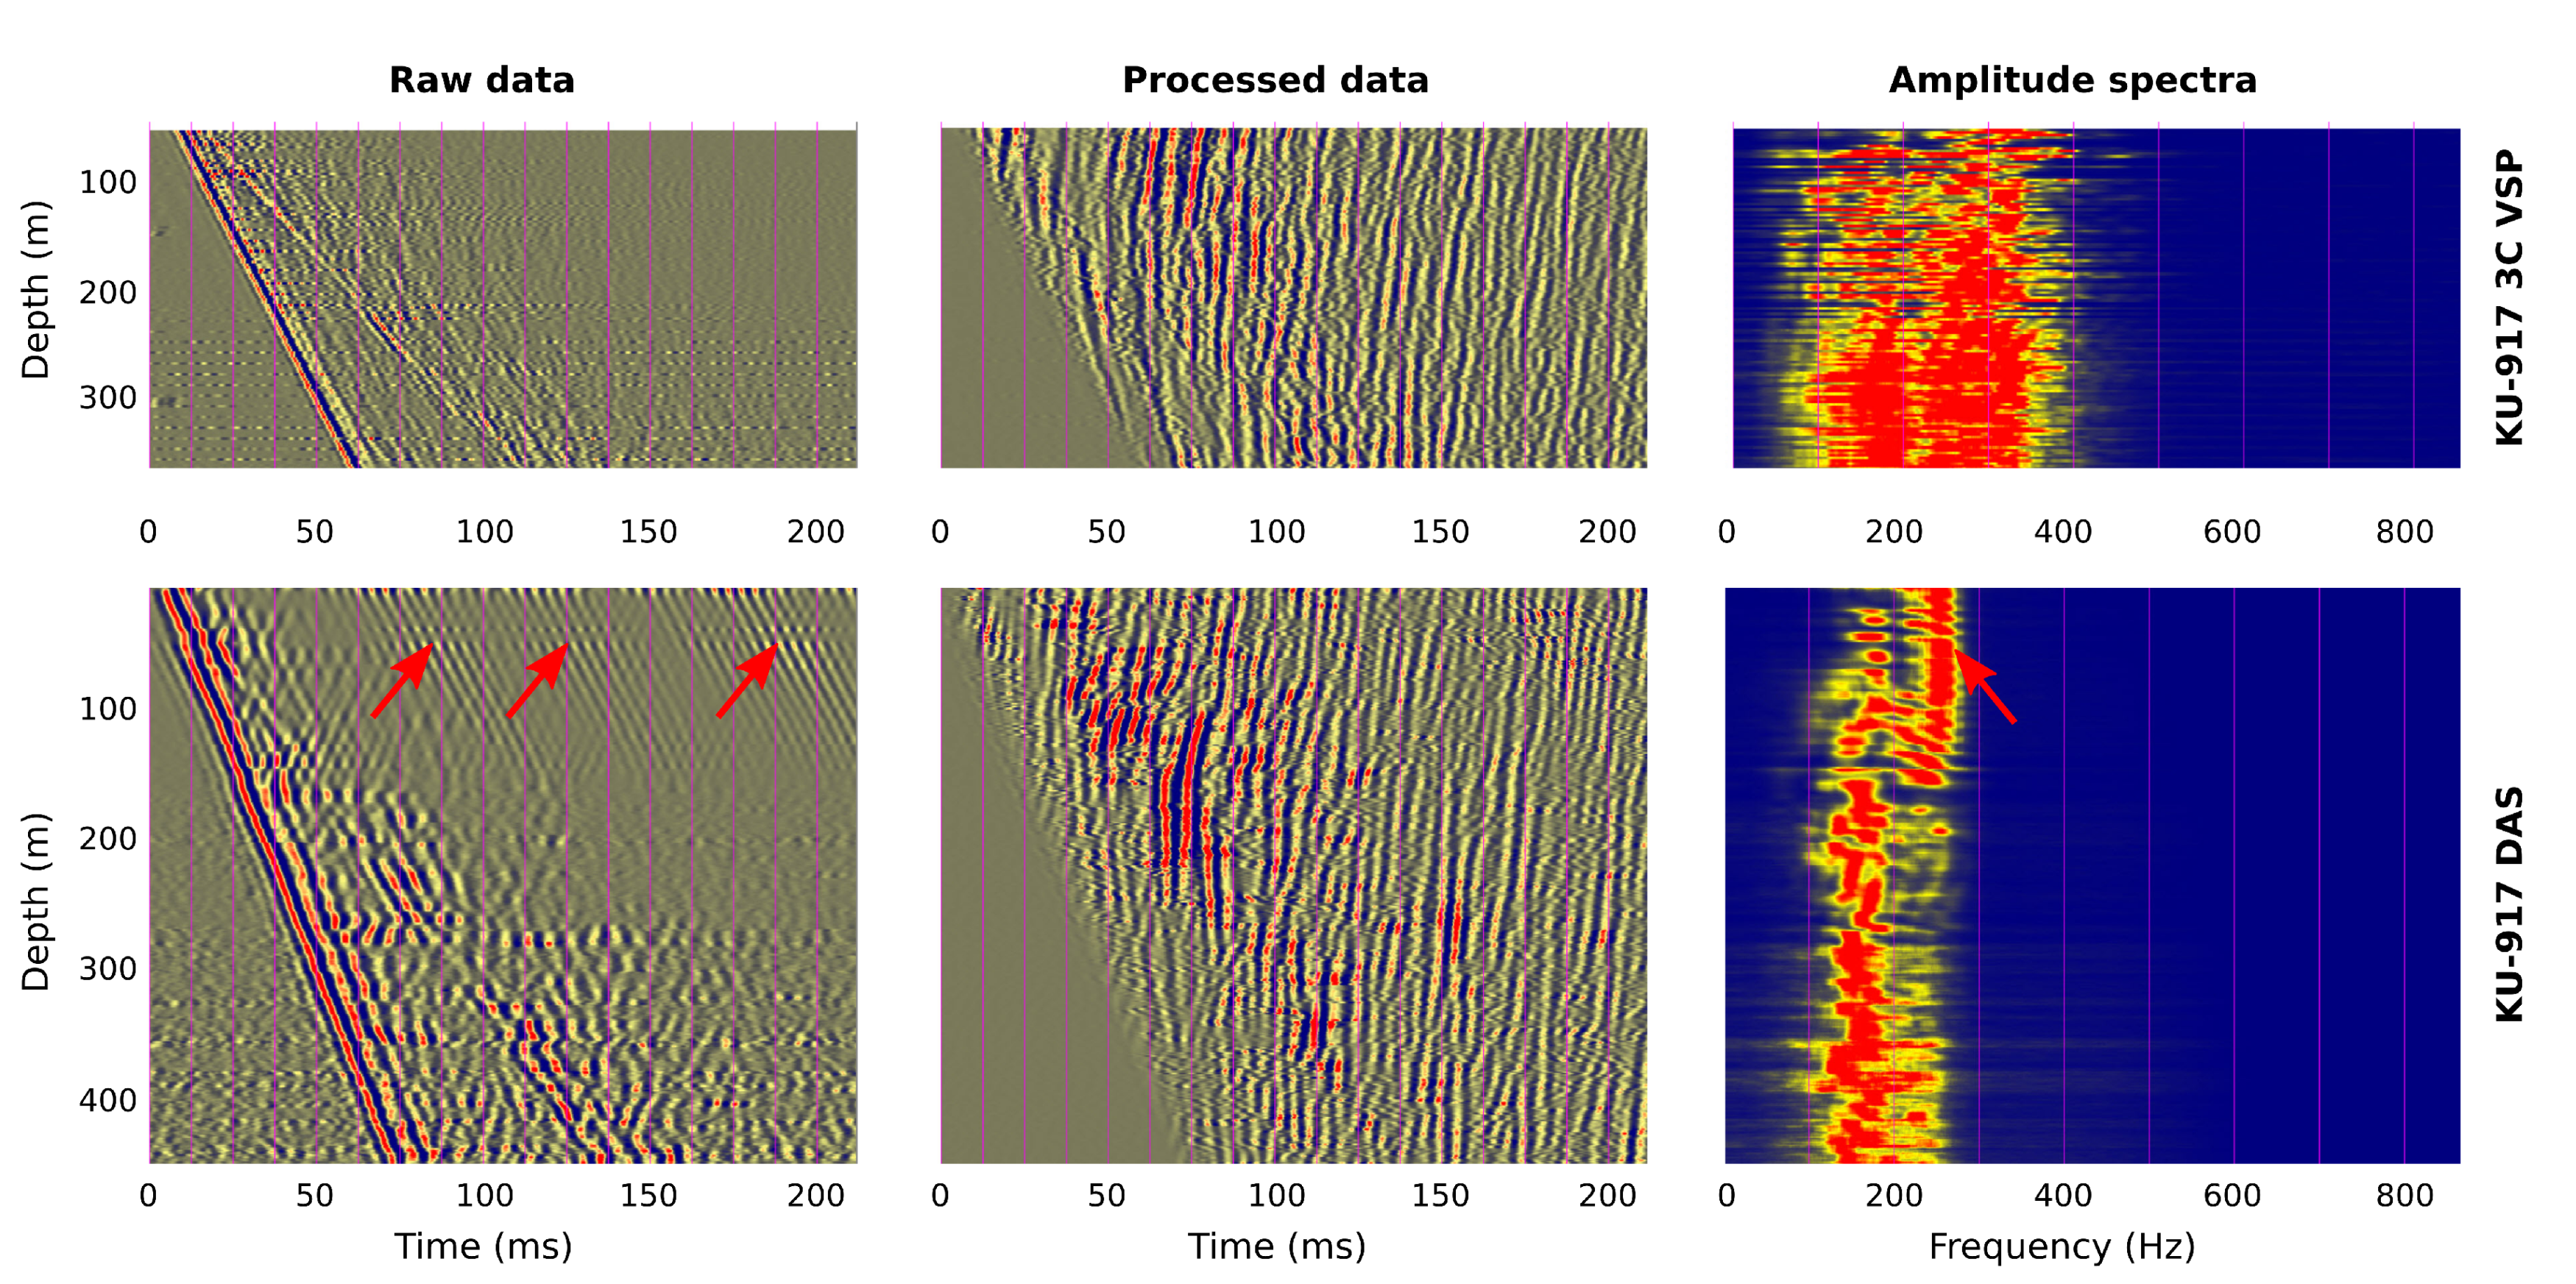
Figure 5 shows a comparison between the geophone VSP and DAS VSP data for shot point SP06 (zero-offset shot; see
Figure 3). It compares the respective shot records before and after processing, as well as the raw amplitude spectra. It has to be noted that the obtained records do not show the same physical quantity, i.e., they show particle velocity for 3C geophones versus strain rate for DAS. Hence, the comparison is mainly restricted to the kinematics of the data. The amplitudes can be compared on a qualitative, but not on a quantitative level.
Comparing the DAS versus geophone records reveals that both datasets share many similarities, but also exhibit some important differences. The raw data show a clear direct P-wave, a slightly less pronounced direct S-wave and some lower-amplitude indications of backscattered energy for both records. In that, the geophone data appear to have a higher signal-to-noise ratio and a higher spatial resolution, which results in an overall crisper appearance of the seismic events. In addition, the DAS record is subject to a strong high-frequency noise signal that is persistent in the top 150 m along the cable. This signal is caused by a lack of cementation of the borehole, which resulted in the fiber resting loosely against the borehole wall and thus producing the observed oscillations. The lack of borehole cementation also may account for the lower signal-to-noise ratio of the DAS due to the inferior coupling.
VSP-specific processing of the raw shot records enhanced the overall signal quality, particularly P-wave reflections, which represent the target signals. In addition, unwanted energy such as direct waves, reverberations and various noise are suppressed. At this point, we observed a slight difference (≈5%) between the average velocities measured from the first arrivals of the geophone and the DAS VSP records. We believe that this is due to uncertainties in the positioning of the virtual DAS receivers. Applying the same processing sequence to geophone VSP and DAS VSP shots significantly narrows the gap between the two datasets in terms of overall quality. Still, the reflections appear slightly more continuous in the geophone VSP record, particularly in the top part of the borehole.
A third comparison is made using the amplitude spectra from both datasets. This confirms the superior bandwidth of the geophone VSP data compared to the DAS records, which particularly effects the high frequency range. In addition, the cable oscillations observed along the top 150 m of the borehole in the shot record also manifest as a clear artifact in the spectrum.
The observation of shorter bandwidth in the DAS might be slightly unexpected and thus deserves more detailed consideration. The geophone VSP data were acquired with a very small geophone spacing of 2.5 m in borehole KU-917, which provides shot records of high resolution. In the case of DAS VSP, the gauge length was set to a default value of 10 m, which represents the effective spatial resolution of the system. In the presented study, the medium velocity along the borehole equals about 6 km/s, as obtained from the first arrivals. From these values, we obtain a maximum detectable frequency of about 300 Hz for the fiber optic system in our case. This corresponds well to the maximum recorded frequency that is observed in the raw amplitude spectra (
Figure 5).
5. Seismic Forward Modeling
Even though seismic processing significantly enhanced the quality of the acquired VSP shots, the understanding and interpretation of the recorded reflections is not a straightforward task. This is mainly due to the geometrical ambiguity inherent to VSP surveys in general, and the complexity of the geological setting at Kylylahti mine site specifically.
For this reason, we conducted a seismic forward modeling experiment to study the wave propagation in the area of interest and to identify key reflections with their geological causes (i.e., rock contrasts). Seismic forward modeling has been utilized to better understand seismic data in hardrock environments in various studies (e.g., [
13,
26,
64,
65]). However, in order to conduct a realistic modeling study, an accurate input model is required.
5.1. Geological and Petrophysical Models
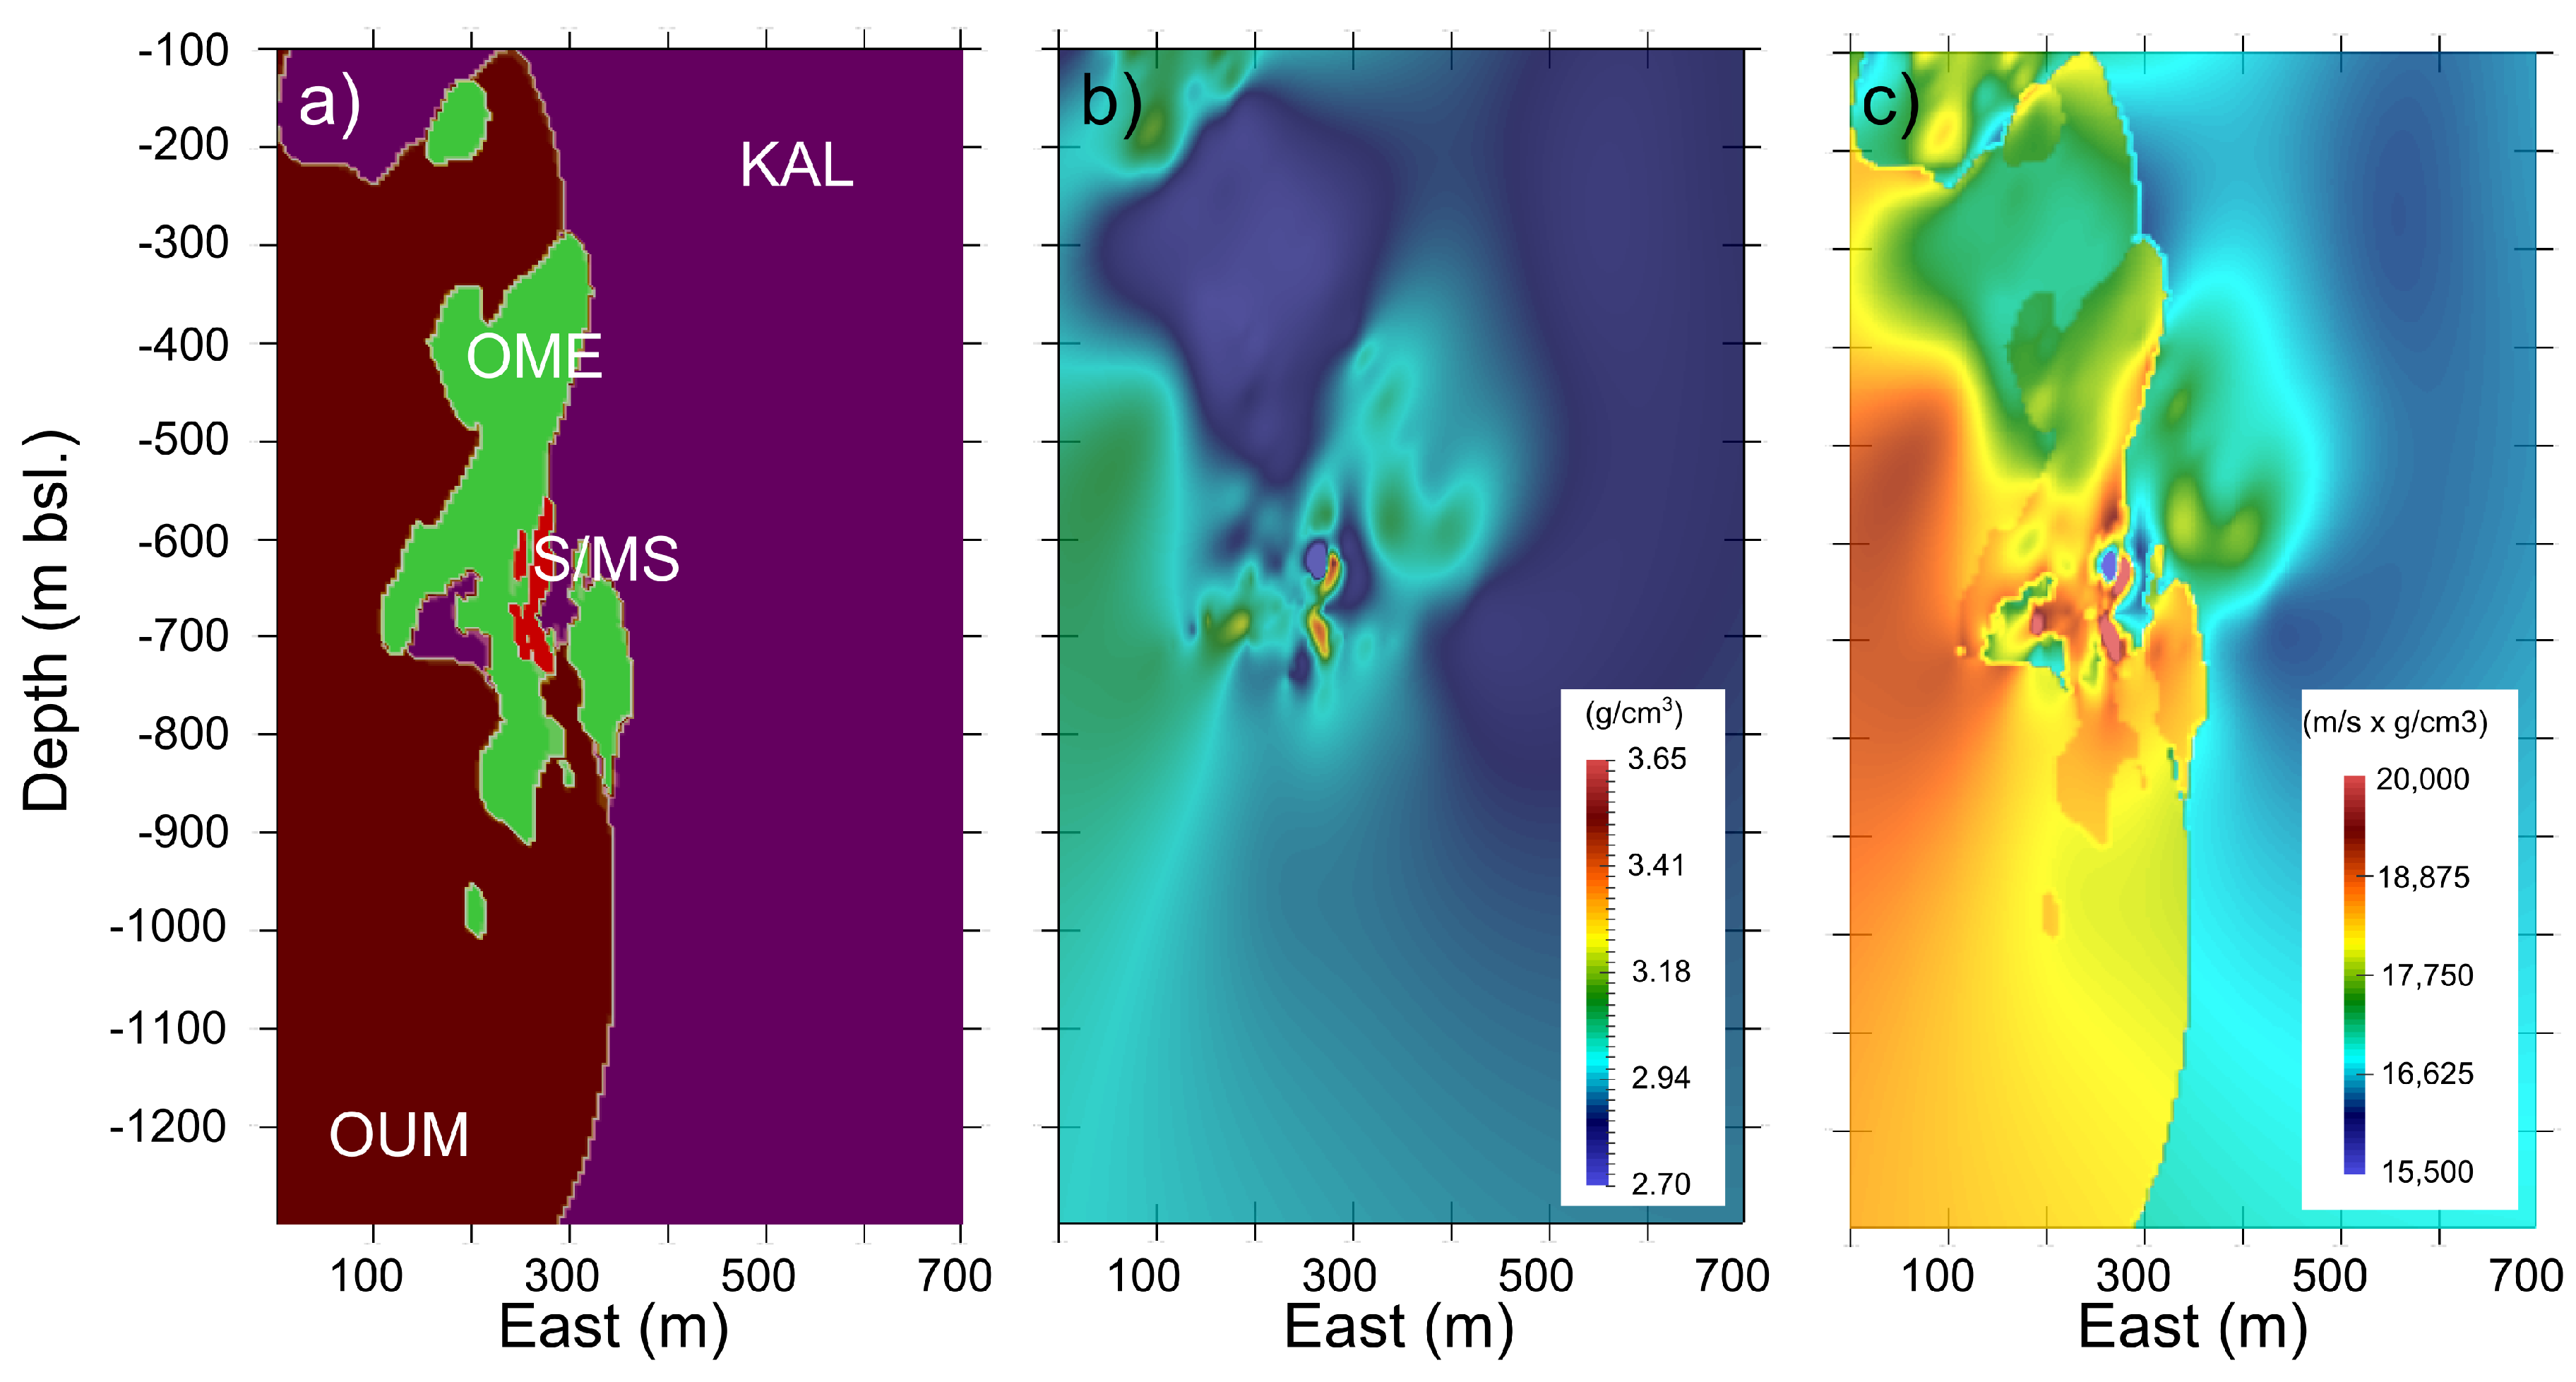
For our study, we used a detailed geological model as a starting point (
Figure 6a). This model was derived from about 1250 boreholes, out of which about 900 are located in the immediate vicinity of the sulfide deposit, and thus provides very detailed information about the predominant lithology. The model divides the geology into the larger dominant geological units that were discussed above: the regional sedimentary rocks (KAL), the Outokumpu assemblage rocks (OME and OUM) and the semi-massive to massive sulfide mineralization (S/MS). For these units, a P-wave velocity model was derived using the average P-wave velocities of the respective dominant rock type for each unit, as determined by the petrophysical laboratory measurements [
49]. The resulting velocity model does not distinguish between the individual rock types, but only between the larger geological units.
In addition to geological logging, specific gravity measurements were routinely made on borehole core samples. Those provide a detailed 3D density model (
Figure 6b) that was used directly in the seismic forward modeling. Both quantities, P-wave velocity and density, form the acoustic impedance (
Figure 6c), which represents the physical cause for seismic reflections. The petrophysical parameters of the modeling domain are summarized in
Table 2.
5.2. Simulation Parameters and Results
For our forward modeling study, we used the free software SOFI3D [
66], which is a viscoelastic, three-dimensional modeling tool using a parallel Finite-Difference (FD) approach. The modeling code SOFI3D (git-master-275248a88, 14 July 2016, Karlsruhe Institute of Technology, Karlsruhe, Germany) is capable of viscoelastic modeling; however, we only did elastic modeling, i.e., no attenuation was included in this study. Furthermore, no petrophysical data were available for S-wave velocities. Thus, those were scaled from the P-wave velocity data by a constant factor of 1/sqrt(3). We combined the constructed input models with the VSP acquisition geometry that was used in the Kylylahti survey (
Figure 3). With this setup, we computed synthetic VSP shot records along boreholes KU-917 (DAS and 3C VSP configurations), KU-936B and KU-941. As a source signal, we used a Ricker wavelet with a central frequency of 180 Hz, which equals the dominant frequency of the acquired VIBSIST-200 records. All key parameters are summarized in
Table 3.
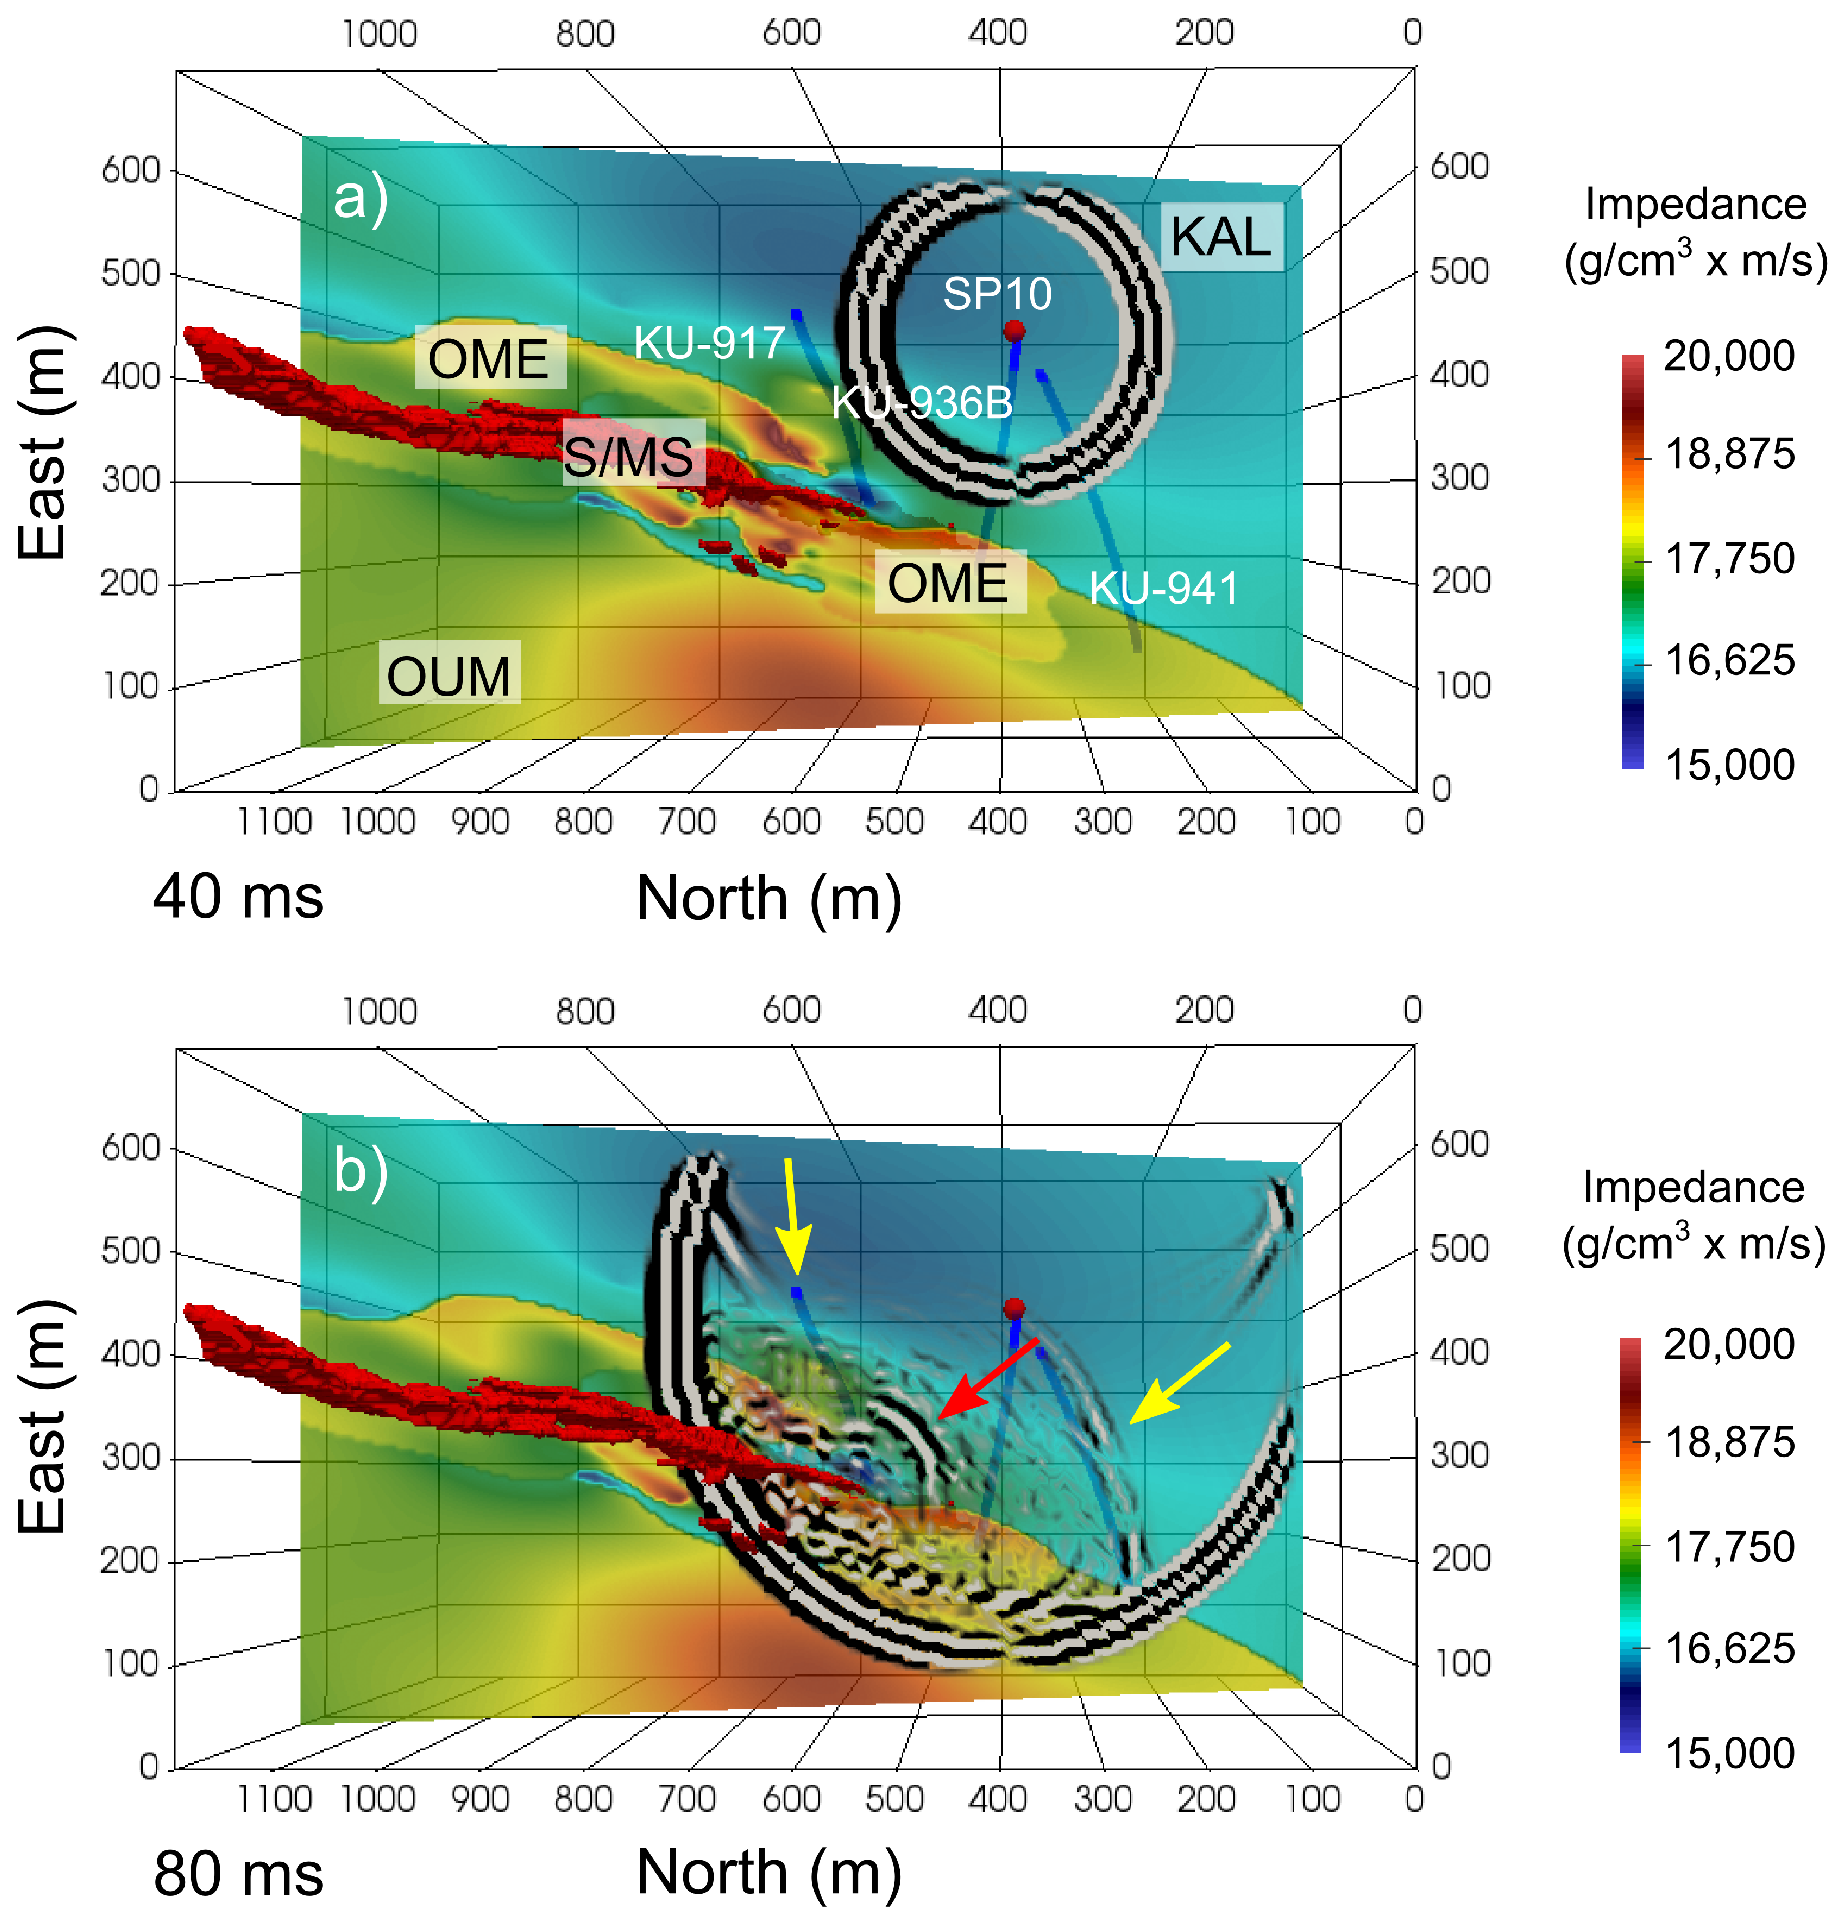
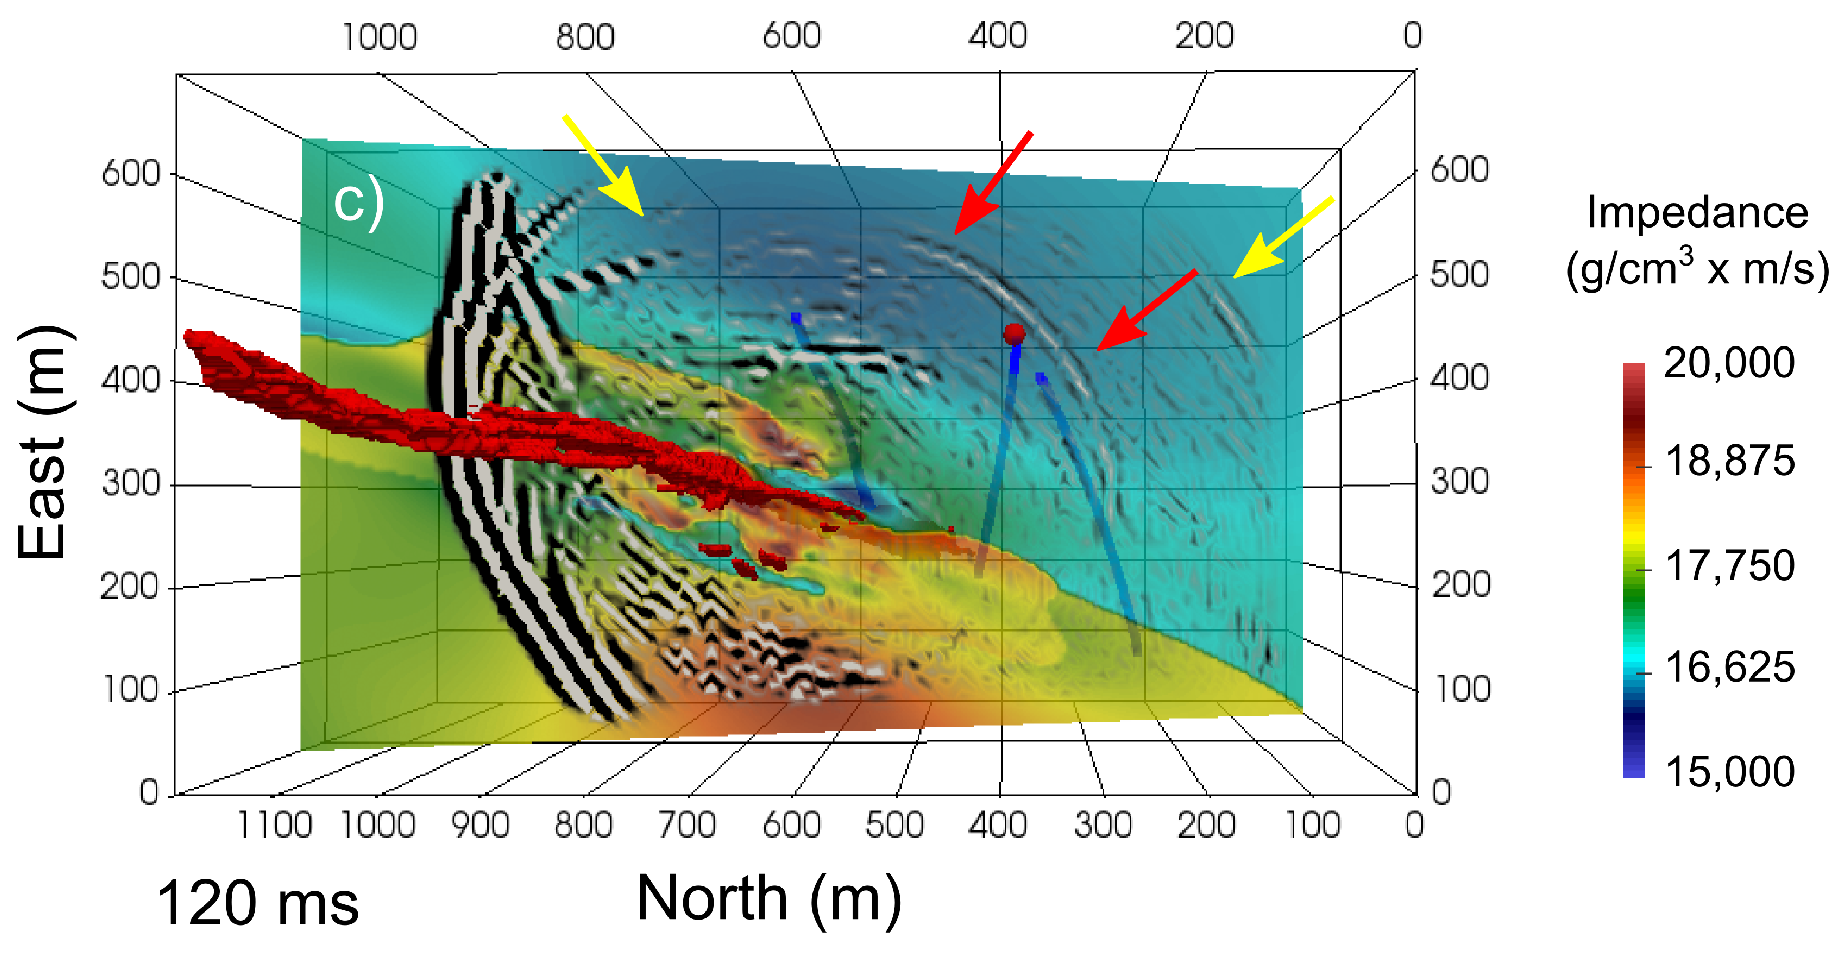
The forward modeling experiment provides synthetic VSP shot records and wavefield snapshots that can be tracked through the input model.
Figure 7 shows three snapshots at three different time steps. They illustrate how the seismic wavefield propagates from one of the VIBSIST-200 shot locations (SP10) towards the mineralization zone and gets reflected back from the various geological contrasts. The simulation helps to understand the complexity of the recorded seismic wavefield, identify the most dominant reflections and link them to their geological causes.
A selection of synthetic shot records obtained form the simulation is shown in
Figure 8. In combination, the synthetic data and snapshots reveal that the first strong signal that is recorded by the VSP receivers (yellow arrow in
Figure 7 and
Figure 8) originates not directly from the target S/MS deposit, but from the contrast between the Kaleva sediments (KAL) and the Outokumpu alteration fringes (OME). The sulfide reflection (red arrow in
Figure 7 and
Figure 8) appears later in the synthetic shot record and is more difficult to identify than the previous one. These observations help in guiding the geological interpretation of the migrated shot records.
6. VSP Imaging and Interpretation
6.1. Comparison of 3C, DAS and Synthetic Migrated Images
The synthetic VSP shots were processed alongside the acquired data and finally migrated using 3D image point migration. The VSP migration maps the processed VSP records from the time-domain into 3D space, in a similar way as common-shot pre-stack depth migration does for surface-based seismic data. We used a constant velocity of 6 km/s, which represents the average velocity that was derived from the VSP first-arrivals. As a result, we obtain migrated VSP records for each shot-borehole configuration. These individual images could not be unambiguously stacked together due to the uneven shot layout, which is limited to accessible mine infrastructure. Thus, the obtained images were primarily interpreted separately.
Figure 9 shows a comparison of resulting images from shot SP06 that were recorded using the conventional geophone and the DAS VSP, respectively. In addition, these recorded data are compared to a synthetic VSP shot that was processed and migrated in the same manner. All images are directed in an approximately perpendicular direction towards the location of the known sulfide deposit.
The comparison reveals similarities and differences between the results of the two recording technologies. In the area between the shot position and the sulfide deposit, both acquired VSP images evidence reflections from the predominant geological contrasts KAL-OME and S/MS, which are also contained in the synthetic image. Moreover, the acquired data reveal a contrast between the mica schist and black schist (MCAS-BS) units, which is not contained in the forward model and therefore does not exist in the synthetic image.
The reflection from the target sulfide deposit (S/MS) is evidenced by all images; however, it does not appear as clearly in the acquired datasets as it is in the synthetic shot. In general, the synthetic reflections appear more coherent, which naturally can be attributed to the simplifications of the model (compared to reality), the absence of mine tunnel structures and the absence of noise in the synthetic data.
West of the S/MS mineralization lens, the acquired images show several reflections, which originate from rock contrasts within the Outokumpu assemblage zone (OME and OUM). As far as the existing boreholes extend to the west, the imaged contacts were checked against the available logging data.
Here, the agreement between the synthetic and the acquired data images is less clear, since the velocity model does not differentiate between rock types in that area. Thus, synthetic reflections are mainly caused by variations in the density model and therefore less pronounced.
In addition to the reflections that occur in the close vicinity of the sulfide mineralization, there are a number of other features located further to the west in the acquired images (e.g., Reflection 11). These features get weaker with further distance from the source locations due to the loss of seismic energy. As the coverage of boreholes rapidly decreases west of the target deposit, the geological model only contains very little information in that area. For that reason, the synthetic migrated image does not extend into the far west.
In terms of quality, the differences between finally migrated images obtained from the conventional geophone and the DAS VSP are less significant than between their respective raw shot gathers as a result of the applied data processing. The DAS VSP extends a bit further in depth due to the longer borehole coverage of the fiber-optic cable. The 3C data still appear slightly superior in terms of spatial resolution than the DAS. In particular, the target sulfide reflection is more pronounced in the geophone data. Moreover, the MCAS-BS and KAL-OME reflections are overprinted by coherent noise artifacts in the DAS image, which result from the cable ringing in the top parts of the borehole, as already described in the raw data comparison.
6.2. Geological Interpretation and Correlation with Borehole Data
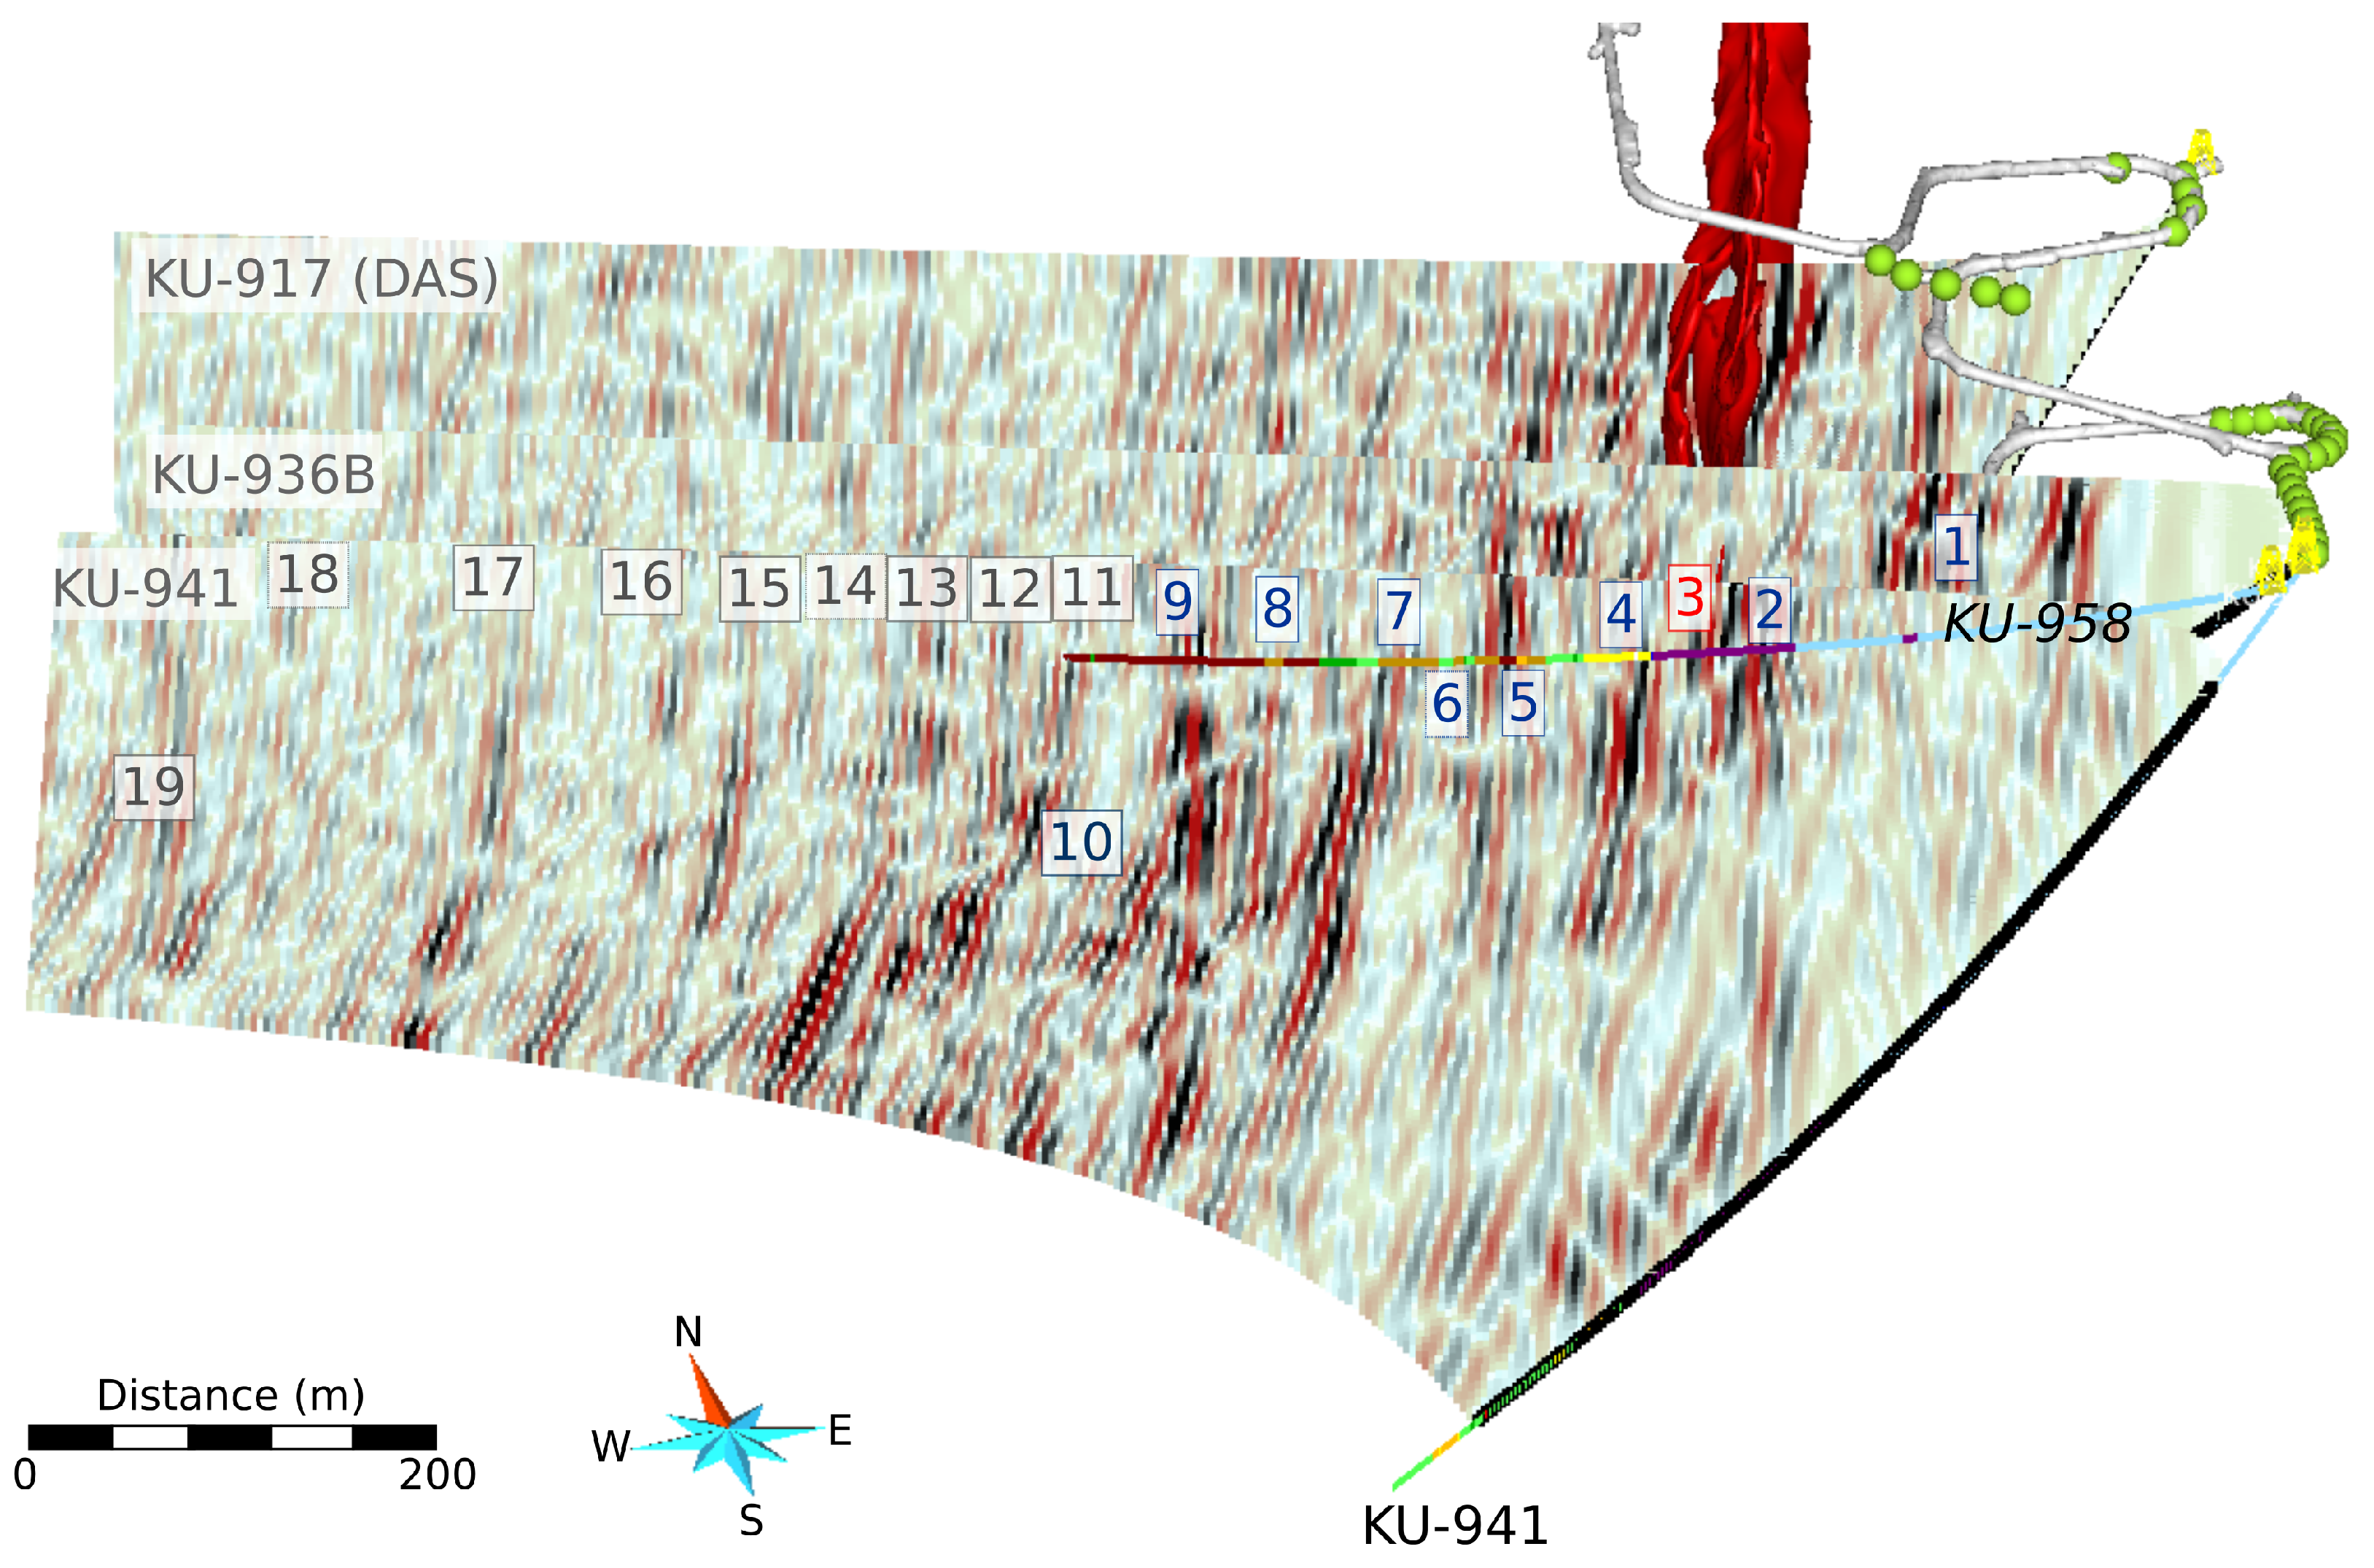
In total, 83 individual migrated shot records were obtained from the acquired VSP data. These images were analyzed jointly to trace predominant reflections through the illuminated area parallel to the target sulfide mineralization (
Figure 10). In this way, 19 distinct reflections were identified that were evidenced by the majority of the computed reflectivity images. In particular, 14 out of 19 contrasts were evidenced by at least 65%, and six out of 19 (Reflections 3–8) were evidenced by at least 75% of the migrated images. Most of the less supported features occur further to the west.
Direct relation of the identified reflections to their petrophysical causes is often ambiguous due to the highly complex and rapidly changing geology that particularly characterizes the Outokumpu assemblage rocks. Nevertheless, cross-validation of the migrated images with logging data from 135 intersecting or adjacent boreholes found that Reflections 1–8 and 10 can be attributed to lithological contrasts (
Table 4). Reflections 11–19 are too far away from the target sulfide deposit, and thus, no logging data are available to support these features.
The majority of the boreholes used for correlation were drilled before the Kylylahti survey was conducted in order to explore the immediate vicinity of the target sulfide lens. However, some boreholes were drilled after the campaign. In particular, borehole KU-958 was drilled nearly horizontally through the formation in order to validate the predicted features that had been obtained from the initial interpretation of the VSP survey.
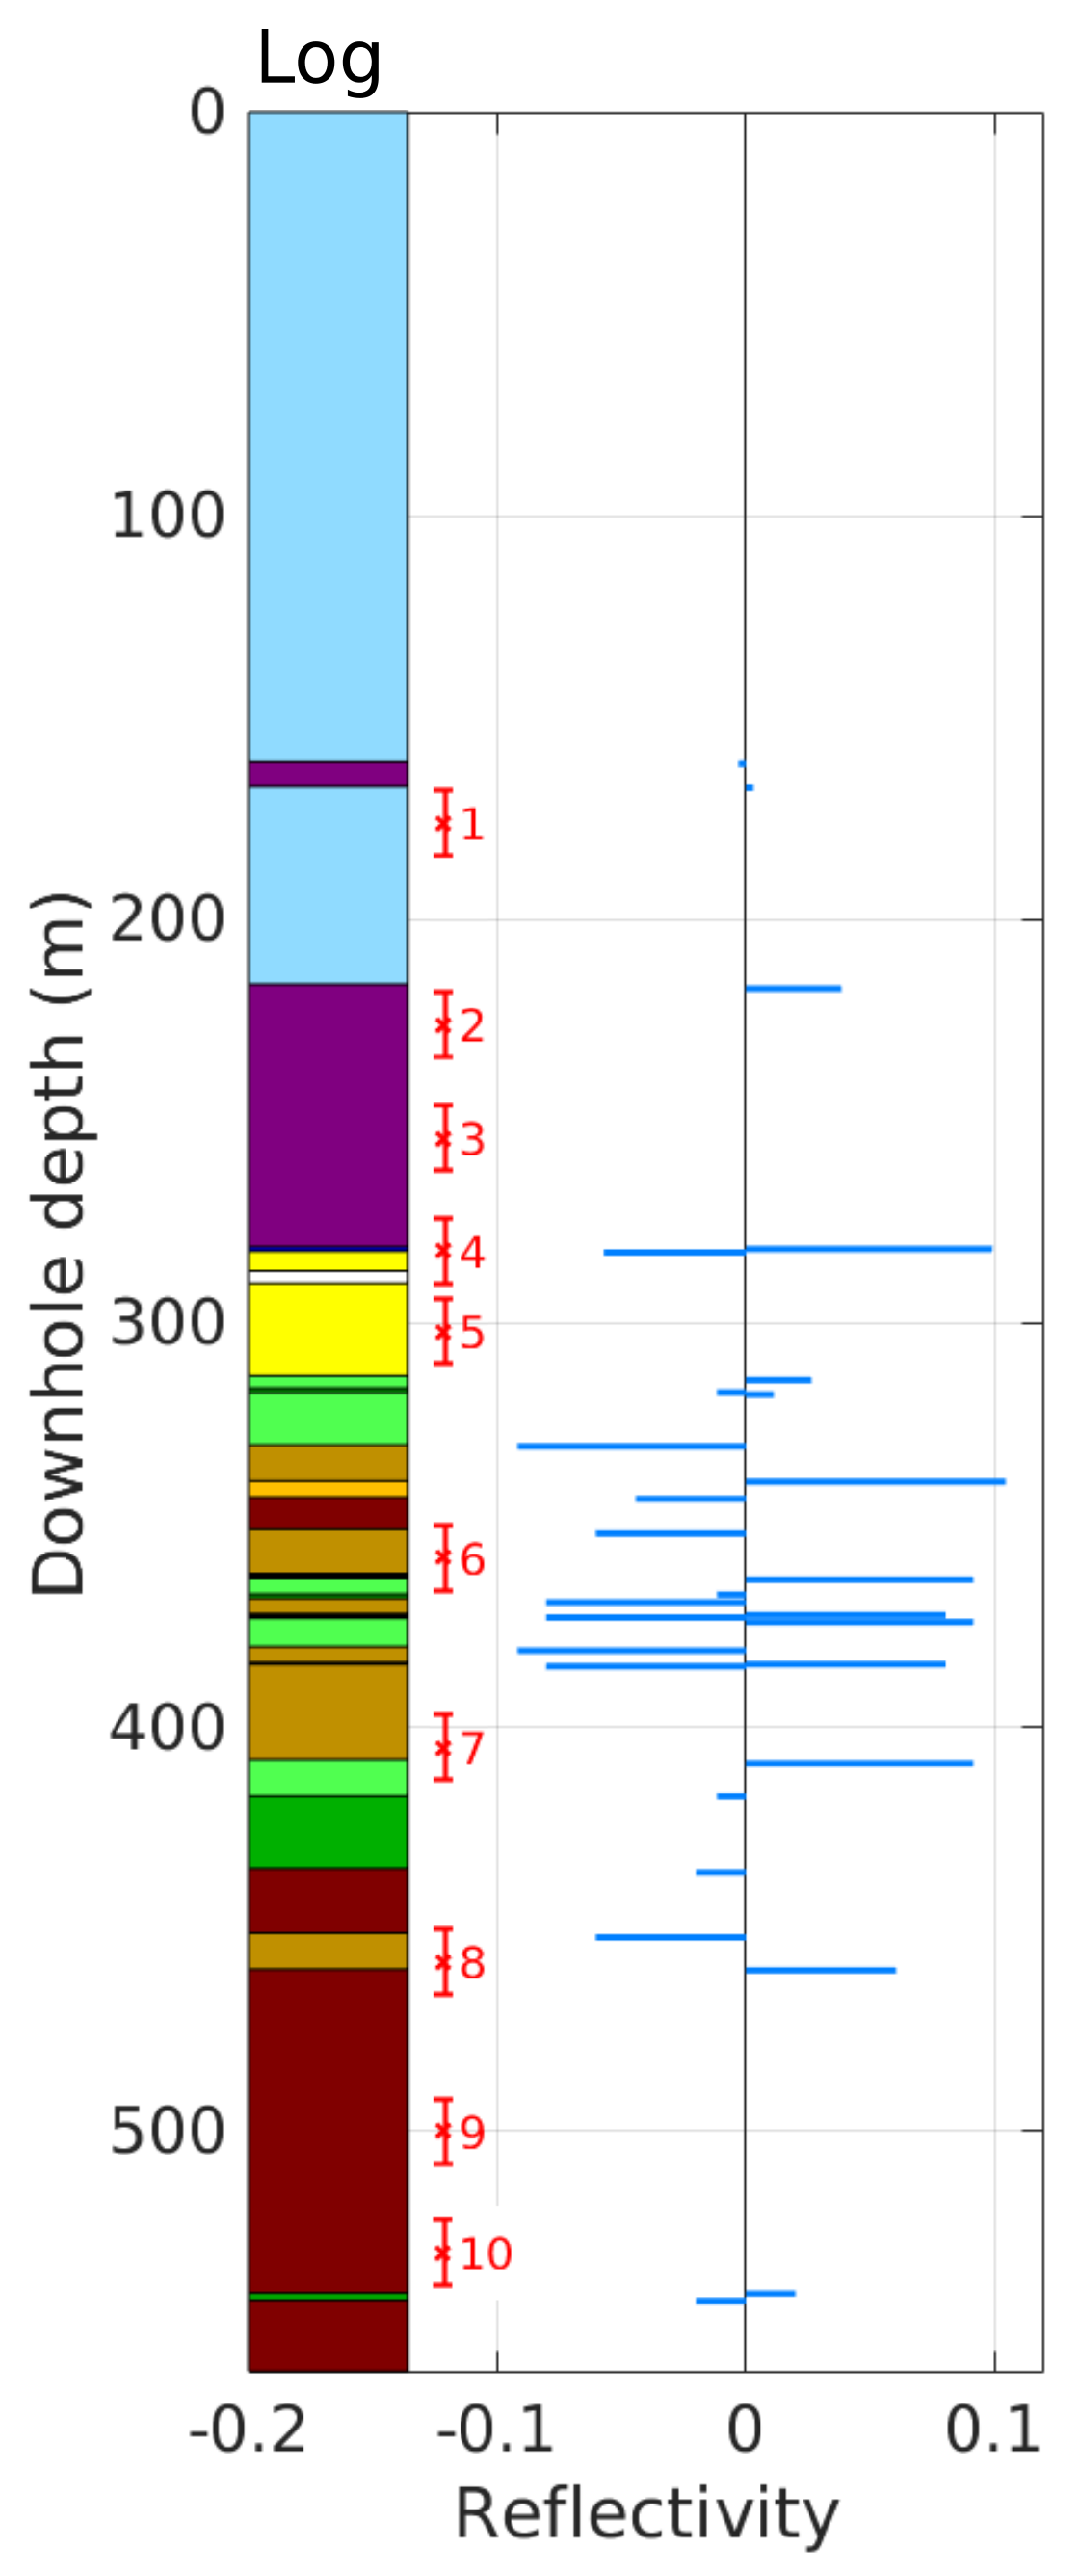
Figure 11 shows a comparison between the KU-958 log, a synthetic reflectivity series derived from petrophysical measurements of the logged rock types, and the identified reflections from the closest migrated image. It demonstrates how most reflections identified from VSP migration results correspond to lithological contrasts evidenced in the borehole log. Very closely-spaced interfaces (e.g., between Reflections 4 and 7) could not be individually resolved by the VSP method due the inherent limitations of spatial resolution. The dominant P-wavelength (16.1 m) is depicted by error intervals in
Figure 11. Moreover, Reflectors 2, 3 and 9 are not evidenced in the log.
Feature 2 most likely corresponds to a black schist to carbonate rock contrast; Feature 3 represents the target sulfide mineralization. Due to the rapidly changing and complex geology in that zone, it is possible that these contrasts simply do not extend far enough to the south to “reach” borehole KU-958, and hence, they are not evidenced in the log. However, their existence is supported by numerous other boreholes (
Table 4).
In contrast, Reflector 9 is located too far to the west, and thus, no other exploration boreholes are available to be used for correlation.
7. Discussion and Conclusions
The Kylylahti underground VSP experiment presented in this study provides several important conclusions. In more general terms, it demonstrated the potential value of underground VSP measurements for mineral exploration and resource delineation, which is due to various reasons. (1) The underground VSP measurements are conducted in close proximity to the imaging target. (2) They are not affected by the overburden layer. (3) The use of borehole acquisition provides better illumination of steeply-dipping geological features. (4) The data provide very high spatial resolution, which allows precise mapping of geological contrasts.
However, the inherent directional ambiguity of VSP measurements also requires complementary information from geological logging and potentially surface-seismic data. These data provide important input for optimizing VSP processing parameters in order to constrain the dips and azimuths of recorded reflected signatures.
In this study, migrated VSP images from 83 shot records were analyzed individually and cross-validated against 135 boreholes that had been drilled in the target area. This joint analysis enabled identification of 19 pronounced reflectors from the VSP images that area supported by the majority of the migrated shot records. Ten out of the 19 reflectors are within the reach of existing boreholes and thus are additionally supported by borehole logging data. The remaining nine reflectors are located outside of the explored area and thus cannot be validated by boreholes, but may represent future drilling targets. The analysis confirms that underground VSP surveys are capable of precise mapping of geological contrasts and resource delineation and thus can be used complementary to surface-based seismic methods, which usually operate on a larger scale.
More specifically, this study focuses on the application and comparison of a conventional geophone VSP and a fiber-optic DAS recording system. Both technologies successfully recorded seismic reflections arising from nearby geological contrasts. The obtained data records were processed and imaged alongside each other using the same workflow. Based on the results, we conducted a qualitative comparison of the raw and the processed data obtained from both recording systems.
As a general conclusion, the conventional VSP data were found to be superior with respect to the signal-to-noise ratio and bandwidth, which results in a better spatial resolution of the conventional 3C geophone system. The resolution of the DAS is effectively governed by the gauge length applied during the survey. In addition, the DAS system was more prone to noise in the absence of borehole cementation. Furthermore, the DAS naturally cannot provide three-component data, but only outputs one component. Despite these differences, data processing narrowed the gap in terms of overall quality between the systems. Eventually, both technologies provided valuable reflectivity images that were used for joint geological interpretation.
The main benefit of the DAS technology is its low logistical effort and ability to acquire data over the whole length of the borehole at once, which makes the data acquisition faster, reduces the required number of shots and therefore the cost for surveying a complete borehole. For this reason, DAS can either be used to accomplish a VSP survey in much less time or it can be used to survey additional boreholes in order to increase the illumination of the imaging target. We believe that the value of acquiring additional data from different boreholes outweighs the benefits of the three-component nature of conventional VSP data in terms of target illumination. Of course, this requires the availability of additional boreholes and shot point locations, which would improve azimuthal coverage of the target.
We conclude that DAS VSP surveys provide a very promising tool for mineral exploration and mine planning. We believe that the application of in-mine VSP surveys could generally be used to plan ongoing exploration drilling more strategically and thus potentially reduce the number of required boreholes. With the use of DAS technology, this approach would become even more efficient.
Author Contributions
Conceptualization, C.C., N.E., E.K. Data curation, M.R., N.E., C.C., E.K. Formal analysis, M.R., C.C., N.E., K.K. Funding acquisition, E.K., C.C., N.E., M.M. Investigation, M.R., C.C., N.E., K.K., K.V. Methodology, C.C., N.E., M.R., K.K., E.K. Project administration, E.K., N.E. Resources, C.C., N.E., E.K., K.V. Software, C.C., N.E., M.R., K.K. Supervision, E.K. Validation, M.R., C.C., K.V., E.K. Visualization, M.R., C.C., N.E. Writing, original draft, M.R. Writing, review and editing, E.K., C.C., N.E., M.M., K.V.
Funding
This research was coordinated by the European Research Area—Network on the Industrial Handling of Raw Materials for European Industries (ERA-MIN). We gratefully acknowledge funding provided by Business Finland (formerly Innovaatiorahoituskeskus Tekes) and the Polish National Centre for Research and Development (NCBR), which covered the presented study.
Acknowledgments
We thank the Finnish IT Center for Science (CSC) for providing high-performance computing resources for this study. GOCAD Mining Suite was used for 3D visualization and modelling. Special thanks go to all field workers and student helpers for their invaluable contribution to the field survey.
Conflicts of Interest
The authors declare no conflict of interest.
Abbreviations
The following abbreviations are used in this manuscript:
| 3C | Three-component |
| BS | Black schist |
| DAS | Distributed Acoustic Sensing |
| FD | Finite-difference |
| KAL | Kaleva sedimentary belt |
| MCAS | Mica schist |
| OME | Altered Outokumpu ultramafics |
| OUM | Outokumpu ultramafics |
| S/MS | Semi-massive to massive sulfide |
| VSP | Vertical Seismic Profiling |
References
- Eaton, D.; Milkereit, B.; Salisbury, M. Hardrock seismic exploration: Mature technologies adapted to new exploration targets. In Hard Rock Seismic Exploration; Eaton, D.W., Milkereit, B., Salisbury, M.H., Eds.; SEG: Tulsa, OK, USA, 2003; pp. 1–6. [Google Scholar]
- Malehmir, A.; Durrheim, R.; Bellefleur, G.; Urosevic, M.; Juhlin, C.; White, D.J.; Milkereit, B.; Campbell, G. Seismic methods in mineral exploration and mine planning: A general overview of past and present case histories and a look into the future. Geophysics 2012, 77, WC173–WC190. [Google Scholar] [CrossRef]
- Malehmir, A.; Koivisto, E.; Manzi, M.; Cheraghi, S.; Durrheim, R.; Bellefleur, G.; Wijns, C.; Hein, K.A.A.; King, N. A review of reflection seismic investigations in three major metallogenic regions: The Kevitsa Ni-Cu-PGE district (Finland), Witwatersrand goldfields (South Africa), and the Bathurst Mining Camp (Canada). Ore Geol. Rev. 2014, 56, 423–441. [Google Scholar] [CrossRef]
- Pretorius, C.C.; Muller, M.R.; Larroque, M.; Wilkins, C. A review of 16 years of hard rock seismics on the Kaapvaal Craton. In Hard Rock Seismic Exploration; Eaton, D.W., Milkereit, B., Salisbury, M.H., Eds.; SEG: Tulsa, OK, USA, 2003; pp. 247–268. ISBN 978-1-56080-239-6. [Google Scholar]
- Eaton, D.W.; Adam, E.; Milkereit, B.; Salisbury, M.; Roberts, B.; White, D.; Wright, J. Enhancing base-metal exploration with seismic imaging. Can. J. Earth Sci. 2010, 47, 741–760. [Google Scholar] [CrossRef]
- Salisbury, M.; Snyder, D. Application of Seismic Methods to Mineral Exploration. In Mineral Deposits of Canada: A Synthesis of Major Deposit-Types, District Metallogeny, the Evolution of Geological Provinces, and Exploration Methods; Special Publication No. 5; Goodfellow, W.D., Ed.; Geological Association of Canada, Mineral Deposits Division: St. John’s, NL, Canada, 2007; pp. 971–982. [Google Scholar]
- Urosevic, M.; Ganesh, B.; Marcos, G. Targeting nickel sulfide deposits from 3D seismic reflection data at Kambalda, Australia. Geophysics 2012, 75, 123–132. [Google Scholar] [CrossRef]
- Bellefleur, G.; Schetselaar, E.; White, D.; Miah, K.; Dueck, P. 3D seismic imaging of the Lalor volcanogenic massive sulfide deposit, Manitoba, Canada. Geophys. Prospect. 2015, 63, 813–832. [Google Scholar] [CrossRef]
- Cheraghi, S.; Malehmir, A.; Bellefleur, G. 2D seismic reflection imaging in the Brunswick No. 6 massive sulfide and iron deposits, Bathurst Mining Camp, Canada: Implications for crustal architecture and mineral potential. Tectonophysics 2011, 506, 55–72. [Google Scholar]
- Hajnal, Z.; Takacs, E.; Annesley, I.R. Uranium mineralization indicators from seismic and well log data in the Shea Creek area at the southern margin of the Carswell impact structure, Athabasca Basin, Canada. Geophys. Prospect. 2015, 63, 861–880. [Google Scholar] [CrossRef]
- Malehmir, A.; Bellefleur, G. 3D seismic reflection imaging of VHMS deposits, Insights from reprocessing of the Halfmile Lake data, New Brunswick, Canada. Geophysics 2009, 74, B209–B219. [Google Scholar] [CrossRef]
- Dehghannejad, M.; Juhlin, C.; Malehmir, A.; Skyttä, P.; Weihed, P. Reflection seismic imaging of the upper crust in the Kristineberg mining area, northern Sweden. J. Appl. Geophys. 2010, 71, 125–136. [Google Scholar] [CrossRef]
- Dehghannejad, M.; Bauer, T.; Malehmir, A.; Juhlin, C.; Weihed, P. Crustal geometry of the central Skellefte district, northern Sweden—Constraints from reflection seismic investigations. Tectonophysics 2012, 524–525, 87–99. [Google Scholar] [CrossRef]
- Heinonen, S.; Kukkonen, I.T.; Heikkinen, P.J.; Schmitt, D.R. High Resolution Reflection Seismics Integrated With Deep Drill Hole Data in Outokumpu, Finland. In Outokumpu Deep Drilling Project; Special Paper 51; Kukkonen, I., Ed.; Geological Survey of Finland: Espoo, Finland, 2011; pp. 105–118. ISBN 978-952-217-152-8. [Google Scholar]
- Heinonen, S.; Imaña, M.; Snyder, D.B.; Kukkonen, I.T.; Heikkinen, P.J. Seismic reflection profiling of the Pyhäsalmi VHMS-deposit: A complementary approach to the deep base metal exploration in Finland. Geophysics 2012, 77, WC15–WC23. [Google Scholar] [CrossRef]
- Koivisto, E.; Malehmir, A.; Heikkinen, P.J.; Heinonen, S.; Kukkonen, I.T. 2D reflection seismic investigations at the Kevitsa Ni-Cu-PGE deposit, northern Finland. Geophysics 2012, 77, WC149–WC162. [Google Scholar] [CrossRef]
- Koivisto, E.; Malehmir, A.; Hellqvist, N.; Voipio, V.; Wijns, C. Building a 3D model of lithological contacts and near-mine structures in the Kevitsa mining and exploration site, Northern Finland: Constraints from 2D and 3D reflection seismic data. Geophys. Prospect. 2015, 63, 757–773. [Google Scholar] [CrossRef]
- Kukkonen, I.T.; Heinonen, S.; Heikkinen, P.J.; Sorjonen-Ward, P. Delineating ophiolite-derived host rocks of massive sulfide Cu-Co-Zn deposits with 2D high-resolution seismic reflection data in Outokumpu, Finland. Geophysics 2012, 77, WC213–WC222. [Google Scholar] [CrossRef]
- Malehmir, A.; Juhlin, C.; Wijns, C.; Urosevic, M.; Valasti, P.; Koivisto, E. 3D reflection seismic imaging for open-pit mine planning and deep exploration in the Kevitsa Ni-Cu-PGE deposit, northern Finland. Geophysics 2012, 77, WC95–WC108. [Google Scholar] [CrossRef]
- Malehmir, A.; Maries, G.; Bäckström, E.; Schön, M.; Marsden, P. Developing cost-effective seismic mineral exploration methods using a landstreamer and a drophammer. Sci. Rep. 2017, 7, 10325. [Google Scholar] [CrossRef] [PubMed]
- Manzi, M.S.D.; Gibson, M.A.S.; Hein, K.A.A.; King, N.; Durrheim, R. Application of 3D seismic techniques to evaluate ore resources in the West Wits Line goldfield and portions of the West Rand goldfield, South Africa. Geophysics 2012, 77, WC163–WC171. [Google Scholar] [CrossRef]
- Manzi, M.S.D.; Hein, K.A.A.; Durrheim, R.; King, N. The Ventersdorp Contact Reef model in the Kloof Gold Mine as derived from 3D seismics, geological mapping and exploration borehole datasets. Int. J. Rock Mech. Min. Sci. 2014, 66, 97–113. [Google Scholar] [CrossRef]
- Manzi, M.; Cooper, G.; Malehmir, A.; Durrheim, R.; Nkosi, Z. Integrated interpretation of 3D seismic data to enhance the detection of the gold-bearing reef: Mponeng Gold mine, Witwatersrand Basin (South Africa). Geophys. Prospect. 2015, 63, 881–902. [Google Scholar] [CrossRef]
- Salisbury, M.H.; Milkereit, B.; Bleeker, W. Seismic imaging of sulfide deposits: Part I. Rock properties. Econ. Geol. 1996, 91, 821–828. [Google Scholar] [CrossRef]
- Eaton, D.W. Weak elastic-wave scattering from massive sulfide ore bodies. Geophysics 1999, 64, 289–299. [Google Scholar] [CrossRef]
- Bohlen, T.; Müller, C.; Milkereit, B. Elastic wave scattering from massive sulfide orebodies: On the role of composition and shape. In Hard Rock Seismic Exploration; Eaton, D.W., Milkereit, B., Salisbury, M.H., Eds.; SEG: Tulsa, OK, USA, 2003; pp. 70–89. ISBN 978-1-56080-239-6. [Google Scholar]
- Townsend, J.; Sampson, L.; Bourne, B. Recent advances in the application of geophysics for gold exploration in the north-central Great Basin. In Great Basin Evolution and Metallogeny, Geological Society of Nevada 2010 Symposium; Steininger, R., Pennell, W., Eds.; DEStech Publications, Inc.: Lancaster, PA, USA, 2010; pp. 167–178. ISBN 978-1-60595-040-2. [Google Scholar]
- Malehmir, A.; Bellefleur, G.; Koivisto, E.; Julin, C. Pros and cons of 2D vs 3D seismic mineral exploration surveys. First Break 2017, 35, 49–55. [Google Scholar]
- Greenhalgh, S.A.; Mason, I.M. Seismic imaging with application to mine layout and development. In Proceedings of Exploration 97; Gubins, A.C., Ed.; Prospectors and Developers Association: Toronto, ON, Canada, 1997; pp. 585–598. [Google Scholar]
- Greenhalgh, S.A.; Mason, I.M.; Sinadinovski, C. In-mine seismic delineation of mineralization and hard rock structure. Geophysics 2000, 65, 1908–1919. [Google Scholar] [CrossRef]
- Greenhalgh, S.A.; Zhou, B.; Cao, S. A crosswell seismic experiment for nickel sulfide mineralization. J. Appl. Geophys. 2003, 53, 77–89. [Google Scholar] [CrossRef]
- Cosma, C.; Heikkinen, P.; Keskinen, J.; Enescu, N. VSP in Crystalline Rocks—From Downhole Velocity Profiling to 3D Fracture Mapping. Int. J. Rock Mech. Min. Sci. 2001, 38, 843–850. [Google Scholar] [CrossRef]
- Cosma, C.; Wolmarans, A.; Enescu, N. Kimberlite delineation by seismic sidescands from boreholes. In Proceedings of the 67th EAGE Annual International Conference and Exhibition, Madrid, Spain, 13–16 June 2005; Extended Abstracts. pp. 1–4. [Google Scholar]
- Cosma, C. Multi-azimuth VSP for rock characterization of deep nuclear waste disposal sites in Finland. In Hard Rock Seismic Exploration; Eaton, D.W., Milkereit, B., Salisbury, M.H., Eds.; SEG: Tulsa, OK, USA, 2003; pp. 70–89. ISBN 978-1-56080-239-6. [Google Scholar]
- Cosma, C.; Enescu, N. Seismic side-scan for wide-range high-resolution imaging around boreholes. In Proceedings of the EAGE Borehole Geophysics Workshop, Istanbul, Turkey, 16–19 January 2011. BG22. [Google Scholar] [CrossRef]
- Greenwood, A.J.; Urosevic, M.; Dupuis, C.; Kepic, A. The Application of Borehole Hydrophone Arrays in Hardrock Environments. In Proceedings of the 76th EAGE Annual International Conference and Exhibition, Workshop on Hard Rock Seismic Imaging, Amsterdam, The Netherlands, 16–19 June 2014; Extended Abstracts. p. 14. [Google Scholar] [CrossRef]
- Wood, G.; O’Dowd, C.; Cosma, C.; Enescu, N. An interpretation of surface and borehole seismic surveys for mine planning at the Millennium uranium deposit, northern Saskatchewan, Canada. Geophysics 2012, 75, WC203–WC212. [Google Scholar] [CrossRef]
- Cheraghi, S.; Craven, J.A.; Bellefleur, G. Feasibility of virtual source reflection seismology using interferometry for mineral exploration: A test study in the Lalor Lake volcanogenic massive sulfide mining area, Manitoba, Canada. Geophys. Prospect. 2015, 63, 833–848. [Google Scholar] [CrossRef]
- Parker, T.; Shatalin, S.; Farhadiroushan, M. Distributed Acoustic Sensing—A new tool for seismic applications. First Break 2014, 32, 61–69. [Google Scholar] [CrossRef]
- Peltonen, P.; Kontinen, A.; Huhma, H.; Kuronen, U. Outokumpu revisited: New mineral deposit model for the mantle peridotite-associated Cu-Co-Zn-Ni-Ag-Au sulfide deposits. Ore Geol. Rev. 2008, 33, 559–617. [Google Scholar] [CrossRef]
- Aki, K.; Richards, P. Quantitative Seismology, Vol. 1: Theory and Methods; W.H. Freeman & Co. Ltd.: San Francisco, CA, USA, 1980; ISBN 978-0716710585. [Google Scholar]
- Zoeppritz, K. Über Reflexion und Durchgang seismischer Wellen durch Unstetigkeitsflächen. Nachrichten von der Gesellschaft der Wissenschaften zu Göttingen, Mathematisch-Physikalische Klasse 1919, 1919, 66–84. [Google Scholar]
- Ji, S.; Wang, Q.; Xia, B. Handbook of Seismic Properties of Minerals, Rocks and Ores; Polytechnic International Press: Montreal, QC, Canada, 2002; ISBN 2-553-01032-X. [Google Scholar]
- Malehmir, A.; Andersson, M.; Lebedev, M.; Urosevic, M.; Mikhaltsevitch, V. Experimental estimation of velocities and anisotropy of a series of Swedish crystalline rocks and ores. Geophys. Prospect. 2012, 61, 153–167. [Google Scholar] [CrossRef]
- Salisbury, M.H.; Harvey, C.W.; Matthews, L. The acoustic properties of ores and host rocks in hardrock terranes. In Hard Rock Seismic Exploration; Eaton, D.W., Milkereit, B., Salisbury, M.H., Eds.; SEG: Tulsa, OK, USA, 2003; pp. 9–19. ISBN 978-1-56080-239-6. [Google Scholar]
- Duff, D.; Hurich, C.; Deemer, S. Seismic properties of the Voisey’s Bay massive sulfide deposit: Insights into approaches to seismic imaging. Geophysics 2012, 77, WC59–WC68. [Google Scholar] [CrossRef]
- Milkereit, B.; Eaton, D.W.; Wu, J.; Perron, G.; Salisbury, M.H.; Berrer, E.; Morrison, G. Seismic imaging of massive sulfide deposits: Part II. Reflection seismic profiling. Econ. Geol. 1996, 91, 829–834. [Google Scholar] [CrossRef]
- Salisbury, M.H.; Milkereit, B.; Ascough, G.; Adair, R.; Matthews, L.; Schmitt, D.R.; Mwenifumbo, J.; Eaton, D.W.; Wu, J. Physical properties and seismic imaging of massive sulfides. Geophysics 2000, 65, 1882–1889. [Google Scholar] [CrossRef]
- Luhta, T.; Mertanen, S.; Koivist, E.; Heinonen, S.; Törmälehto, T.; Kukkonen, I. The seismic signature of the Kylylahti deposit: Initial results from new petrophysical measurements. In Lithosphere 2016 Symposium, Programme and Extended Abstracts; Korja, A., Ed.; Institute of Seismology: Helsinki, Finland, 2016; pp. 79–82. ISBN 978-952-10-9282-5. [Google Scholar]
- Park, C.B.; Miller, R.D.; Steeples, D.W.; Black, R.A. Swept impact seismic technique (SIST). Geophysics 1996, 61, 1789–1803. [Google Scholar] [CrossRef] [Green Version]
- Cosma, C.; Enescu, N. Characterization of Fractured Rock in the Vicinity of Tunnels by the Swept Impact Seismic Technique. Int. J. Rock Mech. Min. Sci. 2001, 38, 815–821. [Google Scholar] [CrossRef]
- Farhadiroushan, M.; Parker, T.R.; Shatalin, S. Method and Apparatus for Optical Sensing. WO2010136810, 27 May 2009. [Google Scholar]
- Shatalin, S.V.; Trschikov, V.N.; Rogers, A.J. Interferometric optical time-domain reflectometry for distributed optical-fiber sensing. Appl. Opt. 1997, 37, 5600–5604. [Google Scholar] [CrossRef]
- Dean, T.; Cuny, T.; Hartog, A.H. The effect of gauge length on axially incident P-waves measured using fiber optic distributed vibration sensing. Geophys. Prospect. 2017, 65, 184–193. [Google Scholar] [CrossRef]
- Daley, T.M.; Freifeld, B.M.; Ajo-Franklin, J.; Dou, S.; Pevzner, R.; Shulakova, V.; Kashikar, S.; Miller, D.E.; Götz, J.; Henninges, J.; et al. Field testing of fiber-optic distributed acoustic sensing (DAS) for subsurface seismic monitoring. Lead. Edge 2013, 32, 699–706. [Google Scholar] [CrossRef]
- Götz, J.; Lüth, S.; Henninges, J.; Reinsch, T. Vertical Seismic Profiling using a daisy-chained deployment of fiber optic cables in four wells simultaneously—Case study at the Ketzin carbon dioxide storage site. Geophys. Prospect. 2018, 66, 1201–1214. [Google Scholar] [CrossRef]
- Harris, K.; White, D.; Melanson, D.; Samson, C.; Daley, T.M. Feasibility of time-lapse VSP monitoring at the Aquistore CO2 storage site using a distributed acoustic sensing system. Int. J. Greenh. Gas Control 2016, 50, 248–260. [Google Scholar] [CrossRef]
- Barberan, C.; Allanic, C.; Avila, D.; Hy-Billiot, J.; Hartog, A.; Frignet, B.; Lees, G. Multi-offset Seismic Acquisition Using Optical Fiber Behind Tubing. In Proceedings of the 74th EAGE Annual International Conference and Exhibition, Copenhagen, Denmark, 4–7 June 2012. Extended Abstracts; Y003. [Google Scholar]
- Madsen, K.N.; Thompson, M.; Parker, T.; Finfer, D. A VSP field trial using distributed acoustic sensing in a producing well in the North Sea. First Break 2013, 31, 51–56. [Google Scholar] [CrossRef]
- Mateeva, A.; Lopez, J.; Potters, H.; Mestayer, J.; Cox, B.; Kiyashchenko, D.; Wills, P.; Grandi, S.; Hornman, K.; Kuvshinov, B.; et al. Distributed acoustic sensing for reservoir monitoring with vertical seismic profiling. Geophys. Prospect. 2014, 62, 679–692. [Google Scholar] [CrossRef]
- Dou, S.; Lindsey, N.; Wagner, A.M.; Daley, T.M.; Freifeld, B.; Robertson, M.; Peterson, J.; Ulrich, C.; Martin, E.R.; Ajo-Franklin, J.B. Distributed Acoustic Sensing for Seismic Monitoring of The Near Surface: A Traffic-Noise Interferometry Case Study. Sci. Rep. 2017, 7, 11620. [Google Scholar] [CrossRef] [PubMed]
- Miah, K.; Potter, D.K. A Review of Hybrid Fiber-Optic Distributed Simultaneous Vibration and Temperature Sensing Technology and Its Geophysical Applications. Sensors 2017, 17, 2511. [Google Scholar] [CrossRef] [PubMed]
- Cosma, C.; Balu, L.; Enescu, N. 3D VSP migration by image point transform. Geophysics 2010, 75, S121–S130. [Google Scholar] [CrossRef]
- Bellefleur, G.; Malehmir, A.; Müller, C. Elastic finite-difference modeling of volcanic-hosted massive sulfide deposits: A case study from Half Mile Lake, New Brunswick, Canada. Geophysics 2012, 77, WC25–WC36. [Google Scholar] [CrossRef]
- Schetselaar, E.; Bellefleur, G.; Craven, J.; Roots, E.; Cheraghi, S.; Shamsipour, P.; Caté, A.; Mercier-Langevin, P.; El Goumi, N.; Enkin, R.; et al. Geologically driven 3D modeling of physical rock properties in support of interpreting the seismic response of the Lalor volcanogenic massive sulfide deposit, Snow Lake, Manitoba, Canada. Geol. Soc. Lond. Spec. Publ. 2017, 453. [Google Scholar] [CrossRef]
- Bohlen, T. Parallel 3-D viscoelastic finite-difference seismic modeling. Comput. Geosci. 2002, 28, 887–889. [Google Scholar] [CrossRef]
© 2018 by the authors. Licensee MDPI, Basel, Switzerland. This article is an open access article distributed under the terms and conditions of the Creative Commons Attribution (CC BY) license (http://creativecommons.org/licenses/by/4.0/).

 ,
, 


