

Th-Rich Zircon from a Pegmatite Vein Hosted in the Wiborg Rapakivi Granite Massif
by
 , and
, and
Sergey G. Skublov
1,2,*,
Dmitriy A. Petrov
2,
Olga L. Galankina
1,
Ekaterina V. Levashova
1 and
and
Ilona V. Rogova
2 1
Institute of Precambrian Geology and Geochronology of the Russian Academy of Sciences, 2 Makarova Embankment, 199034 St. Petersburg, Russia
2
Faculty of Geological Prospecting, St. Petersburg Mining University, 21-st Line 2, 199106 St. Petersburg, Russia
*
Author to whom correspondence should be addressed.
Geosciences 2023, 13(12), 362; https://doi.org/10.3390/geosciences13120362
Submission received: 27 October 2023
/
Revised: 21 November 2023
/
Accepted: 23 November 2023
/
Published: 24 November 2023
(This article belongs to the Section Geochemistry)
Abstract
:Zircon from a pegmatite vein hosted in the rapakivi granites occurring in the Gubanov Intrusion of the Wiborg Massif was shown by the EPMA method to contain an anomalously high Th of 18.3 wt% ThO2 (about 161,000 ppm Th). The SIMS method obtained a close value for thorium content—146,000 ppm. U increases to 6800 ppm. Zircon contains high values of other non-formula elements: Y (up to 51,500 ppm), Ti (up to 12,500 ppm), P (up to 9000 ppm), Nb (up to 3500 ppm), Ca (up to 2800 ppm) and Ba (up to 600 ppm). The average Hf value is 10,900 ppm. Total REE ranges from 25,500 to 49,400 ppm, and the average REE is 33,300 ppm. The REE patterns show poorly HREE fractionation over the LREE (LuN/LaN ratio average is 6.34) with well-marked negative Eu anomalies (Eu/Eu* averages 0.10) and slight positive Ce anomalies (Ce/Ce* averages 1.16). The formation of Th-rich zircon indicates that residual fluid-saturated pegmatite melt is saturated with Th and other trace elements (REE, Y, U, Ti and Nb).
Keywords:
zircon; thorium; rapakivi granites; pegmatites; Wiborg Massif; trace elements; rare-earth elements1. Introduction
Zircon is a geochronometer mineral most commonly used for approaching various geological problems (e.g., [1,2,3]). The study of zircon trace elements, which has become possible with the arrival of high-precision microanalytical methods (SIMS, LA-ICP-MS, etc.), provides more information on petrogenesis [4,5,6]. Therefore, it is important to obtain more evidence for zircon’s isomorphic capacity for trace elements and zircon crystallization conditions when its impurity element concentrations are extremely high. The possible range and average concentrations of impurity elements in zircon have been assessed recently, based on strong evidence (e.g., [7,8,9]). However, detailed mineralogical and geochemical studies that are currently in progress provide more information on the anomalously high concentrations of some elements in zircon. Hf-rich zircon in rare-metal pegmatites from the Vasin-Mylk deposit (northeastern Kola Peninsula) was shown to contain zones consisting of hafnon. It was the fourth discovery of hafnon in the world [10]. In this study, we report the occurrence of anomalous Th-rich zircon in a pegmatite vein emplaced in porphyritic rapakivi granite from the Wiborg Massif. We present EPMA and SIMS data for it, which provides a better understanding of zircon’s isomorphic capacity.
2. Geological Setting
The geology and petrology of rapakivi granites from the Fennoscandian Shield have been the subject of detailed studies for over half a century (e.g., [11,12,13,14,15]). Wiborg rapakivi granites were widely used in the architecture of St. Petersburg [16,17]. The Wiborg rapakivi granite massif, located mainly in Finland, is a giant multi-phase intrusive body exposed over an area of more than 19,000 km2 and formed during the consecutive intrusion of four portions of magma (Figure 1). Petrochemical, mineralogical and geochemical analyses of various granite phases are indicative of melt differentiation, which took place in the primary deep magmatic chamber during the crystallization of separate magmatic phases [18]. Available isotopic data indicate that the massif was forming for at least 20 Ma over the time span of 1642–1622 Ma [19]. From a practical point of view, the mineralogical and geochemical study of Wiborg rapakivi granites is essential for the assessment of the composition and quality of the region’s underground waters (e.g., [20,21]).
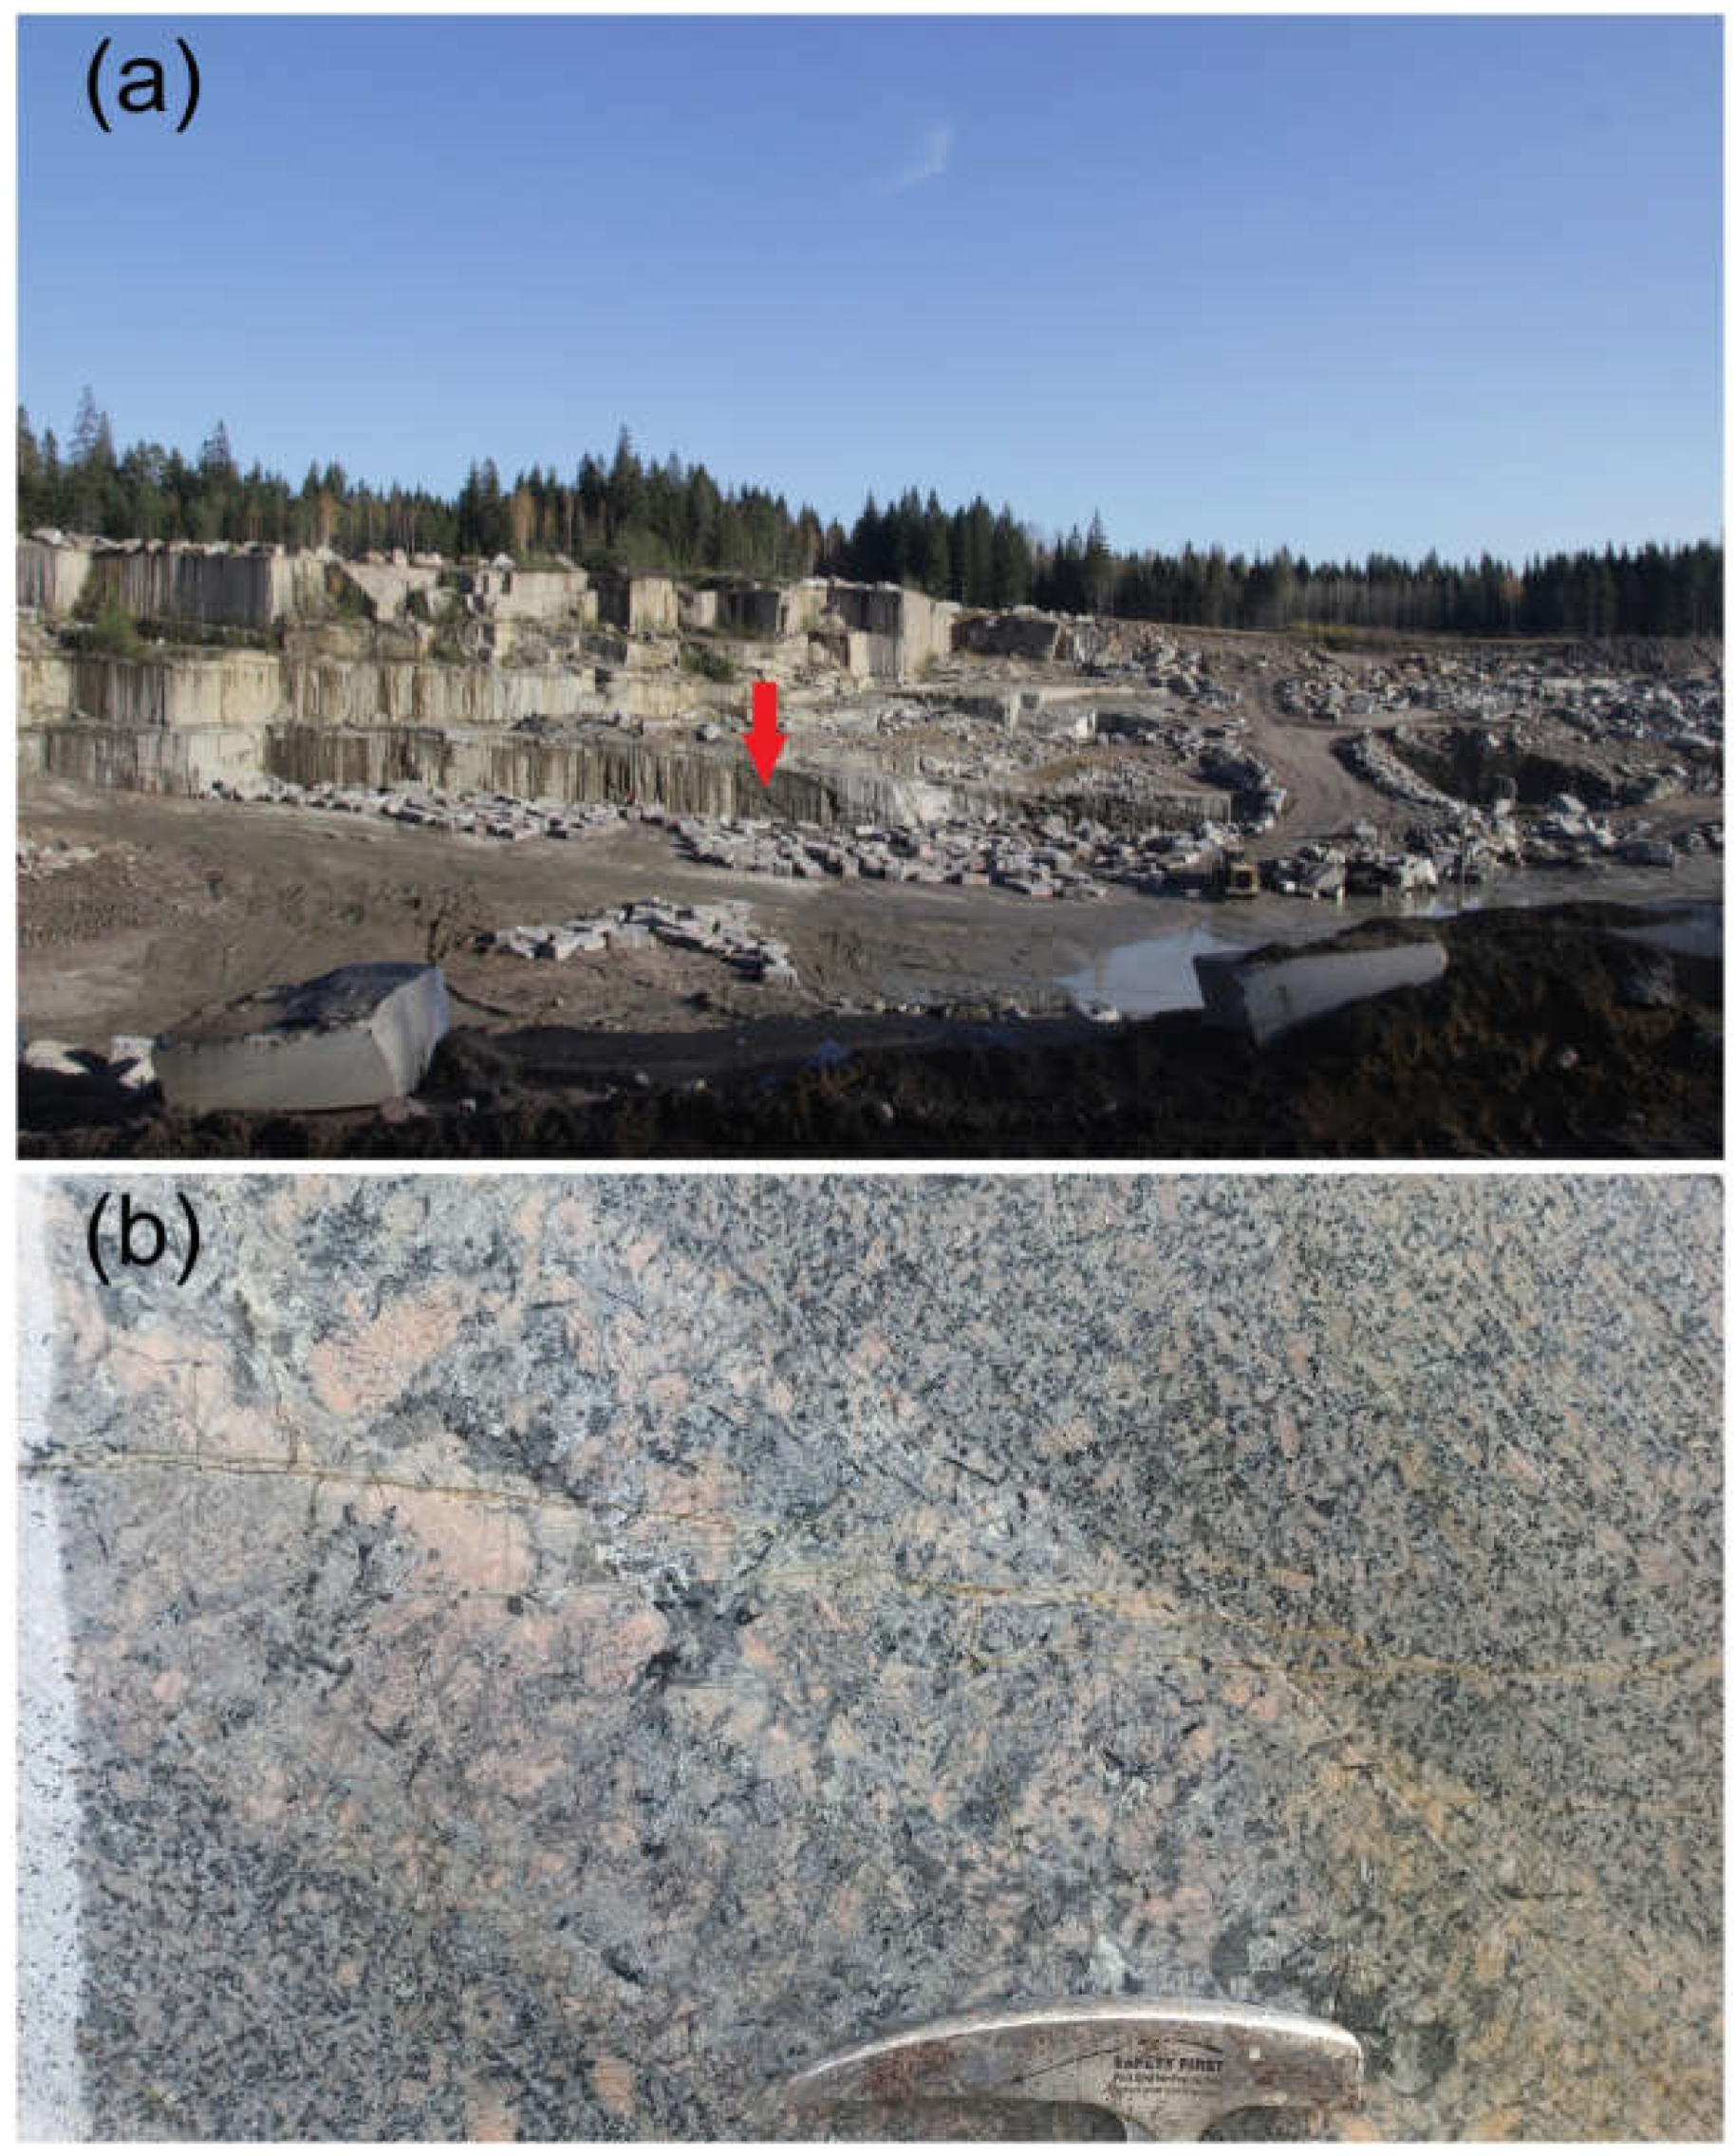
Zircon is one of the most common accessory minerals present in all types of rapakivi granites. The prismatic faces of its crystals are better defined than dipyramidal faces. The aim of the present project was to study a zircon sample with an anomalously high Th concentration (sample 110) obtained by Prof. V.V. Gavrilenko from a pegmatite vein in the rapakivi granites of the Gubanov Intrusion quarried in Vozrozhdenie quarry located in the Wiborg District of the Leningrad region (Figure 2a).
The Gubanov Intrusion is a granitic intrusive body covering an area of about 20 km2 within the Wiborg Massif [18]. Vozrozhdenie facing stone deposits is its biggest exposure. Most researchers consider the intrusion as a body formed during a third phase of intrusion (after pyroxene-hornblende granites of phase I and ovoid biotite-hornblende wiborgites of phase II). Wiborgite is a regional term adopted by geologists in Finland, Sweden and Russia as a shorter synonym for the coarse-grained, ovoid-rich granites that are most common in rapakivi massifs. The Gubanov Intrusion consists of porphyritic biotite granites. Of note, the K-feldspar megacrysts (up to 30–40 mm) in the biotitic granites are idiomorphic with tabular habits rather than ovoids. These granites often display a trachytoid texture, especially near contact with host wiborgites. Feldspar ovoids, tentatively understood as xenocrysts trapped from wiborgites upon the intrusion of phase III, occur there as well. This conclusion is supported by the fact that the amount of ovoids in biotite granites decreases rapidly away from the contact.
The pegmatites from which the zircon sample was taken occur as 10–50 cm thick veined bodies cutting biotite granites mainly in the northern zone of the quarry (Figure 2b). According to Prof. M.A. Ivanov (personal communication), they dip SW at 30–50°. They consist of K-Na feldspar (30–50 vol. %), plagioclase (An18–22, 15–20 vol. %), quartz (30–50 vol. %) and biotite (2–5 vol. %). They also contain albite, fluorite, titanite and muscovite; K-feldspar occasionally occurs as amazonite. Pegmatite bodies typically display symmetrically zoned structure (Figure 2b): near the contacts, they consist of fine-grained aggregate of biotite-quartz-feldspar composition, which is succeeded in its axial zone by coarse (up to 5 cm in size) feldspar and quartz crystals. Fluorite and amazonite, as well as miarolitic cavities containing idiomorphic quartz crystals, are confined to this zone.
Pegmatite veins are located inside the granites of phase III, near the contact with earlier granites of phase II. This suggests that pegmatites crystallized from the residual melt of granites of phase III, enriched with volatile and incompatible components. According to textural features, zircon crystallized simultaneously with the minerals of the central (giant-grained) part of the pegmatite vein—biotite and K-feldspar.
3. Methods
Anomalously high Th concentration in zircon from the above pegmatite vein (sample 110) was tentatively detected using the SEM-EDS method at the Institute of Precambrian Geology and Geochronology of the Russian Academy of Sciences on a JEOL JSM-6510LA scanning electron microscope with a JED-2200 energy dispersion X-ray spectrometer (JEOL Ltd., Akishima, Japan). A transparently polished, thin section was carbon-coated.
Zircon composition was measured using the EPMA (electron probe microanalyser) method at the Institute of Precambrian Geology and Geochronology of the Russian Academy of Sciences on a JEOL-JXA-8230 electron probe microanalyser (JEOL Ltd., Akishima, Japan) with four wavelength dispersive spectrometers (WDS). Analyses were performed at an accelerating voltage of 20 kV and a beam current on a Faraday cup of 20 nA. Zircon (ZrLα and SiKα), hafnon (HfMα), ThO2 (ThMα), UO2 (UMβ), CePO4 (CeLα), DyPO4 (DyLα), Y-garnet (YLα), LiTaO3 (TaMα), LiNbO3 (NbLα), F-apatite (PKα), spessartite (FeKα and AlKα) and anortite (CaKα) were used as standards. To reduce grain surface damage, measurements were made with beam diameters of 3, 10 and 15 µm. The results obtained were similar. The ZAF method was employed for calculating corrections. The estimated analytical precisions were better than 2% for Si and Zr; better than 10% for Hf, Y, P, Th, Ca, Ce, Fe and Al and higher than 10% for Ta, Nb, U and Dy.
Measurements of zircon trace element composition were performed using the SIMS (secondary ion mass spectrometry) method using an IMS-4f (Cameca, Gennevilliers, France) ion microprobe at the Yaroslavl’ branch of the Institute of Physics and Technology of the Russian Academy of Sciences. We mainly followed the analytical procedure described in [23,24]. Concentrations of trace elements were calculated from the normalized to 30Si+ secondary ion intensities using calibration curves based on a set of reference glasses. NIST-610 reference glass was used as a daily monitor for trace element analyses. The primary O2– ion beam spot size was ~20 µm. Each analysis was averaged over 3 measurement cycles. The accuracy of trace element measurements was up to 10% and 20% for concentrations of more than 1 ppm and between 0.1 and 1 ppm, respectively. The detection limit was 5–10 ppb. To construct REE distribution spectra, the composition of zircon was normalized to that of chondrite CI [25].
4. Results
4.1. EPMA Analytical Results
The zircon grain studied is in the marginal zone of a coarse (about 1.5 cm across) quartz crystal. It displays a well-defined xenomorphic habit (Figure 3a). The grain, 200 × 400 µm across, has an elongated shape. About half of the grain is highly brecciated and is healed with colloform aggregate streaks, consisting of Fe oxides (hydroxides?) and smaller amounts of Al and Si. The streaks vary in thickness from 10 to 30 µm. The zircon zones surrounded by streaks display zonal structure: zircon is darker in BSE in the centre of the zones and lighter towards the streaks. Relatively brighter areas have a higher mean atomic number than the darker areas, and so they are constituted by relatively heavier chemical elements on average. Micron-sized inclusions of other mineral phases of trace and minor elements in zircon, including Th (e.g., thorite or thorianite), do not occur.
The composition of the zircon analysed typically displays low SiO2, varying from 15.96 to 20.33 wt% (on average, 17.45 wt%) (Table 1). This SiO2 value is almost twice as low as the stoichiometric composition of 32.8 wt% SiO2 [26].
ZrO2 is also lower than a stoichiometric value of 67.2 wt%. It varies from 30.03 to 42.11 wt%, averaging 34.38 wt%. SiO2 and ZrO2 show a positive correlation (r = 0.89, Figure 4a). Total SiO2 and ZrO2 vary from 46.33 to 62.44 wt%, averaging 51.82 wt%. Thus, the total amount of impurities in the zircon may be over 50 wt%. Higher SiO2 and ZrO2 values were obtained for darker areas (e.g., points 22, 23, 31 and 33, Figure 3a). Their SiO2 may be over 20 wt% and ZrO2 is up to 42 wt%. The lowest SiO2 and ZrO2 concentrations were revealed in brighter zones (e.g., points 27, 28 and 32). They usually surround darker zones with low major element values. Their SiO2 is 16–17 wt% and ZrO2 is 30–31 wt%.
EPMA has shown that Th contributes mostly to the amount of trace elements. Their ThO2 varies from 3.79 to 18.34 wt%, averaging 11.55 wt%. ThO2 in the brighter zones (points 27, 28 and 32) is at its maximum, averaging 18.11 wt%. ThO2 in darker zones (points 22, 23, 31 and 33) is much lower, averaging 5.90 wt%. ThO2 is negatively correlated with ZrO2 (r = −0.85, Figure 4b). UO2 is positively correlated with ThO2 (r = 0.89, Figure 4c), varying in a relatively narrow range from 0.42 to 0.75 wt%, averaging 0.61 wt%. Both Th4+ and U4+ replace Zr4+ at the dodecahedral site of the zircon structure [27].
Zircon contains a relatively high FeO concentration, varying from 2.16 to 10.3 wt% and averaging 6.13 wt%. The FeO value depends inversely on ThO2 (r = −0.50). In the ThO2-richest lighter zones, FeO drops to 2 wt%. In the darker zones, which contain much less ThO2, the FeO value is the highest.
FeO is positively correlated with Al2O3 (r = 0.49). The latter varies from 1.86 to 2.51 wt%, averaging 2.18 wt%.
Y2O3 varies from 3.90 to 5.12 wt%, averaging 4.36 wt%. Y2O3 and ThO2 do not show a significant positive correlation (r = 0.17).
P2O5 varies from 1.23 to 2.17 wt%, averaging 1.80 wt%, correlating positively with ThO2 (r = 0.85, Figure 4d). P2O5 is also positively correlated with Y2O3 (r = 0.60). Y-REE-bearing zircon commonly contains P. The replacement of Zr4+ by Y3+ and REE3+ in zircon is commonly explained by the coupled xenotime-type substitution, in which P5+ replaces Si4+, maintaining charge balance [27].
It should be noted that the elevated Ca value in zircon has a fluid effect on the mineral [28]. CaO varies from 0.40 to 0.70 wt% (on average, 0.55 wt%), showing a positive correlation with ThO2 (r = 0.39). The CaO value shows either a negative or no correlation with other trace and minor elements.
4.2. SIMS (TE + REE) Analytical Results
Trace and rare-earth element values in high-Th zircon were measured by SIMS at 9 points (Table 2 and Figure 3b). Th varies from 46,399 to 146,245 ppm, averaging 92,131 ppm. U is not correlated with Th (r = 0.00), varying from 2706 to 6825 ppm (on average, 4613 ppm). The Th/U ratio varies from 6.80 to 31.4, averaging 21.3. La (r = 0.63), and Ca (r = 0.56) and Nb (r = 0.43) values are positively correlated with Th (Figure 5a–c).
Ti in the zircon analysed is anomalously high, varying from 693 to 12,565 ppm (on average, 2681 ppm). Hence, it cannot be used as a marker for zircon crystallization temperature [29]. Ti is poorly correlated with other trace elements in zircon, showing a positive correlation only with Li (r = 0.80) and Nb (r = 0.71).
Hf varies over a wide range from 5863 to 17,364 ppm, averaging 10,910 ppm. The highest Hf value was obtained for the darker zircon zones (points 7 and 9) that typically contain the lowest Th. Th is negatively correlated with Hf (r = −0.41, Figure 5d). Two non-formula elements, Ba (r = 0.59) and Sr (r = 0.46), are positively correlated with Hf. Ba and Sr are negatively correlated with Th (for Ba-Th r = −0.60, Figure 5e). Ba (321 to 673 ppm, averaging 427 ppm) is higher by more than one order of magnitude than Sr (21.0 to 69.3 ppm, averaging 33.3 ppm). Such a correlation is not typical of zircons enriched in trace elements. It has been shown earlier that Ba and Sr values in anomalous zircon from Belokurikha leucogranites are correlated both for unaltered low-Ba- and low-Sr zircons and for zircons enriched in incompatible elements [30].
Ca varies from 1691 to 2796 ppm, averaging 2262 ppm. The Nb value is the same as Ca, varying from 1497 to 3510 ppm (on average, 2267 ppm). It has been noted above that Ca and Nb are positively correlated with Th.
The Y value is as high as 24,927 to 51,524 ppm, averaging 33,901 ppm. Y and P are positively correlated (r = 0.80, Figure 5f), as are Y and Hf (r = 0.63). P varies from 4685 to 9047 ppm (on average, 6673 ppm).
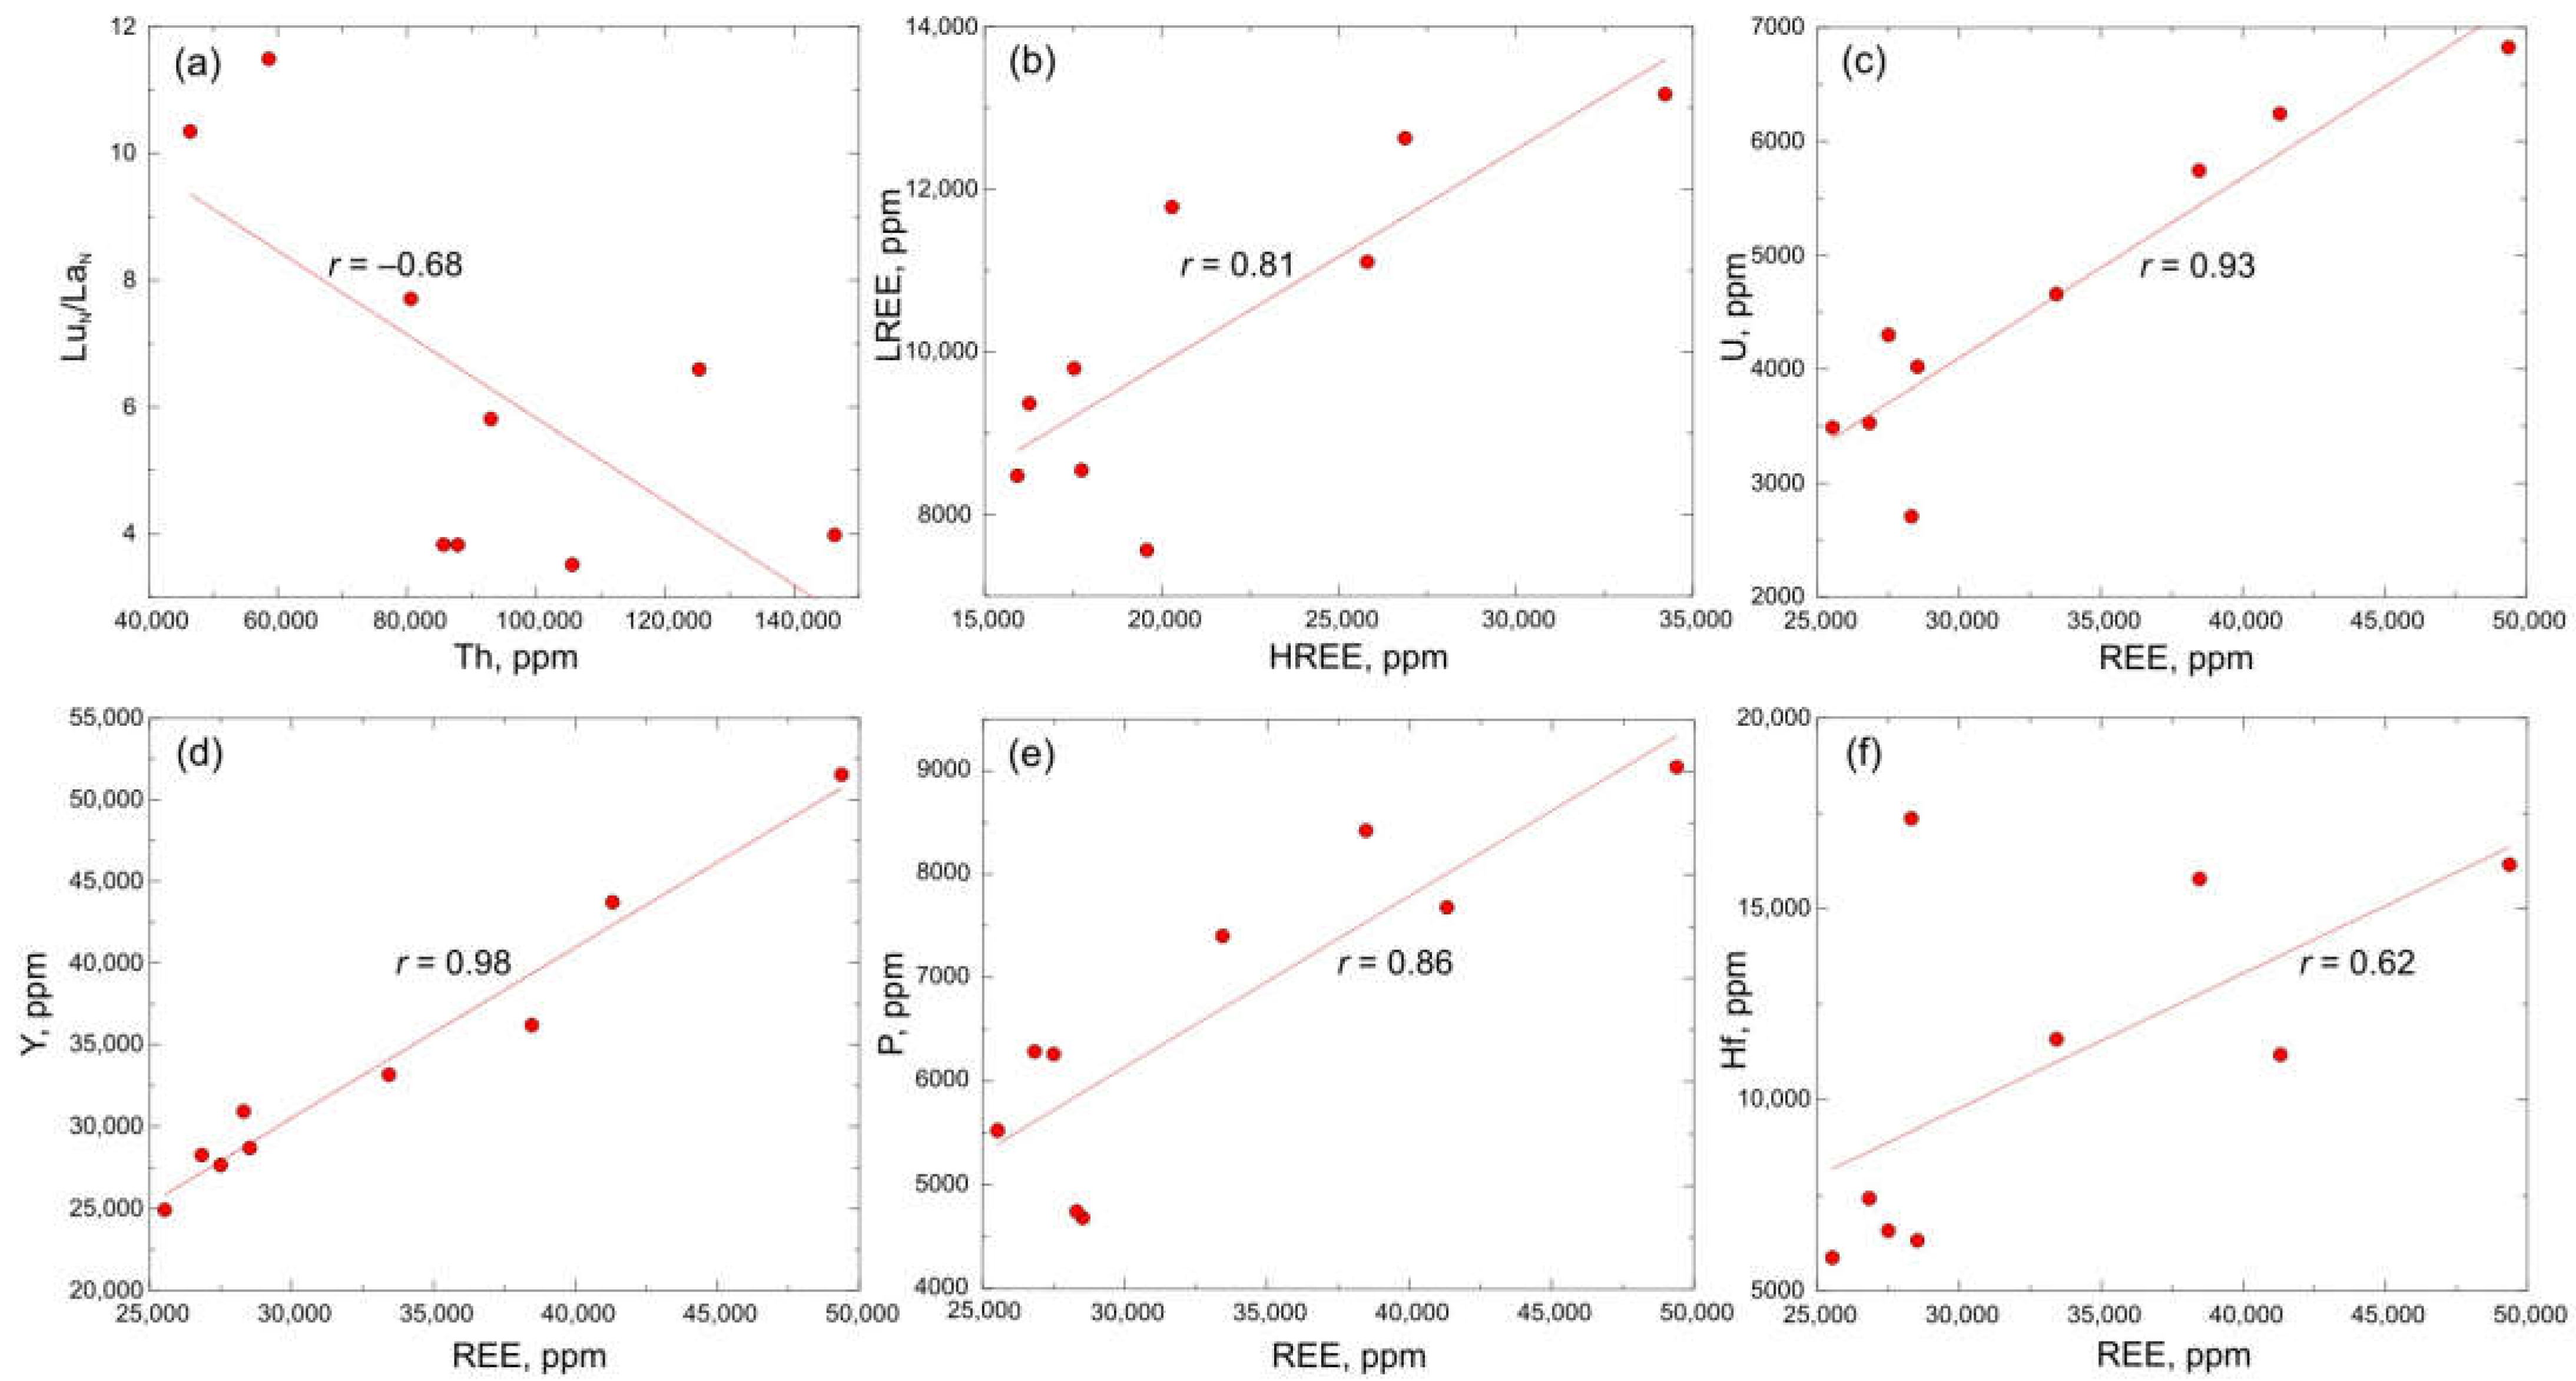
REE varies from 25,532 to 49,374 ppm, averaging 33,256 ppm. The REE distribution spectra are poorly fractionated, so LREE is more abundant than HREE (Figure 6). The LuN/LaN ratio varies from 3.52 to 11.5, averaging 6.34. Th is negatively correlated with the LuN/LaN ratio (r = −0.68, Figure 7a) and separately with the SmN/LaN and LuN/GdN ratios. In other words, Th-rich zircon zones display flatter REE distribution spectra.
The average HREE (Gd-Lu) value is twice as high as the average LREE (La-Nd). Heavy and light REE are positively correlated (r = 0.81, Figure 7b).
REE is positively correlated with U (r = 0.93, Figure 7c), Y (r = 0.98, Figure 7d), P (r = 0.86, Figure 7e) and Hf (r = 0.62, Figure 7f).
The spectra for light REE are almost flat (the SmN/LaN ratio varies from 0.86 to 2.06, averaging 1.30). All the zircons show negative Eu-anomaly (Eu/Eu* varies slightly from 0.09 to 0.11, averaging 0.10). Positive Ce-anomaly, characteristic of magmatic zircon [26], is largely reduced (Ce/Ce* varies from 0.84 to 1.55, averaging 1.16).
5. Discussion
SIMS analysis (Table 2) has shown that only Li and Hf values are not anomalously high. Variations in Li from 0.67 to 11.6 ppm (on average, 3.32 ppm) are consistent with the Li value in zircon from the continental crust [32]. Hf varies from 5863 to 17,364 ppm, averaging 10,910 ppm, which is even less than the average Hf value in zircon from granitoids (12,800 ppm) [7].
Trace element values in zircon are high because the radioactive decay of Th and U with α-particle emission damages its crystalline structure. As a result, zircon becomes metamict, and non-formula trace elements and water easily enter the structure ([33] and references therein).
The positive correlation of Y, REE and P and their negative correlation with ZrO2 and SiO2, confirmed by both analytical methods (EPMA and SIMS), supports a xenotime scheme of coupled substitution (Y,REE)3+ + P5+ → Zr4+ + Si4+. On the other hand, highly inconsistent (by about one order of magnitude) Y, REE (total on average, 67,157 ppm) and P (on average, 6673 ppm) values, shown repeatedly for Y-rich zircons [30], suggest a different (not xenotime) scheme of coupled substitution.
The above correlation analysis of trace element values in Th-rich zircon has revealed two element associations, which show no positive correlation between the members of various groups. One consists of U, Y, P, REE and the associated Hf, Ba and Sr. All or some of these elements in zircon from rare-metal pegmatites and rare-metal granites are often abundant (e.g., [10,30]) because parent granitic melts are enriched in incompatible elements (LILE and HFSE) and because the melt is highly saturated with fluids [34]. In the Th-rich zircon studied, Ba concentration dominates strongly over Sr concentration, demonstrating melt composition and emphasizing its specific feature. Ba is a large-ion lithophile (LIL) element compatible with K-feldspar and biotite, which are widespread in both rapakivi granites and pegmatite veins. It seems that the superabundance of Ba, which has not become part of K-feldspar or biotite, has become part of zircon at the final stage of pegmatite formation.
The other element associations in the zircon studied consist of Th, Ca, Nb and Ti. Its formation is hard to interpret. It is an association dominated by HFS elements, which are commonly immobile in geologic processes. However, fluorine fluids contribute to their mobility. The formation of such fluids upon rapakivi granite crystallization is observed due to an abundance (a few percent by volume) of fluorite in the rocks. F-enriched topaz-bearing granite stocks, recognized as phase IV of rapakivi granite intrusion, are known in SE Finland [35]. Relatively high-to-moderate mobile element (U, Th, K and Ba) concentrations were reported for Dongargarh A-type rapakivi granites from India [36].
We compared REE distribution spectra for Th-rich zircon with those obtained by LA-ICP-MS for zircon obtained from the rapakivi granites of the Suomenniemi Massif, located at the northeastern flank of the Wiborg Massif, Finland [31]. The total REE value in Suomenniemi zircon is much lower than in Wiborg Th-rich zircon, varying from 475 to 5019 ppm (on average, 1903 ppm). Suomenniemi zircon clearly displays negative Eu-anomaly (Eu/Eu* on average, 0.07) similar in magnitude to Eu-anomaly in Wiborg granites. The pattern of the spectra for HREE is generally consistent with that for zircon from both massifs, except for a low value obtained for zircon from Suomenniemi rapakivi granites (Figure 6). In the LREE range, Suomenniemi zircon shows a wide range of values exceeding chondrite values by two orders of magnitude. Several spectra display a flat LREE distribution spectrum similar to those for Th-rich zircon. Other spectra for Suomenniemi zircon with lower LREE show a fractionated pattern in which LREE becomes more abundant than HREE’s. Th and U (40–250 ppm for both elements) in zircon from Suomenniemi rapakivi granites are common for granites [36]. Its Th/U ratio is much lower than that for Th-rich zircon, varying from 0.7 to 1.4 (on average, 1.1). The Y value in Suomenniemi zircon is 2900 ppm, which is lower by at least one order of magnitude than that in Wiborg zircon (on average, 33,901 ppm, Table 2).
Modern estimates of Th and U in zircon from various rock types (over 2000 analyses) show that Th in zircon for granitoids, as well as mafic and intermediate rocks, varies from a few ppm to 9690 ppm [9]. U in zircon from granitoids reaches a maximum of 10,800 ppm. Earlier researchers [7] also referred to 12,090 ppm as the highest Th value in zircon from granitoids. The highest U value in zircon from granitoids reported in the contribution cited is also about the same (12,380 ppm). The comparability of possible anomalously high Th and U values in zircon is deduced from the same thoritic-coffinitic scheme of coupled substitution, the electronegativity of these elements, and the similarity of their ionic radii [26]. The dissolution limit of Th in the structure was determined experimentally as ThO2 = 5.5 ± 2.5 wt% [37].
Zircons richer in Th than those referred to in [7,9] are known. Taohuadao, Qingtian and Laonshan peralkaline A-type granites (eastern China) contain zircon with ThO2 of up to 10.1 wt% [38]. Magmatically derived zircon from rhyolite laccoliths in Trans-Pecos, Texas, showed the highest ThO2 value of 6.99 wt% [39].
Li-F granites from Podlesí, Czech Republic, were found to contain single zircon grains with up to 6.64 wt% ThO2 (58,350 ppm Th) [40]. The same rocks were shown to carry zircon with about 14.75 wt% UO2.
Japanese granitoids were found to contain zircon with up to 6.6 wt% ThO2 and up to 11 wt% UO2 [41]. Leucocratic granite from the Weondong region, South Korea, was shown to carry zircon with up to 24,000 ppm U and 40,000 ppm Th [42].
High UO2 values of up to 15.8 wt% have been reported only for artificial zircon from Chernobyl “lava”, which has retained its crystallinity. It was produced by the remelting of zirconium-bearing alloys and silicate rocks provoked by the explosion of a nuclear reactor at the Chernobyl Nuclear Power Plant [43,44]. It is safe to assume that Th concentration in zircon may also be as high as 14–15 wt%, as shown earlier for U in natural zircon.
6. Conclusions
The EPMA study of zircon from a pegmatite vein in Wiborg rapakivi granites has revealed anomalously high ThO2 values, up to 18.34 wt%, corresponding to about 161,000 ppm if recalculated for Th. This value generally agrees with the highest Th of 146,000 ppm in the zircon analysed by SIMS. Such a high Th value in zircon means that the find is unique. The formation of Th-rich zircon indicates an abundance of Th and other trace elements (REE, Y, U, Ti and Nb) in residual fluid-saturated pegmatite melt, which evolved from rapakivi granite melt.
Author Contributions
Conceptualization, S.G.S. and E.V.L.; methodology, S.G.S. and O.L.G.; project administration, S.G.S., D.A.P. and E.V.L.; resources, S.G.S. and O.L.G.; visualization, S.G.S., D.A.P. and I.V.R.; writing—original draft, S.G.S. and D.A.P.; writing—review & editing, S.G.S., D.A.P., E.V.L. and I.V.R. All authors have read and agreed to the published version of the manuscript.
Funding
This research has been carried out in the framework of the Russian Science Foundation, grant No. 23-77-01014.
Data Availability Statement
Data are contained within the article.
Acknowledgments
The contribution of V.V. Gavrilenko to our study is invaluable. S.G. Simakin and E.V. Potapov assisted with measuring zircon trace element compositions. We also wish to thank E.N. Kuzminykh and K.S. Gusak (Vozrozhdenie Company) for organizing field work.
Conflicts of Interest
The authors declare no conflict of interest.
References
- Vlach, S.R.F. On the morphology and geochemistry of hydrothermal crypto- and microcrystalline zircon aggregates in a peralkaline granite. Minerals 2022, 12, 628. [Google Scholar] [CrossRef]
- Kuznetsov, N.B.; Romanyuk, T.V.; Strashko, A.V.; Novikova, A.S. Ophiolite association of Cape Fiolent (western part of the Mountainous Crimea)—The upper age constraint according to the U-Pb isotope dating of plagiorhyolites (Monakh Cliff). J. Min. Inst. 2022, 255, 435–447. [Google Scholar] [CrossRef]
- Smolkin, V.F.; Mokrushin, A.V.; Bayanova, T.B.; Serov, P.A.; Ariskin, A.A. Magma feeding paleochannel in the Monchegorsk ore region: Geochemistry, isotope U-Pb and Sm-Nd analysis (Kola region, Russia). J. Min. Inst. 2022, 255, 405–418. [Google Scholar] [CrossRef]
- Marin, Y.B. On mineralogical studies and the use of mineralogical information in solving petro-and ore genesis problems. Geol. Ore Depos. 2021, 63, 625–633. [Google Scholar] [CrossRef]
- Kudryashov, N.M.; Udoratina, O.V.; Kalinin, A.A.; Lyalina, L.M.; Selivanova, E.A.; Grove, M.J. U-Pb (SHRIMP-RG) age of zircon from rare-metal (Li, Cs) pegmatites of the Okhmylk deposit of the Kolmozero-Voron’ya greenstone belt (northeast of the Fennoscandian shield). J. Min. Inst. 2022, 255, 448–454. [Google Scholar] [CrossRef]
- Levashova, E.V.; Popov, V.A.; Levashov, D.S.; Rumyantseva, N.A. Distribution of trace elements controlled by sector and growth zonings in zircon from a miaskite pegmatite of the Vishnegorsky massif, the Southern Urals. J. Min. Inst. 2022, 254, 136–148. [Google Scholar] [CrossRef]
- Belousova, E.A.; Griffin, W.L.; O’Reilly, S.Y.; Fisher, N.I. Igneous zircon: Trace element composition as an indicator of source rock type. Contrib. Mineral. Petrol. 2002, 143, 602–622. [Google Scholar] [CrossRef]
- Harley, S.L.; Kelly, N.M. Zircon tiny but timely. Elements 2007, 3, 13–18. [Google Scholar] [CrossRef]
- Xiang, W.; Griffin, W.L.; Jie, C.; Pinyun, H.; Xiang, L.I. U and Th contents and Th/U ratios of zircon in felsic and mafic magmatic rocks: Improved zircon-melt distribution coefficients. Acta Geol. Sin. (Engl. Ed.) 2011, 85, 164–174. [Google Scholar] [CrossRef]
- Kudryashov, N.M.; Skublov, S.G.; Galankina, O.L.; Udoratina, O.V.; Voloshin, A.V. Abnormally high-hafnium zircon from rare-metal pegmatites of the Vasin-Mylk deposit (the northeastern part of the Kola Peninsula). Geochemistry 2020, 80, 125489. [Google Scholar] [CrossRef]
- Velikoslavinsky, D.A. Petrology of the Vyborg rapakivi massif. In Trudy Lab. Geol. Dokembriya. 3; (In Russian). USSR: Moscow, Russia, 1953; 142p. [Google Scholar]
- Haapala, I.; Rämö, O.T. Petrogenesis of the Proterozoic rapakivi granites of Finland. Geol. Soc. Am. Spec. Pap. 1990, 246, 275–286. [Google Scholar] [CrossRef]
- Sharkov, E.V. Middle-Proterozoic anorthosite-rapakivi granite complexes: An example of within plate magmatism in abnormally thick crust: Evidence from the East European Craton. Prec. Res. 2010, 183, 689–700. [Google Scholar] [CrossRef]
- Larin, A.M. Granite Rapakivi and the Associating Rocks; Nauka Publisher: St. Petersburg, Russia, 2011; 356p. (In Russian) [Google Scholar]
- Härmä, P. Natural stone exploration in the classic Wiborg rapakivi granite batholith of southeastern Finland—New insights from integration of lithological, geophysical and structural data. Geol. Surv. Finl. 2020, 411, 90. [Google Scholar] [CrossRef]
- Bulakh, A.G.; Gavrilenko, V.V.; Panova, E.G. Rapakivi granite in St. Petersburg: Architecture and mineralogical-petrografical observations. Vestnik SPbSU. Ser. 7. Geol. Geogr. 2016, 3, 40–53. (In Russian) [Google Scholar] [CrossRef]
- Bulakh, A.G.; Popov, G.N.; Yanson, S.Y.; Ivanov, M.A. New data on the granite pedestal of the monument to Peter the Great “The Bronze Horseman” in Saint Petersburg. J. Min. Inst. 2021, 248, 180–189. [Google Scholar] [CrossRef]
- Belyaev, A.M. Mineralogical and geochemical specialization of the Vyborg rapakivi granite massif. Vestnik Leningrad Univ. Ser. 7. Geol. Geogr. 1983, 6, 17–26. (In Russian) [Google Scholar]
- Rämö, O.T.; Turkki, V.; Mänttäri, I.; Heinonen, A.; Larjamo, K.M.; Lahaye, Y. Age and isotopic fingerprints of some plutonic rocks in the Wiborg rapakivi granite batholith with special reference to the dark wiborgite of the Ristisaari Island. Bull. Geol. Soc. Finl. 2014, 86, 71–91. [Google Scholar] [CrossRef]
- Salonen, L. 238U series radionuclides as a source of increased radioactivity in groundwater originating from Finnish bedrock. IAHS Publ. 1994, 222, 71–84. Available online: https://silo.tips/download/radioactivity-in-groundwater-originating-from-finnish-bedrock (accessed on 20 October 2023).
- Nikishin, V.V.; Blinov, P.A.; Fedorov, V.V.; Nikishina, E.K.; Tokarev, I.V. Analysis of the problems of high-quality drinking water extraction from underground water intakes on Vysotsky Island in the Vyborg district of the Leningrad region. J. Min. Inst. 2023. Available online: https://pmi.spmi.ru/index.php/pmi/article/view/15915 (accessed on 20 October 2023).
- Heinonen, A.; Mänttäri, I.; Rämö, O.T.; Andersen, T.; Larjamo, K. A priori evidence for zircon antecryst entrainment in megacrystic Proterozoic granites. Geology 2016, 44, 227–230. [Google Scholar] [CrossRef]
- Hinton, R.W.; Upton, B.G.J. The chemistry of zircon: Variations within and between large crystals from syenite and alkali basalt xenoliths. Geochim. Cosmochim. Acta 1991, 55, 3287–3302. [Google Scholar] [CrossRef]
- Fedotova, A.A.; Bibikova, E.V.; Simakin, S.G. Ion-microprobe zircon geochemistry as an indicator of mineral genesis during geochronological studies. Geochem. Intern. 2008, 46, 912–927. [Google Scholar] [CrossRef]
- McDonough, W.F.; Sun, S.-S. The composition of the Earth. Chem. Geol. 1995, 120, 223–253. [Google Scholar] [CrossRef]
- Hoskin, P.W.O.; Schaltegger, U. The composition of zircon and igneous and metamorphic petrogenesis. Rev. Min. Geochem. 2003, 53, 27–62. [Google Scholar] [CrossRef]
- Finch, R.J.; Hanchar, J.M. Structure and chemistry of zircon and zircon-group minerals. Rev. Min. Geochem. 2003, 53, 1–25. [Google Scholar] [CrossRef]
- Geisler, T.; Schleicher, H. Improved U–Th–total Pb dating of zircons by electron microprobe using a simple new background modeling procedure and Ca as a chemical criterion of fluid-induced U-Th-Pb discordance in zircon. Chem. Geol. 2000, 163, 269–285. [Google Scholar] [CrossRef]
- Fu, B.; Page, F.Z.; Cavosie, A.J.; Fournelle, J.; Kita, N.T.; Lackey, J.S.; Wilde, S.A.; Valley, J.W. Ti-in-zircon thermometry: Applications and limitations. Contrib. Miner. Petrol. 2008, 156, 197–215. [Google Scholar] [CrossRef]
- Levashova, E.V.; Mamykina, M.E.; Skublov, S.G.; Galankina, O.L.; Li, Q.L.; Li, X.H. Geochemistry (TE, REE, Oxygen) of zircon from leucogranites of the Belokurikhinsky Massif, Gorny Altai, as indicator of formation conditions. Geochem. Int. 2023, 1–17. [Google Scholar] [CrossRef]
- Heinonen, A.P.; Andersen, T.; Rämö, O.T. Re-evaluation of rapakivi petrogenesis: Source constraints from the Hf isotope composition of zircon in the rapakivi granites and associated mafic rocks of southern Finland. J. Petrol. 2010, 51, 1687–1709. [Google Scholar] [CrossRef]
- Ushikubo, T.; Kita, N.T.; Cavosie, A.J.; Wilde, S.A.; Rudnick, R.L.; Valley, J.W. Lithium in Jack Hills zircons: Evidence for extensive weathering of Earth's earliest crust. Earth Planet. Sci. Lett. 2008, 272, 666–676. [Google Scholar] [CrossRef]
- De Hoog, J.C.M.; Lissenberg, C.J.; Brooker, R.A.; Hinton, R.; Trail, D.; Hellebrand, E. Hydrogen incorporation and charge balance in natural zircon. Geochim. Cosmochim. Acta 2014, 141, 472–486. [Google Scholar] [CrossRef]
- Beskin, S.M.; Marin, Y.B. Granite systems with rare-metal pegmatites. Geol. Ore Depos. 2020, 62, 554–563. [Google Scholar] [CrossRef]
- Lukkari, S.; Thomas, R.; Haapala, I. Crystallization of the Kymi topaz granite stock within the Wiborg rapakivi granite batholith, Finland: Evidence from melt inclusions. Canad. Miner. 2009, 47, 1359–1374. [Google Scholar] [CrossRef]
- Asthana, D.; Pophare, A.M.; Kumar, H. Neoarchaean Dongargarh rapakivi A-type granites and its relationship to Pitepani tholeiites. Gondwana Geol. Mag. 2014, 16, 25–40. [Google Scholar]
- Mumpton, F.A.; Roy, R. Hydrothermal stability studies of the zircon-thorite group. Geochim. Cosmochim. Acta 1961, 21, 217–238. [Google Scholar] [CrossRef]
- Xie, L.; Wang, R.; Chen, X.; Qiu, J.; Wang, D. Th-rich zircon from peralka line A-type granite: Mineralogical features and petrological implications. Chin. Sci. Bull. 2005, 50, 809–817. [Google Scholar] [CrossRef]
- Rubin, J.N.; Henry, C.D.; Price, J.G. Hydrothermal zircons and zircon overgrowths, Sierra Blanca Peaks, Texas. Amer. Miner. 1989, 74, 865–869. [Google Scholar]
- Breiter, K.; Förster, H.J.; Škoda, R. Extreme P-, Bi-, Nb-, Sc-, U- and F-rich zircon from fractionated perphosphorous granites: The peraluminous Podlesí granite system, Czech Republic. Lithos 2006, 88, 15–34. [Google Scholar] [CrossRef]
- Hoshino, M.; Kimata, M.; Nishida, N.; Shimizu, M.; Akasaka, T. Crystal chemistry of zircon from granitic rocks, Japan: Genetic implications of HREE, U and Th enrichment. N. Jb. Miner. Abh. 2010, 187, 167–188. [Google Scholar] [CrossRef]
- Park, C.; Song, Y.; Chung, D.; Kang, I.M.; Khulganakhuu, C.; Yi, K. Recrystallization and hydrothermal growth of high U–Th zircon in the Weondong deposit, Korea: Record of post-magmatic alteration. Lithos 2016, 260, 268–285. [Google Scholar] [CrossRef]
- Anderson, Ε.B.; Burakov, Β.E.; Pazukhin, Ε.M. High-Uranium zircon from “Chernobyl Lavas”. Radiochim. Acta 1993, 60, 149–152. [Google Scholar] [CrossRef]
- Geisler, T.; Burakov, B.E.; Zirlin, V.; Nikolaeva, L.; Pöml, P.A. Raman spectroscopic study of high-uranium zircon from the Chernobyl. Eur. J. Miner. 2005, 17, 883–894. [Google Scholar] [CrossRef]
Figure 1.
Scheme showing the geological structure of zone 8 at the Vozrozhdenie rapakivi granite deposit. Legend: 1—coarse-grained ovoid-rich granites of phase II (wiborgites); 2—trachytoid granites of phase III; 3—contact-altered granites of phase III; 4—joint sets (a—1st order, b—2nd order); 5—zircon sampling site (N 60°50′51″ E 28°59′12″). Inset shows the location of the deposit (modified after [22]).

Figure 2.
(a) View of the quarry at the Vozrozhdenie deposit. The arrow shows the location of the pegmatite vein. (b) The site at which sample 110 was taken. A symmetrically zonal-structured granitic pegmatite vein in porphyry-like biotite granites. The length of the hammer from the head to the bill is 18 cm.

Figure 3.
BSE image of zircon with analytical points: (a) EPMA method (off scale) and (b) SIMS method (crater is about 20 µm in diameter). Points are numbered as in Table 1 and Table 2.

Figure 4.
(a–f) Co-variation diagrams showing the compositional variations of the studied zircon (EPMA method).
Figure 4.
(a–f) Co-variation diagrams showing the compositional variations of the studied zircon (EPMA method).

Figure 5.
(a–f) Co-variation diagrams showing the compositional variations of trace elements of the studied zircon (SIMS method).
Figure 5.
(a–f) Co-variation diagrams showing the compositional variations of trace elements of the studied zircon (SIMS method).

Figure 6.
Zircon REE distribution patterns normalized to CI chondrite [25]. The grey patterns show the zircons from the rapakivi granites of the Suomenniemi Massif, located at the northeastern flank of the Wiborg Massif, Finland [31].

Figure 7.
(a–f) Co-variation diagrams showing the compositional variations of REE of the studied zircon (SIMS method).
Figure 7.
(a–f) Co-variation diagrams showing the compositional variations of REE of the studied zircon (SIMS method).


Table 1.
EPMA analysis (wt%) of zircon from a pegmatite vein hosted in the rapakivi granites of the Wiborg Massif.
Table 1.
EPMA analysis (wt%) of zircon from a pegmatite vein hosted in the rapakivi granites of the Wiborg Massif.
| Element/Spot | 22 | 23 | 24 | 25 | 26 | 27 | 28 | 29 | 30 | 31 | 32 | 33 |
|---|---|---|---|---|---|---|---|---|---|---|---|---|
| SiO2 | 16.28 | 20.33 | 16.56 | 17.74 | 15.96 | 16.35 | 16.16 | 17.64 | 16.44 | 19.07 | 16.84 | 19.99 |
| ZrO2 | 35.63 | 42.11 | 33.82 | 33.08 | 30.37 | 30.98 | 31.44 | 31.95 | 31.47 | 39.56 | 30.03 | 42.11 |
| HfO2 | 1.76 | 2.27 | 1.85 | 1.66 | 1.48 | 1.44 | 1.40 | 1.57 | 1.56 | 2.27 | 1.47 | 2.12 |
| ThO2 | 9.16 | 4.41 | 9.41 | 14.52 | 18.08 | 18.34 | 17.93 | 8.89 | 9.73 | 6.26 | 18.08 | 3.79 |
| UO2 | 0.67 | 0.42 | 0.54 | 0.69 | 0.75 | 0.70 | 0.69 | 0.60 | 0.63 | 0.54 | 0.70 | 0.44 |
| P2O5 | 2.06 | 1.24 | 1.87 | 2.17 | 2.03 | 2.00 | 2.05 | 1.67 | 1.64 | 1.57 | 2.14 | 1.23 |
| CaO | 0.46 | 0.70 | 0.41 | 0.57 | 0.59 | 0.66 | 0.63 | 0.50 | 0.47 | 0.40 | 0.61 | 0.57 |
| FeO | 7.04 | 4.78 | 8.81 | 3.02 | 6.14 | 2.16 | 2.32 | 10.33 | 8.21 | 4.99 | 6.91 | 8.81 |
| Al2O3 | 2.33 | 1.86 | 2.15 | 2.26 | 2.06 | 2.15 | 2.04 | 2.51 | 2.32 | 2.17 | 2.19 | 2.12 |
| Y2O3 | 5.12 | 3.90 | 4.34 | 4.84 | 3.96 | 4.39 | 4.25 | 4.33 | 4.20 | 4.58 | 4.57 | 3.91 |
| Nb2O5 | 0.24 | 0.27 | 0.34 | 0.30 | 0.26 | 0.30 | 0.30 | 0.24 | 0.39 | 0.20 | 0.27 | 0.13 |
| Ce2O3 | 0.70 | 0.54 | 0.55 | 0.72 | 0.55 | 0.64 | 0.62 | 0.61 | 0.64 | 0.68 | 0.53 | 0.51 |
| Dy2O3 | 0.69 | 0.55 | 0.56 | 0.68 | 0.48 | 0.52 | 0.48 | 0.54 | 0.59 | 0.64 | 0.60 | 0.53 |
| Ta2O5 | 1.63 | 0.88 | 1.90 | 1.49 | 1.42 | 1.48 | 1.23 | 1.64 | 1.94 | 1.08 | 0.94 | 1.05 |
| Total | 83.76 | 84.25 | 83.09 | 83.74 | 84.14 | 82.11 | 81.53 | 83.01 | 80.22 | 84.01 | 85.87 | 87.30 |
Table 2.
Trace element concentrations (ppm) in zircon from a pegmatite vein hosted in the rapakivi granites of the Wiborg Massif.
Table 2.
Trace element concentrations (ppm) in zircon from a pegmatite vein hosted in the rapakivi granites of the Wiborg Massif.
| Element/Spot | 1 | 2 | 3 | 4 | 5 | 6 | 7 | 8 | 9 |
|---|---|---|---|---|---|---|---|---|---|
| La | 1908 | 1742 | 2173 | 1860 | 1411 | 2375 | 874 | 1748 | 1740 |
| Ce | 4454 | 4036 | 4164 | 6380 | 4157 | 5583 | 4059 | 5390 | 6882 |
| Pr | 571 | 520 | 664 | 807 | 544 | 708 | 457 | 717 | 826 |
| Nd | 2432 | 2179 | 2796 | 3584 | 2434 | 3116 | 2172 | 3251 | 3719 |
| Sm | 1155 | 1079 | 1166 | 1734 | 1177 | 1299 | 1124 | 1492 | 1902 |
| Eu | 47.6 | 44.8 | 41.3 | 71.3 | 45.9 | 53.6 | 50.1 | 55.1 | 84.9 |
| Gd | 1930 | 1726 | 1821 | 2824 | 1932 | 2129 | 1776 | 2346 | 2679 |
| Dy | 3353 | 3221 | 3794 | 5463 | 3764 | 4306 | 4053 | 5306 | 6827 |
| Er | 4083 | 3900 | 4178 | 6561 | 4289 | 4735 | 4830 | 6313 | 8416 |
| Yb | 6204 | 6393 | 6875 | 10,754 | 6903 | 8143 | 7882 | 10,442 | 14,431 |
| Lu | 697 | 692 | 863 | 1273 | 851 | 982 | 1042 | 1398 | 1868 |
| Li | 3.02 | 11.6 | 5.76 | 1.04 | 2.77 | 3.64 | 0.75 | 0.67 | 0.69 |
| P | 6286 | 5526 | 4685 | 7683 | 6260 | 7402 | 4746 | 8426 | 9047 |
| Ca | 2171 | 2526 | 1929 | 2796 | 2733 | 2334 | 2205 | 1974 | 1691 |
| Ti | 693 | 12,565 | 734 | 1281 | 1509 | 1144 | 2589 | 1381 | 2236 |
| Sr | 23.5 | 26.5 | 21.0 | 40.1 | 29.8 | 31.3 | 69.3 | 36.1 | 22.2 |
| Y | 28,282 | 24,927 | 28,724 | 43,717 | 27,670 | 33,159 | 30,917 | 36,185 | 51,524 |
| Nb | 2117 | 3510 | 1590 | 2384 | 2337 | 2997 | 2017 | 1497 | 1952 |
| Ba | 369 | 388 | 504 | 363 | 330 | 376 | 673 | 321 | 524 |
| Hf | 7421 | 5863 | 6315 | 11,160 | 6567 | 11,575 | 17,364 | 15,775 | 16,150 |
| Th | 105,603 | 85,635 | 87,848 | 125,257 | 92,994 | 146,245 | 58,613 | 80,589 | 46,399 |
| U | 3528 | 3488 | 4024 | 6243 | 4301 | 4659 | 2706 | 5745 | 6825 |
| Th/U | 29.9 | 24.6 | 21.8 | 20.1 | 21.6 | 31.4 | 21.7 | 14.0 | 6.80 |
| Eu/Eu* | 0.10 | 0.10 | 0.09 | 0.10 | 0.09 | 0.10 | 0.11 | 0.09 | 0.11 |
| Ce/Ce* | 1.03 | 1.03 | 0.84 | 1.26 | 1.15 | 1.04 | 1.55 | 1.16 | 1.39 |
| ΣREE | 26,835 | 25,532 | 28,535 | 41,311 | 27,508 | 33,432 | 28,319 | 38,459 | 49,374 |
| ΣLREE | 9366 | 8477 | 9797 | 12,630 | 8547 | 11,783 | 7562 | 11,106 | 13,167 |
| ΣHREE | 16,267 | 15,931 | 17,531 | 26,876 | 17,739 | 20,296 | 19,584 | 25,805 | 34,221 |
| LuN/LaN | 3.52 | 3.83 | 3.83 | 6.60 | 5.81 | 3.98 | 11.5 | 7.71 | 10.3 |
| LuN/GdN | 2.92 | 3.25 | 3.83 | 3.65 | 3.56 | 3.73 | 4.75 | 4.82 | 5.64 |
| SmN/LaN | 0.97 | 0.99 | 0.86 | 1.49 | 1.34 | 0.88 | 2.06 | 1.37 | 1.75 |
Disclaimer/Publisher’s Note: The statements, opinions and data contained in all publications are solely those of the individual author(s) and contributor(s) and not of MDPI and/or the editor(s). MDPI and/or the editor(s) disclaim responsibility for any injury to people or property resulting from any ideas, methods, instructions or products referred to in the content. |
© 2023 by the authors. Licensee MDPI, Basel, Switzerland. This article is an open access article distributed under the terms and conditions of the Creative Commons Attribution (CC BY) license (https://creativecommons.org/licenses/by/4.0/).
Share and Cite
MDPI and ACS Style
Skublov, S.G.; Petrov, D.A.; Galankina, O.L.; Levashova, E.V.; Rogova, I.V. Th-Rich Zircon from a Pegmatite Vein Hosted in the Wiborg Rapakivi Granite Massif. Geosciences 2023, 13, 362. https://doi.org/10.3390/geosciences13120362
AMA Style
Skublov SG, Petrov DA, Galankina OL, Levashova EV, Rogova IV. Th-Rich Zircon from a Pegmatite Vein Hosted in the Wiborg Rapakivi Granite Massif. Geosciences. 2023; 13(12):362. https://doi.org/10.3390/geosciences13120362
Chicago/Turabian StyleSkublov, Sergey G., Dmitriy A. Petrov, Olga L. Galankina, Ekaterina V. Levashova, and Ilona V. Rogova. 2023. "Th-Rich Zircon from a Pegmatite Vein Hosted in the Wiborg Rapakivi Granite Massif" Geosciences 13, no. 12: 362. https://doi.org/10.3390/geosciences13120362
Note that from the first issue of 2016, this journal uses article numbers instead of page numbers. See further details here.