
Urban Seismic Networks: A Worldwide Review


Istituto Nazionale di Geofisica e Vulcanologia, Osservatorio Nazionale Terremoti, 00143 Rome, Italy
*
Author to whom correspondence should be addressed.
Appl. Sci. 2023, 13(24), 13165; https://doi.org/10.3390/app132413165
Submission received: 10 November 2023
/
Revised: 1 December 2023
/
Accepted: 7 December 2023
/
Published: 11 December 2023
(This article belongs to the Special Issue Advanced Research in Seismic Monitoring and Activity Analysis)
Abstract
:Seismic networks in urban areas today represent key infrastructure to better address the tasks of earthquake preparation and mitigation in the pre-event phase, and are an important knowledge tool supporting disaster risk management during seismic crises and post-disaster recovery. In the last fifteen years, a decrease in instrumentation costs and the development of new low-cost devices have enhanced the deployment of several monitoring and experimental networks worldwide. This paper conducts a review of scientific work that refer to the deployment of Urban Seismic Networks (USN) in order to define the current state of the art. We collected a list of more than one hundred USNs worldwide that were operative within the period from 1994–2023. For each USN, we report the locations and objectives along with information about the timing, coverage, geometry, and technical characteristics (sensors and transmission). By reviewing all these aspects, this paper offers important insights to provide guidelines for new implementations, bearing in mind that the interest in monitoring urban areas is expected to continue to increase in the near future driven by population growth in urbanized areas.
1. Introduction
Spreading seismic instrumentation to obtain diffuse earthquake observations is considered among the main technical achievements of seismology since the mid-20th century [1,2,3], with seismic networks starting to develop worldwide. At their beginning, networks for seismic monitoring implemented at a local-scale and targeted to urbanized area were normally employed exclusively for short-term seismological studies or experiments. The planning and possibility of building permanent or at least long-term seismic networks within an urban environment fundamentally began in the mid-1990s. These possibilities have been greatly favored by the opportunities offered by new technological devices such as digital systems for acquisition and transmission, and their development has been further influenced by the modern transformation of urban centers into great metropolitan areas worldwide. Moreover, the increasing trend of population growth in urban areas is expected to become accentuated even more in the near future; it has been estimated that more than 60% of the world’s population will live in urban areas by 2030 [4]. The growth of urban centers is the main reason that the number of people killed or injured due to earthquakes has increased in the last century and is expected to increase further in the future [5,6]. In several recent earthquakes, the effects have been destructive in precisely the most highly vulnerable urbanized areas (e.g., China in 2008, Italy in 2009 and 2016, Haiti in 2010 and 2021, Nepal in 2015, and Turkey–Syria in 2023). Many of these earthquakes caused disproportionate damage and casualties with respect to the size of their shocks [5,7].
Therefore, the increased consciousness of seismic risk in certain urban centers has resulted in likewise increased attention to monitoring of these areas, with particular attention focused on the most vulnerable and most exposed locations. Networks especially designed for earthquake monitoring may reveal crucial tools for other tasks to connected with seismic phenomena, such as scientific studies, earthquake warning, and decision support systems. In this work, we refer to such infrastructure as “Urban Seismic Networks” (USN).
The purposes of USNs is generally different than “traditional” country scale-networks. The latter typology is usually intended for earthquake observation and seismological studies on a broad scale. Although both types of networks can be integrated, each has its own characteristics and peculiarities while sharing the objective of earthquake risk reduction, as suggested by D’Alessandro et al. (2019) [8]. In particular, urban-scale networks have distinct characteristics with respect to country-scale networks in terms of their coverage areas and density of nodes, which may even differ to some order of magnitude. The technical choices about the type of sensors and data transmission may differ as well.
As the number of USNs, regardless the specific application, has been increasing over the last two decades, we recognize the importance of providing a complete picture on the topic of USNs, looking in particular at their design and at their technical characteristics and how these are related to the specific objectives of each urban network. For this purpose, we retrieved information on 105 USNs implemented worldwide. These networks’ objectives and technical characteristics have been categorized to make for an easier synthesis.
USNs represent crucial infrastructure because of the practical and scientific challenges they support, which is even more the case looking to the future perspective. This work can represent a reference and a practical guideline for future planners of urban networks.
2. USN Catalogue
We collected information about 105 different USNs. The collection criteria were basically two: (i) the earthquake network should mainly cover an urbanized area (town, city, or metropolitan area) and (ii) it should have been active at least for some months. Moreover, measurements encompassing the systematic repositioning of sensors rather than their simultaneous recording as a proper network were excluded. We did not include deployments of sensors in different non-contiguous urban areas. Such situations do not describe independent and complete networks with characteristics that can be easily quantified (e.g., number of sensors or covered area). As an example, what are often referred as citizen–based or community-based networks usually show a patchy distribution over many different urban areas and even different countries [9,10,11].
Several characteristics are reported in this review paper to characterize the purposes related to the deployment of each USN: the position, number of nodes, area covered, main objective, and secondary objectives (where indicated). Moreover, specific network-related characteristics such as the timing (start, duration, and end of recording), type of sensors, and transmission system were summarized.
It is worth pointing out that all information was retrieved as-is from the listed references without making any critical interpretations of the details provided by the authors. All the desires information was retrieved from the paper(s) or websites describing the networks. Unfortunately, sometimes details about the data transmission were not reported (16% of the USNs). Furthermore, certain USNs evolved over time, in these cases, we report the most up-to-date information available.
To provide a detailed framework of the USNs, general information, i.e., location, objectives, and sources, are reported in Table 1, whereas specific characteristics such as operating time, coverage, density, and technical features of the instruments are reported in Table 2. Moreover, in the following sub-paragraphs we describe and analyze each of these aspects characterizing the USNs.
2.1. Geographical Distribution
The worldwide distribution of USNs (Table 1) is shown in Figure 1a. The networks are not uniformly distributed around the world; North America and the Euro-Mediterranean region are the two zones where most of the USNs are located (Figure 1b,c). A total of 37 different countries are present in the catalogue. The USA, Italy, and Turkey are the most represented, with 13, 9, and 7 USNs, respectively. Several cities represented the target for more than one urban network over the time, mainly driven by their high seismic hazard. These include Istanbul (Turkey), Bursa (Turkey), Quito (Ecuador), Bishkek (Kyrgyzstan), Bucharest (Romania), Gyeongju (South Korea), Los Angeles (USA), and Bogotà (Colombia), to mention only some of them.
The distribution of USNs roughly follows the global seismic hazard zoning (Figure 2); however, there is not a clear correlation. In Figure 2, the colour shades represent the global earthquake hazard as proposed by [12]; in particular, they indicate the expected Peak Ground Acceleration (PGA) with 10% of excedance in 50 years. Most USNs are located along the Pacific Ocean coasts, both western and eastern, where the probability of excedance of the ground motion is high (PGA > 4 m/s2 according to [12]. Several others are in areas where the expected ground motion is generally between 2 and 5 m/s2, e.g., in southern Europe and south-eastern Asia. Only few USNs are located in regions with lower hazard, e.g., northern Europe and eastern North America, where the expected shaking is characterised by PGA < 2 m/s2. Finally, some USNs even fall into very low hazard zones with PGA < 0.5 m/s2.
Figure 2.
Global seismic hazard map from [12] and locations of urban seismic networks (USNs). The histogram indicates the frequency of expected PGA (m/s2) corresponding to the USN locations.
Figure 2.
Global seismic hazard map from [12] and locations of urban seismic networks (USNs). The histogram indicates the frequency of expected PGA (m/s2) corresponding to the USN locations.


Table 1.
General information of the collected USNs.
| ID | Country | City-Met. Area | Objective 1 | Objective 2 | Objective 3 | Source (s) |
|---|---|---|---|---|---|---|
| 1 | Turkey | Bursa | Site effect research | [13] | ||
| 2 | Greece | Thessaloniki | Site effect research | [14] | ||
| 3 | USA | Anchorage | Earthquake monitoring | Site effect research | [15,16] | |
| 4 | Colombia | Medellin | Earthquake monitoring | Early warning | [17] | |
| 5 | Netherlands | Groningen | Earthquake monitoring | Other | [18,19,20,21] | |
| 6 | Japan | Yokohama | Seismic intensity mapping | Earthquake monitoring | Post Event damage assessment | [22,23,24] |
| 7 | USA | Oakland | Seismic intensity mapping | [25] | ||
| 8 | Colombia | Bogotà | Site effect research | Post Event damage assessment | Seismic intensity mapping | [26,27] |
| 9 | Colombia | Armenia | Earthquake monitoring | [28,29] | ||
| 10 | Turkey | Izmit | Earthquake monitoring | [30] | ||
| 11 | Greece | Athens | Earthquake monitoring | [31,32] | ||
| 12 | Kazakhstan | Almaty | Earthquake monitoring | [33] | ||
| 13 | Germany | Cologne | Site effect research | [34] | ||
| 14 | Usa | Spokane | Earthquake monitoring | [35] | ||
| 15 | Turkey | Istanbul | Post Event damage assessment | Early warning | Seismic intensity mapping | [36,37] |
| 16 | Canada | Ottawa | Site effect research | Earthquake monitoring | [38] | |
| 17 | Romania | Bucharest | Seismic intensity mapping | Earthquake monitoring | [39] | |
| 18 | Turkey | Bursa | Earthquake monitoring | [40] | ||
| 19 | Romania | Bucharest | Earthquake monitoring | Site effect research | [41] | |
| 20 | Canada | Vancouver | Seismic intensity mapping | Site effect research | [42] | |
| 21 | Japan | Tokyo | Other | Seismic intensity mapping | Site effect research | [43,44,45] |
| 22 | USA | Anchorage | structural monitoring | Site effect research | [46,47,48,49] | |
| 23 | Iran | Bam | Site effect research | [50] | ||
| 24 | Italy | Potenza | Site effect research | [51] | ||
| 25 | Iran | Tabriz | Site effect research | [52] | ||
| 26 | Iran | Tehran | Earthquake monitoring | [53] | ||
| 27 | USA | Portland | Site effect research | [54] | ||
| 28 | Switzerland | Basel | Earthquake monitoring | Other | Site effect research | [55,56,57,58] |
| 29 | Mexico | Mexico City | Earthquake monitoring | Site effect research | [59] | |
| 30 | Colombia | Bogotà | Earthquake monitoring | [29] | ||
| 31 | Indonesia | Yogyakarta | Site effect research | [60] | ||
| 32 | Lebanon | Beirut | Site effect research | [61] | ||
| 33 | India | Delhi | Site effect research | [62,63,64,65] | ||
| 34 | Iceland | Hveragerdi | Earthquake monitoring | Site effect research | [66] | |
| 35 | Taiwan | Taipei | Site effect research | Earthquake monitoring | [67] | |
| 36 | Japan | Tokyo | Early warning | [68] | ||
| 37 | Turkey | Istanbul | Site effect research | Earthquake monitoring | [37] | |
| 38 | China | Chengdu | Earthquake monitoring | Seismic intensity mapping | [69] | |
| 39 | Chile | Santiago de Chile | Site effect research | [70] | ||
| 40 | India | Anjar | Site effect research | Earthquake monitoring | [71] | |
| 41 | Turkey | Izmir | Seismic intensity mapping | Site effect research | Post Event damage assessment | [72] |
| 42 | Kyrgyzstan | Bishkek | Site effect research | [73,74,75] | ||
| 43 | Turkey | Istanbul | Early warning | [76,77] | ||
| 44 | Canada | Vancouver | structural monitoring | Post Event damage assessment | [78] | |
| 45 | Italy | Norcia | Site effect research | [79,80] | ||
| 46 | Uzbekistan | Tashkent | Site effect research | [75] | ||
| 47 | Tajikistan | Dushanbe | Site effect research | [75,81] | ||
| 48 | Ecuador | Quito | Earthquake monitoring | Site effect research | [82] | |
| 49 | Taiwan | Taiwan | Early warning | Seismic intensity mapping | [83,84,85] | |
| 50 | New Zealand | Christchurch | Earthquake monitoring | Site effect research | [86,87] | |
| 51 | USA | Los Angeles | Seismic intensity mapping | structural monitoring | Early warning | [88,89] |
| 52 | Mexico | Jalisco | Earthquake monitoring | [90] | ||
| 53 | Kyrgyzstan | Karakol | Site effect research | [75,91] | ||
| 54 | China | Zhaotong | Early warning | [92] | ||
| 55 | UAE | Dubai | Seismic intensity mapping | [93] | ||
| 56 | Tajikistan | Khorog | Site effect research | [75] | ||
| 57 | China | Fujian | Early warning | [94] | ||
| 58 | Greece | Lefkada | Seismic intensity mapping | Site effect research | [95,96] | |
| 59 | UAE | Abu Dhabi | Post Event damage assessment | structural monitoring | [97,98] | |
| 60 | Switzerland | St. Gallen | Earthquake monitoring | [99] | ||
| 61 | Kyrgyzstan | Naryn | Site effect research | [75,100] | ||
| 62 | Indonesia | Jakarta | Other | [101] | ||
| 63 | Malta | Malta | Earthquake monitoring | [102] | ||
| 64 | Greece | Kalochori | Earthquake monitoring | Site effect research | structural monitoring | [103] |
| 65 | Kazakhstan | Almaty | Site effect research | [75] | ||
| 66 | USA | Washington | Site effect research | [104] | ||
| 67 | Algeria | Chlef | Site effect research | [105] | ||
| 68 | USA | Los Angeles | structural monitoring | Post Event damage assessment | Site effect research | [106] |
| 69 | United Kingdom | London | Other | [107] | ||
| 70 | USA | Ithaca | Earthquake monitoring | [108] | ||
| 71 | Italy | Perugia-Foligno | Earthquake monitoring | Seismic intensity mapping | [109] | |
| 72 | Ecuador | Quito | Site effect research | [110] | ||
| 73 | New Zealand | Dunedin | Earthquake monitoring | Other | [111] | |
| 74 | South Korea | Gyeongju | Early warning | Earthquake monitoring | [112] | |
| 75 | Italy | Acquasanta Terme | Site effect research | Earthquake monitoring | [113,114] | |
| 76 | France | Rhône Velley | Site effect research | [115] | ||
| 77 | South Korea | Gyeongju | Earthquake monitoring | [112] | ||
| 78 | USA | Uni. Cal. Berkeley | Earthquake monitoring | Early warning | [116] | |
| 79 | USA | Los Angeles | structural monitoring | Post Event damage assessment | [117] | |
| 80 | Greece | Chania | Other | Seismic intensity mapping | [118] | |
| 81 | China | Zigong | Site effect research | [119] | ||
| 82 | Taiwan | Taipei | Site effect research | Earthquake monitoring | [120] | |
| 83 | India | Ahmedabad | Site effect research | [121] | ||
| 84 | Spain | Lorca | Seismic intensity mapping | [122] | ||
| 85 | USA | Humboldt State Uni. | Earthquake monitoring | Early warning | [116] | |
| 86 | Japan | Tokio | Earthquake monitoring | [123] | ||
| 87 | Macedonia | Ohrid | Site effect research | structural monitoring | [124] | |
| 88 | South Korea | Pohang | Earthquake monitoring | [125] | ||
| 89 | South Korea | Gyeongju | Earthquake monitoring | [126] | ||
| 90 | Italy | Acireale | Seismic intensity mapping | structural monitoring | [127,128] | |
| 91 | Italy | Catania | Early warning | structural monitoring | Seismic intensity mapping | [129,130,131] |
| 92 | Italy | Ragusa | Seismic intensity mapping | structural monitoring | [8,132] | |
| 93 | Italy | Messina | Seismic intensity mapping | structural monitoring | [8,132] | |
| 94 | USA | Salt Lake City | Other | [133] | ||
| 95 | Finland | Helsinki | Earthquake monitoring | Other | [134] | |
| 96 | Singapore | Singapore | Earthquake monitoring | [135] | ||
| 97 | Greece | Athens | Earthquake monitoring | [32] | ||
| 98 | Spain | Barcelona | Other | [136] | ||
| 99 | Switzerland | Lucerne | Site effect research | [137] | ||
| 100 | Finland | Helsinki | Earthquake monitoring | Other | [138] | |
| 101 | Romania | Bucharest | structural monitoring | [139] | ||
| 102 | Switzerland | Sion | Earthquake monitoring | Site effect research | [140] | |
| 103 | Italy | Camerino | Post Event damage assessment | Seismic intensity mapping | Site effect research | [141,142] |
| 104 | Norway | Oslo | Earthquake monitoring | [143] | ||
| 105 | Kyrgyzstan | Bishkek | Early warning | [144] |
Table 2.
Details of the collected USNs.
| ID | Nodes | Area km2 | Density Log (Nodes/km2) | Start Year | Duration Years | Sensor Type | Transmission |
|---|---|---|---|---|---|---|---|
| 1 | 6 | 375 | −1.80 | 1992 | 5.9 | Force Balance Accelerometer | No trasmission |
| 2 | 10 | 28 | −0.45 | 1993 | 0.25 | Velocimeter | No trasmission |
| 3 | 37 | 500 | −1.13 | 1995 | 28 | Force Balance Accelerometer | Real-time |
| 4 | 32 | 800 | −1.40 | 1996 | 21 | Force Balance Accelerometer | No info |
| 5 | 163 | 1600 | −0.99 | 1997 | 26 | Velocimeter and accelerometer | No info |
| 6 | 159 | 600 | −0.58 | 1997 | 13.5 | Force Balance Accelerometer | Real-time |
| 7 | 13 | 120 | −0.97 | 1998 | 7 | Force Balance Accelerometer | Near real-time |
| 8 | 32 | 500 | −1.19 | 1999 | 3 | Force Balance Accelerometer | Real-time |
| 9 | 10 | 19,000 | −3.28 | 1999 | 19 | Velocimeter and accelerometer | Real-time |
| 10 | 10 | 3600 | −2.56 | 1999 | 0.17 | Velocimeter | No trasmission |
| 11 | 8 | 200 | −1.40 | 1999 | 0.27 | Velocimeter and accelerometer | No trasmission |
| 12 | 15 | 400 | −1.43 | 2000 | 10 | Force Balance Accelerometer | No info |
| 13 | 44 | 660 | −1.18 | 2001 | 0.14 | Velocimeter | No trasmission |
| 14 | 6 | 130 | −1.34 | 2001 | 0.08 | Velocimeter | No info |
| 15 | 110 | 1500 | −1.13 | 2002 | 5 | Force Balance Accelerometer | Near real-time |
| 16 | 14 | 720 | −1.71 | 2002 | NA | Force Balance Accelerometer | Real-time |
| 17 | 13 | 45 | −0.54 | 2003 | 8 | Force Balance Accelerometer | Near real-time |
| 18 | 11 | 5000 | −2.66 | 2003 | 0.5 | Velocimeter | No info |
| 19 | 34 | 620 | −1.26 | 2003 | 0.8 | Velocimeter | No trasmission |
| 20 | 21 | 60 | −0.46 | 2004 | NA | Force Balance Accelerometer | Near real-time |
| 21 | 3800 | 3100 | 0.09 | 2004 | 19 | MEMS Accelerometer | Real-time |
| 22 | 43 | 2 | 1.33 | 2004 | 19 | Velocimeter and accelerometer | Real-time |
| 23 | 8 | 10 | −0.10 | 2004 | 0.14 | Velocimeter | No trasmission |
| 24 | 11 | 12 | −0.04 | 2004 | 0.66 | Velocimeter | No trasmission |
| 25 | 11 | 70 | −0.80 | 2004 | 0.23 | Velocimeter | No info |
| 26 | 24 | 4100 | −2.23 | 2004 | 14 | Velocimeter | No info |
| 27 | 16 | 320 | −1.30 | 2005 | 13 | Force Balance Accelerometer | No info |
| 28 | 21 | 75 | −0.55 | 2005 | 12.2 | Force Balance Accelerometer | Real-time |
| 29 | 28 | 3700 | −2.12 | 2006 | 17 | Velocimeter | Real-time |
| 30 | 9 | 720 | −1.90 | 2006 | 17 | Velocimeter | Real-time |
| 31 | 15 | 1650 | −2.04 | 2006 | 0.25 | Velocimeter | No trasmission |
| 32 | 10 | 20 | −0.30 | 2006 | 0.5 | Velocimeter | No trasmission |
| 33 | 20 | 1550 | −1.89 | 2007 | 6.9 | Force Balance Accelerometer | Real-time |
| 34 | 14 | 3 | 0.67 | 2007 | 15.2 | MEMS Accelerometer | Near real-time |
| 35 | 12 | 330 | −1.44 | 2008 | 12 | Force Balance Accelerometer | Real-time |
| 36 | 39 | 360 | −0.97 | 2008 | 3 | Velocimeter and accelerometer | Near real-time |
| 37 | 13 | 25 | −0.28 | 2008 | 8 | Force Balance Accelerometer | Real-time |
| 38 | 80 | 18,000 | −2.35 | 2008 | 6 | Force Balance Accelerometer | Real-time |
| 39 | 8 | 0.3 | 1.43 | 2008 | 0.16 | Velocimeter | No trasmission |
| 40 | 3 | 0.15 | 1.30 | 2008 | 0.25 | Velocimeter | No trasmission |
| 41 | 16 | 1000 | −1.80 | 2008 | 10 | Velocimeter and accelerometer | Real-time |
| 42 | 19 | 1000 | −1.72 | 2008 | 0.25 | Velocimeter | No trasmission |
| 43 | 20 | 20 | 0.00 | 2009 | 2 | MEMS Accelerometer | Real-time |
| 44 | 170 | 15,000 | −1.95 | 2009 | 6 | MEMS Accelerometer | Real-time |
| 45 | 15 | 20 | −0.12 | 2009 | 0.38 | Velocimeter | No trasmission |
| 46 | 5 | 300 | −1.78 | 2009 | 0.25 | Velocimeter | No trasmission |
| 47 | 45 | 280 | −0.79 | 2009 | 0.6 | Velocimeter | No trasmission |
| 48 | 18 | 570 | −1.50 | 2009 | 13.25 | Force Balance Accelerometer | No trasmission |
| 49 | 636 | 36,200 | −1.76 | 2010 | 13 | Low cost MEMS | Near real-time |
| 50 | 180 | 2250 | −1.10 | 2010 | 2.5 | Low cost MEMS | Near real-time |
| 51 | 500 | 1400 | −0.45 | 2011 | 12 | Low cost MEMS | Near real-time |
| 52 | 28 | 65,000 | -3.37 | 2011 | 6 | Velocimeter | Real-time |
| 53 | 16 | 240 | −1.18 | 2011 | 0.29 | Velocimeter | No trasmission |
| 54 | 12 | 0.1 | 2.08 | 2012 | 1 | MEMS Accelerometer | Real-time |
| 55 | 5 | 320 | −1.81 | 2012 | 10.7 | Force Balance Accelerometer | Real-time |
| 56 | 12 | 20 | −0.22 | 2012 | 0.27 | Velocimeter | No trasmission |
| 57 | 125 | 120,000 | −2.98 | 2012 | 10.1 | Velocimeter and accelerometer | Real-time |
| 58 | 21 | 9 | 0.37 | 2013 | 9 | Low cost MEMS | Real-time |
| 59 | 61 | 970 | −1.20 | 2013 | 2 | Force Balance Accelerometer | Real-time |
| 60 | 7 | 350 | −1.70 | 2013 | 1.4 | Force Balance Accelerometer | Real-time |
| 61 | 16 | 24 | −0.18 | 2013 | 0.33 | Velocimeter | No trasmission |
| 62 | 96 | 500 | −0.72 | 2013 | 0.41 | Velocimeter | No info |
| 63 | 8 | 315 | −1.60 | 2014 | 9 | Velocimeter | Real-time |
| 64 | 7 | 13 | −0.27 | 2014 | 3 | Force Balance Accelerometer | Real-time |
| 65 | 16 | 800 | −1.70 | 2014 | 0.25 | Velocimeter | No trasmission |
| 66 | 27 | 170 | −0.80 | 2014 | 0.8 | Velocimeter | No info |
| 67 | 9 | 10 | −0.05 | 2014 | 0.82 | Velocimeter | No trasmission |
| 68 | 300 | 480 | −0.20 | 2015 | 8 | Low cost MEMS | Near real-time |
| 69 | 5 | 15 | −0.48 | 2015 | 0.15 | Velocimeter | No trasmission |
| 70 | 12 | 30 | −0.40 | 2015 | 1 | Velocimeter | No trasmission |
| 71 | 20 | 1000 | −1.70 | 2016 | 5 | Low cost MEMS | No trasmission |
| 72 | 20 | 330 | −1.22 | 2016 | 2.16 | Velocimeter | No trasmission |
| 73 | 14 | 110 | −0.90 | 2016 | 0.13 | Velocimeter | No trasmission |
| 74 | 6 | 50 | −0.92 | 2016 | 0.08 | Low cost MEMS | Real-time |
| 75 | 5 | 3 | 0.22 | 2016 | 0.58 | Velocimeter and accelerometer | Real-time |
| 76 | 3 | 5 | −0.22 | 2016 | 0.85 | Velocimeter | No info |
| 77 | 27 | 1200 | −1.65 | 2016 | 0.3 | Velocimeter | No trasmission |
| 78 | 9 | 1.5 | 0.78 | 2016 | 2 | Low cost MEMS | Real-time |
| 79 | 220 | 1 | 2.34 | 2017 | 6 | Low cost MEMS | Real-time |
| 80 | 11 | 35 | −0.50 | 2017 | 6 | MEMS Accelerometer | Real-time |
| 81 | 8 | 0.15 | 1.73 | 2017 | 2 | Force Balance Accelerometer | No info |
| 82 | 140 | 3450 | −1.39 | 2017 | 6 | Velocimeter | Real-time |
| 83 | 12 | 320 | −1.43 | 2017 | 0.08 | Velocimeter | No info |
| 84 | 11 | 15 | −0.13 | 2017 | 5.8 | Low cost MEMS | Real-time |
| 85 | 13 | 0.8 | 1.21 | 2017 | 2 | Low cost MEMS | Real-time |
| 86 | 300 | 12000 | −1.60 | 2017 | 5.7 | Force Balance Accelerometer | Real-time |
| 87 | 8 | 1.5 | 0.73 | 2017 | 0.5 | Force Balance Accelerometer | No info |
| 88 | 13 | 45 | −0.54 | 2017 | 1.4 | Velocimeter | No info |
| 89 | 200 | 3600 | −1.26 | 2017 | 3.3 | Velocimeter | Real-time |
| 90 | 7 | 2 | 0.54 | 2018 | 2 | Low cost MEMS | Near real-time |
| 91 | 20 | 5 | 0.60 | 2018 | 3 | MEMS Accelerometer | Real-time |
| 92 | 12 | 3 | 0.60 | 2018 | 5 | Low cost MEMS | Near real-time |
| 93 | 5 | 1 | 0.70 | 2018 | 5 | Low cost MEMS | Near real-time |
| 94 | 32 | 3 | 1.03 | 2018 | 0.09 | Velocimeter | No info |
| 95 | 112 | 200 | −0.25 | 2018 | 0.3 | Velocimeter | No trasmission |
| 96 | 88 | 1000 | −1.06 | 2019 | 0.08 | Velocimeter | No trasmission |
| 97 | 6 | 325 | −1.73 | 2019 | 0.08 | Velocimeter | No info |
| 98 | 19 | 10 | 0.28 | 2019 | 1 | Velocimeter and accelerometer | Near real-time |
| 99 | 9 | 17 | −0.28 | 2019 | 0.67 | Velocimeter | No trasmission |
| 100 | 113 | 450 | −0.60 | 2019 | 0.7 | Velocimeter | No trasmission |
| 101 | 15 | 25 | −0.22 | 2020 | 2.5 | Low cost MEMS | Real-time |
| 102 | 6 | 21 | −0.54 | 2020 | 2.13 | Velocimeter and accelerometer | Real-time |
| 103 | 14 | 10 | 0.15 | 2021 | 2 | Low cost MEMS | Near real-time |
| 104 | NA | 450 | 2021 | 2 | Low cost MEMS | Real-time | |
| 105 | 32 | 150 | −0.67 | NA | NA | Low cost MEMS | Real-time |
2.2. Objectives
The implementation of USNs enables several tasks, particularly those related to the management of the seismic risk and applications related to civil engineering problems. However, other applications in the broad field of monitoringare gaining interest as well (c.f. [145]).
Each USN is established to accomplish a clear objective. This main objective can sometimes be followed by secondary objectives. Therefore, logistic and technological choices of each USN are properly conceived to cope with these objectives. We identified six recurring objectives among the collected USNs:
- Earthquake early warning. USNs are usually designed to provide a warning in the very first moments after the occurrence of a strong earthquake. Such systems are based on the early processing of the seismic signals recorded at the network nodes by means of opportune algorithms. The two possible approaches to this task are the “network- or regional-based” and the “on site (or single station)” approaches. The on-site approach is the one most commonly adopted by USNs devoted to earthquake early warning. It does not require an extended network, and the alert time is reduced compared to the regional approach, which need not necessarily include the accurate location of the event. For this reason, unlike the regional approach, low-cost sensors can be employed and transmission can even be neglected [146]. In particular, on-site early warning systems are based on the detection of P-wave arrivals and estimation of the intensity of the incoming ground shaking in a few fractions of second, which is done by taking advantage of the difference in velocity between the P and S waves [147,148,149].
- Earthquake monitoring. USNs are frequently established to monitor earthquakes in urban areas. they are sometimes implemented as permanent networks, while other times they are expressly temporary and established only after the main earthquake of a sequence with the main objective of monitoring any following aftershocks.
- Post-event damage assessment. This group of networks includes those specially planned for the implementation of systems that function to estimate earthquake damage, casualties, or losses in short time after an earthquake [150,151]. They are often referred to as “rapid response systems” because they account for their task immediately after an earthquake. They can quickly support the creation of basic seismic intensity maps.
- Seismic intensity mapping. Under this definition, we have grouped the networks which provide measurements of the ground motion intensity at the nodes of the urban network after an earthquake. These measurements can be straightforwardly used to map the distribution of the peak ground shaking for a given event as well as to produce products known as shakemaps. These depict the spatial distribution of peak ground motion, usually taking into account the recorded peak ground acceleration (PGA) or peak-ground velocity (PGV) together with information about the event source (e.g., magnitude, location) and the local site amplification and attenuation laws [152,153]. The distribution of ground motion shaking intensity is a very useful parameter for evaluating the potential damage. While this objective may partially overlap with the previously listed objectives, it is distinguished by its timing, as the action need not necessarily take place immediately after the earthquake.
- Site effect research. Among the factors that control the expected ground motion (i.e., the seismic hazard), site effects play a major role. Site effects can be generally defined as alterations to the earthquake’s characteristics in terms of amplitude, frequency, and duration of the wave field due to specific stratigraphic or topographic conditions [154]. Such effects can be significant, and can be evaluated with a variety of sensors and methods [155,156,157,158]. Their assessment is critical in the built environment, and is the reason behind the implementation of several USNs (usually temporary ones) worldwide.
- Structural health monitoring. Earthquakes can affect the state of health of buildings and structures in general. Certain structures can be considered strategic because of their function or value. Networks conceived to monitor the vibrations of such strategic buildings and their behaviour over time represent fundamental tools to establish protection strategies and preserve their functions, and possibly their cultural value, in case of damaging earthquakes [8].
Moreover, grouped under “other“, we classified USNs with less common objectives such as the implementation of decision support systems [43,45,118], seismological studies [101,107,133,136], and monitoring of geothermal stimulation, mines, or other industrial activities [18,55,134,138]. For each record in Table 1, the main objective is reported along with any secondary ones where provided.
The temporal trends of the objectives indicate that not all the objectives are prominent in the same way or within the same period (Figure 3). For instance, USNs for earthquake monitoring and seismic site response have been adopted all along the analysed period, while USNs for earthquake early warning have been implemented only since 2008, and their number has increased relatively quickly (c.f. [159]).
The frequency of occurrence of the various objectives, distinguishing between the main and the secondary ones, is reported in Figure 3. Considering only the main objective, one-third of the considered USNs were established for earthquake monitoring; the study of site effects and the assessment of ground motion intensity are the second- and third-most frequent objectives, respectively. Considering the primary and secondary tasks together, earthquake monitoring and site effects make up the objectives for more than 40% of the collected USNs.
2.3. Duration
The date of starting observation (year, and sometimes month and day) is provided for all the USNs except for a single one. Conversely, the exact date of ending observation is provided only for the fixed-term networks. Certain USNs have been planned as permanent monitoring infrastructure, and remain active at present. For other networks, the authors did not provide any clues as to whether the networks were established as fixed-term or permanent ones. In many of these cases, we have been able to find further references providing information about the activity of the networks. Therefore, for these USNs, the duration reported in Table 2 actually indicates a “minimum duration”, i.e., the time span between the starting of the network and the last evidence of activity. For the active networks, the duration is considered to be current until 2023.
The corresponding temporal bar for each of the collected networks is reported in Figure 4. The first urban networks were implemented in the early 1990s, and until the early 2000s there were only a few networks. Subsequently, the number of new operating USNs has steadily increased for about fifteen years. This trend has been sharply increasing since 2016-17, with the relatively lower number of USNs reported in the last few years ascribed to the most recent networks still being unpublished. In addition, Figure 4 reports the frequency density distribution of the duration. About 40% of the USNs have a duration shorter than one year, and 60% last for less than five years. Only approximately the 20% of the networks have been continuously operating for more than ten years.
The operating time of a network is tightly constrained by its objective(s). Of course, other factors may influence on the duration, most of all the economic resources needed to keep a network working. The duration as a function of the main objective is displayed in Figure 5. For a given objective, the duration may span a wide range of years. Part of this dispersion is due to limits in the assessment of the exact duration, as explained above. However, differences between various objectives are recognizable, even though no universal conclusions can be derived.
Networks for earthquake monitoring include the widest range of durations, as they comprise both USNs designed for seismic surveillance (i.e., long-term monitoring) and USNs conceived to monitor only a single seismic sequence or seismic swarm. Although the durations cover more than a decade, the networks for site effects are clearly clustered, as is predictable, towards the shortest duration (even less than one year). Conversely, no short-duration networks are targeted to report ground motion intensity. The networks for structural health monitoring have variable duration, and are mostly implemented as permanent infrastructure.
Figure 4.
Temporal bar graph of the collected USNs; the inset displays the frequency density distribution of USN durations.
Figure 4.
Temporal bar graph of the collected USNs; the inset displays the frequency density distribution of USN durations.


2.4. Coverage
With regard to the number of nodes and the area covered by each USN, the catalogue includes a very wide range of combinations; both factors span several orders of magnitude, and their their ratio (i.e., number of nodes per unit area) likewise covers a wide range of density values.
The number of nodes forming a USN depends on several factors. Usually, these factors result from the combination of the objectives to be accomplished and the area being monitored, although the logistical needs and available financial resources can contribute to quantifying the sensor nodes to be installed, as some networks can be integrated over time, especially permanent ones. Most of the USNs have some tens of nodes, with only sixteen of them having more than a hundred sensors. USNs usually extend between some tens and few thousands of km2 (see Figure 6). It is worth highlighting that the size of the area covered by a USN often does not appear to be strictly related to the extension of the corresponding urban/metropolitan area where it is located, and might depend on the network’s purpose as well. Sometimes the target of an USN is only a portion of a given urban area, e.g., a campus, historic center, or neighborhood, while sometimes it extends to the far outskirts of the urbanized territory, and may include different contiguous urban centers under a single network. In these latter cases, USNs can extend up to 104–105 km2, representing real regional-scale networks. As far as density is concerned, the densest USNs count even more than 100 nodes per km2, while in the loosest networks a single monitoring site covers a surface greater than 1000 km2. However, most USNs have densities ranging between 0.01 and 1 nodes/km2 (Figure 6).
D’Alessandro et al. (2019) [8] classified only those seismic networks characterized by specific combinations of values of area and density as “urban-scale networks” (the solid grey contour in Figure 6b,c). Actually, only a few USNs in our collection fall within this definition; these fourteen USNs all fall within a limited part of it. Therefore, the definition of a USN provided by [8] is too restrictive from the point of view of the covered area and too inclusive when it postulates very-high-density networks over relatively large areas. This is due to the very limited collection underlying their observations, as they reported only five USNs implemented in Italy).
Our catalogue helps to better define USNs in terms of the combination of covered area, number of nodes, and their ratio. Most USNs lie within the red region in Figure 6b, which can be considered the typical combination of covered area and number of nodes for a USN: a few tens of nodes spread over a surface of 10–1000 km2. Moreover, we found that when considering all the USNs and including all the objectives, the density of the USN decreases linearly on a log–log scale when the covered area increases (see Figure 6c). This scale relationship is very clear, and can be used as a guideline when planning new USNs. This relation may suggest the indicative number of sites necessary to establish a new network over an urban area of a given extension, or conversely, can provide indications of the maximum extension achievable by the network when a given number of sensors is available. Of course, the final plan of a new network must support all its specific targets, which are peculiar and unique for each case. However, exploiting the indications from a vast collection of other applications can represent decisive support as well as a measure of comparison with the state of the art.
Figure 6.
(a) Histograms for number of nodes, covered area, and network density. (b) Scatter plots of node number versus covered area; the coloured shades represent the intensity of observations and the dashed line encloses the area with greatest intensity. (c) Scatter plots of network density versus covered area; the blue dashed line and the shaded region indicate the regression line and the 95% confidence interval, respectively. The numbers refer to the IDs in Table 1 and Table 2.

2.5. Technical Characteristics
This subparagraph resumes the information concerning the type of sensors employed in the USNs and their transmission systems. The network geometry is another important feature of the monitoring networks that we have investigated. We provide considerations about this latter aspect in a devoted paragraph.
2.5.1. Sensors
The type of sensors employed in the network is a key feature of each USN. We classified the sensors adopted by each USN into five different types: (i) velocimeter, (ii) force balance accelerometer, (iii) both velocimeter and accelerometer, (iv) MEMS accelerometer, and (v) low-cost MEMS.
The balanced use of velocimeters and accelerometers at different nodes is sometimes adopted to exploit the advantages of both types of sensors; therefore, a dedicated group has been considered to cover this case. For other combinations of sensors, which are far less frequent, the prevalent typology is considered. The distinction between short-period and broad-band sensors is not reported at this stage, though considerations are provided in the text. The most widely employed sensors (in more than 40% of USN) are velocimeters; force balance accelerometers and low-cost MEMS occur less frequently, being encountered in about 20% of the USNs, and the two remaining groups are even less frequent (Figure 7).
The main difference between the two MEMS (micro-electro-mechanical systems) groups is the cost for a single device, though this obviously carries a number of implications. This distinction concerns the performance of the sensors as well, in particular the self-noise level, the type of output (usually analog for better sensors), and the stability against environmental conditions. The literature has largely investigated the performance of several models of MEMS sensors [116,160,161,162,163,164,165]. In terms of self noise spectral density, a level in the order of 10−5 m · s−2/ in the band 1–10 Hz can been considered as a rough boundary between the two groups of MEMS sensors.
In the selection of appropriate sites to establish a seismic network, considerations about the background seismic noise play a role. The seismic noise affects the detection capability; thus, sites should be as quiet as possible. A great portion of the noise power, especially at high frequencies, is related to human activities (so-called urban or cultural noise). Inevitably, urban areas suffer strong levels of seismic noise, and these noisy areas are unsuitable to host networks only conceived and designed to locate earthquakes. These conditions represent a relevant limitation for USNs, and are the most usual reason for poorly performing sensors (especially in terms of self-noise and bandwidth), particularly for certain objectives. On the other hand, cheaper sensors allow applications with higher density at equal cost, which could desirable for USNs. These are among the reasons that lower quality devices such as MEMS sensors and even low-cost MEMS can be suitable for seismological applications and employed in a variety of applications in the broad field of seismology, including in USNs [166,167,168]. Their use started only about fifteen years ago, and has been increasing sharply over the last decade (Figure 7). During the first decade of their development, USNs were mainly strong-motion networks based essentially on accelerometers (Figure 7).
Figure 7.
Temporal trends of the types of sensors adopted by USNs listed in Table 2 and their frequency of occurrence.
Figure 7.
Temporal trends of the types of sensors adopted by USNs listed in Table 2 and their frequency of occurrence.

The choice of sensor typology is typically made based on the main objective; in fact, a coupling of the sensor type and main objective occurs very frequently, e.g., velocimeters for earthquake monitoring and site effect assessment, while several other combinations never occur (Figure 8). Both force-balance accelerometers and low-cost MEMS can be profitably employed in many different applications [167,169]
Other secondary aspects regarding sensors include the sampling rate, type of installation (surface, borehole), and natural period for velocimeters (short period, broad band, etc). This information is not always declared for the selected USNs; moreover, as our aim is to provide a schematic view of the solutions adopted for USNs, taking these aspects into account would be an unproductive complication.

2.5.2. Transmission
Concerning data transmission, we identified three classes: (i) real-time transmission; (ii) near-real-time transmission; and (iii) no transmission. For certain USNs, it was not possible to retrieve any information about the transmission type; these are classed as “no info”.
The difference between real-time and near-real-time can be subtle, and we were not able to verify whether different authors adopted the same definitions. We only gathered the information as it was provided, without performing any type of validation. Real-time transmission is the most commonly adopted choice, being implemented in almost the 40% of USNs; about one third of the networks were designed without any data transmission (Figure 9). Real-time (or even near-real time) transmission may have represented a limit for early USNs, while today technical solutions are easily feasible via internet connections (Figure 9), especially in urbanized areas. For this reason, the choice of transmission is not strictly and exclusively imposed only by the final objective of the USN, although a correspondence certainly exists (Figure 8); in fact, for the realization of certain objectives, e.g., site effect studies or characterization of structural health states, data transmission may be a non-essential requirement and local data storage may represent a rather more agile solution. For other objectives, however, such as earthquake monitoring and earthquake early warning, collecting data in real time is a fundamental prerequisite. In particular, reliable real-time transmission is indispensable for network-based early warning systems. Real-time transmission can additionally be useful for remote control of the correct functioning of acquisition stations without needing to reach the sites, at least periodically.
A summary of the main features for both the sensor and transmission types, recalling their pros and cons, is reported in Table 3. When planning a USN, these features should be evaluated together with the objective(s) of the network.
Table 3.
Summary of the main features of the various sensor and transmission types applicable for the implementation of a USN.
Table 3.
Summary of the main features of the various sensor and transmission types applicable for the implementation of a USN.
| Type | Pros | Cons | |
|---|---|---|---|
| SENSORS | Velocimeters | Wide range of devices (short-period to broad-band) and versatility. Generally higher sensitivity and lower self-noise level. High robustness and durability, suitable for long-term applications. Reliable reconstruction of the waveform in a wide frequency range. | Expensive and unaffordable for the implementation of a dense USN. Usually require quieter sites for the installation (vaults or post-hole configurations would be preferable, especially for broad-band sensors). Signals can saturate in case of strong motion. |
| Force Balance Accelerometers | High sensitivity. High robustness and durability: suitable for long-term applications. Signals do not saturate in case of strong motion. | Relatively expensive. Poor capability to record weak motions. | |
| MEMS sensors | Low unit cost, small size, and light weight, make them suitable for implementing a dense USN with a high number of sensors. Possible digital output; no need for a data-logger. Suitable for installations in noisy sites or buildings. | Generally low sensitivity and resolution and higher self-noise level. Usually limited durability and need for greater maintenance and replacement of non-functioning parts. | |
| TRANSMISSION | No transmission | Agile solution. No extra power consumption. Easier installations. No need for remote acquisition system. Suitable for temporary observations. | Fixed storage capacity. Periodic on-site maintenance to gather data. No telemetry of the monitoring sites. Early on-site elaborations can be exploited only locally. No possibility of checking the correct functioning of the system, without on-site visits. |
| Near or real-time | Immediate availability of data for end users. Extendable remote storage capacity. Possibility to share early on-site elaborations. Possibility of using the telemetry of the monitoring sites. Data back-up. | Higher power consumption. Remote storage infrastructure is required. Costs for data transmission can be relevant for large amounts of data, i.e., numerous devices with continuous recording at high sampling rates and for a long time. |
Figure 9.
Temporal trends of the types of transmission adopted by the USNs listed in Table 2 and their frequency of occurrence.
Figure 9.
Temporal trends of the types of transmission adopted by the USNs listed in Table 2 and their frequency of occurrence.

2.6. Network Geometry
The design of a network in an urban context represents a trade-off between external fixed geometrical constraints, high levels of noise, and the cost of preparing the sites [170]. Therefore, the geometry is a crucial aspect; however, it cannot be entirely planned.
The geometry affects the results in relation to the objective of the network. This is especially valid for networks designed to detect and locate earthquakes, as the results derive from the combination of observations at several different nodes. For this reason, the geometry plays a critical role in the precision and accuracy of the hypocentre locations as well as in estimation of the the magnitude [171,172]. The relevance of a planned geometry is relatively decreased for networks in which the observations are treated independently on a site-by-site basis (e.g., on-site early warning, assessing site effects, seismic intensity mapping), even though the geometry may affect the later data interpolation or modelling. Finally, other networks, such as those designed for structural health monitoring, are completely unaffected by geometry, as the observations at a given site are never combined with observations from other sites.
We have not classified the types of geometry in the USN catalogue. Although the positions of the nodes are sometimes provided, it was not possible to assess a metric to clearly and unambiguously support the grouping of USNs into distinct classes of geometries. However, we provide an overview of the various typologies of geometrical arrangements adopted by the USNs (Figure 10). From the reported examples, it is clear that the transition between regular and irregular geometries may not be sharp enough to define clear boundaries between these classes.
In most cases, the choice of the geometry is mainly aimed towards providing uniform coverage of the target urban area. However, geographical boundaries (e.g., coastlines), geological boundaries (the need to sample all soil types), and sometimes even administrative boundaries or permission issues can represent constraints when planning the geometry of a network. For all of these reasons, there are few networks in which the geometry can be deliberately designed. In certain cases, the networks are the results of superpositions of other sub-networks with different geometries, resulting in articulated final arrangements [39].
Regular networks forming grids with regular meshes are ideal solutions; however, they are hard to implement [92,120]. The arrangement sometimes aims to ensure homogeneous coverage with equally spaced nodes, even if through an irregular pattern [67,88] (Figure 10). In certain cases, part of the network is designed to form specific geometrical patterns, i.e., arrays (Figure 10), with several identical sensors deployed regularly (or almost regularly) at different scales [123,134,138]. Arrays enhance the seismic signals, allowing the detection of weaker signals and characterization of the wavefield. Finally, a few USNs include vertical arrays, with the deployment of several sensors in a given location at different depths [37,46,48,49,134]. Arrays are mostly used for seismological experiments, and mainly fall within the group of “other” objectives.
3. Concluding Remarks
The idea of focusing an earthquake monitoring network on a single urban areas has been widely exploited in the last decades, and has became a tool for a variety of different tasks.
USNs can be settled in a relatively short time compared to traditional large-scale networks, and the costs for their maintenance in the case of long-term applications are comparatively constrained. Of course, for certain specific objectives USN performance can be reduced with respect to large-scale networks, especially compared to those designed for seismic surveillance. However, in most cases USNs represent an excellent solution in the trade-off between time and costs on the one hand and performance and reliability on the other. In this review, we provide an overview of the application of this tool, focusing in particular on the technical characteristics. In addition, we aim to provide strategies for the planning and development of USNs (presented in Table 4). Each USN objective, together with any possible secondary tasks, entails numerous possible combinations between technical and operational elements. Table 3 and Table 4 provide recommendations on a wide range of such choices.
Although often designed as single-task infrastructure, USNs may enable multiple functions, especially in case of strong earthquakes. USNs can represent the core of an entire chain of actions, starting in the very early aftermath of earthquake detection (early warning systems) and revealing decisive information in the short term when supporting decision-making and rescue operations is crucial (post-event damage assessment, seismic intensity mapping), while other actions may only performed later (seismic site response, structural monitoring).
It is very likely that in the near future the interest in monitoring urban areas will continue to increase, driven by the expansion of urban centers and the consequent need to arrange mitigation and prevention actions [173,174]. The capabilities of new sensing networks based on fiber-optic cables have been explored and developed in the last few years [175,176,177,178,179,180,181,182,183]. A network based on distributed acoustic sensing (DAS) represents the ideal candidate for the future generation of USNs. At this early stage for this technology, the cost for DAS interrogation units are remarkable; conversely, the possibility of exploiting existing communication infrastructure and the contained costs for cable maintenance help to balance the overall cost. Such systems are very sensitive; they allow high spatial (sub-metric) and temporal (up to kHz) resolutions. The waveforms can be reconstructed with high fidelity in the band from 0.02 to 30 Hz, making their performance comparable to broadband seismometers [178,182,184]. In general, the main advantages are the possibility of exploiting expanding communication infrastructure and the potentially huge amount of high quality data.
According to Allen and Stogaitis (2022) [159], seismic networks are evolving from research-oriented projects into public safety infrastructure. From this perspective, in the near future USNs could be integrated with other networks as components of a multi-scale and multi-parametric system in a smart city context. Such a system could carry out several roles in the disaster cycle, not only involving earthquakes, both in the pre-event (preventions) and post-event (recovery) phases. Such integration includes the possibility of sharing crucial data during the phase of post-disaster decision-making (e.g., structural monitoring, power and water grids, transportation, energy, etc.) as well as with regard to climate and environmental parameters [185]. Stakeholders, civil protection authorities, decision-makers, the scientific community, and the whole of society are among the potential beneficiaries of the outcomes of this integrated multi-scale system for the reduction of seismic risk.
Table 4.
Schematic guidelines for the implementation of a USN according to the planned objective.
| Objective | Sensors | Transmission | Duration | Notes |
|---|---|---|---|---|
| Early Warning | All types can be theoretically used. The literature indicates that, due to their characteristics (c.f. Table 3), MEMS sensors are preferable. | Real-time transmission is necessary for more reliable systems based on the “on-site” approach. It is indispensable for the “network-based” approach. | To be planned as an open-ended application. | USNs are suitable for implementing the “on-site” early warning approach in urban areas and for critical infrastructure. |
| Earthquake Monitoring | Velocimeters are the most commonly employed sensors. According to specific purposes (e.g., the monitoring of strong local seismicity), force balance accelerometers or MEMS sensors can be suitable for integrating surveillance networks. | Data transmission is always recommended, especially for long-term monitoring campaigns (see Table 3). | Months to years, as well as a long-term task according to the specific USN’s needs. | Integration between the capabilities of different types of sensors at different nodes, or even at the same sites, can be exploited. |
| Post-Event Damage Assessment | Accelerometers are the most adapted to measuring strong motion. | Transmission is required. | To be planned as an open-ended application. | Regular geometries are recommended. |
| Seismic Intensity Mapping | Accelerometers are the most adapted to measuring strong motion. | Data transmission is required. | To be planned as an open-ended application. | Transmission can be essential for generating real-time shakemaps. |
| Site Effects Research | Velocimeters are usually adopted. The natural period of the sensor affects the bandwidth of the results. | Data transmission is not essential, though it can be useful for the reasons listed in Table 3. | The USN can be planned as a short-term application. | The distribution of USN nodes must be homogeneous and representative of the soil types and stratigraphic conditions. |
| Structural Health Monitoring | MEMS sensors are the most widely adopted; they represent a good trade-off between cost and quality. A free-field installation as a reference is recommended. | Data transmission is recommended. | To be planned as an open-ended application. | Critical infrastructure (bridges, distribution networks, etc.) and/or strategic buildings (hospitals, schools, fire stations, etc.) should represent the primary targets. |
Author Contributions
Conceptualization, A.D., A.C. and S.S.; methodology, A.D., A.C. and S.S.; formal analysis, S.S.; investigation, S.S. and A.C.; resources, S.S.; data curation, S.S.; writing—original draft preparation, S.S.; writing—review and editing, S.S., A.C. and A.D. All authors have read and agreed to the published version of the manuscript.
Funding
This research received no external funding.
Institutional Review Board Statement
Not applicable.
Data Availability Statement
Not applicable.
Acknowledgments
We thank Giovanni Vitale (Istituto Nazionale di Geofisica e Vulcanologia) for discussions about the topics of this paper. We thank the three anonymous reviewers for their useful comments on the earlier version of this manuscript.
Conflicts of Interest
Authors Salvatore Scudero, Antonio Costanzo and Antonino D’Alessandro were employed by the company Istituto Nazionale di Geofisica e Vulcanologia. The authors declare that the research was conducted in the absence of any commercial or financial relationships that could be construed as a potential conflict of interest.
Abbreviations
The following abbreviations are used in this manuscript:
| USN | Urban Seismic Networks |
| MEMS | Micro-Electro-Mechanical Systems |
| DAS | Distributed Acoustic Sensing |
References
- Trnkoczy, A.; Havskov, J.; Ottemöller, L. Seismic networks. In New Manual of Seismological Observatory Practice (NMSOP); Deutsches GeoForschungsZentrum GFZ: Potsdam, Germany, 2009; pp. 1–60. [Google Scholar]
- Oliveira, C.S. The main developments of Seismology and Earthquake Engineering since the early 1700s and the new challenges for a sustainable society. Bull. Earthq. Eng. 2022, 20, 4697–4863. [Google Scholar] [CrossRef]
- Ringler, A.T.; Anthony, R.E.; Aster, R.; Ammon, C.; Arrowsmith, S.; Benz, H.; Ebeling, C.; Frassetto, A.; Kim, W.Y.; Koelemeijer, P.; et al. Achievements and prospects of global broadband seismographic networks after 30 years of continuous geophysical observations. Rev. Geophys. 2022, 60. [Google Scholar] [CrossRef]
- United Nations, Department of Economic and Social Affairs. World Urbanization Prospects: The 2018 Revision; United Nations: New York, NY, USA, 2019. [Google Scholar]
- Holzer, T.L.; Savage, J.C. Global earthquake fatalities and population. Earthq. Spectra 2013, 29, 155–175. [Google Scholar] [CrossRef]
- Dollet, C.; Guéguen, P. Global occurrence models for human and economic losses due to earthquakes (1967–2018) considering exposed GDP and population. Nat. Hazards 2022, 110, 349–372. [Google Scholar] [CrossRef]
- So, E.; Platt, S. Earthquakes and their socio-economic Consequences. In Encyclopedia of Earthquake Engineering; Springer: Berlin/Heidelberg, Germany, 2014; pp. 1–26. [Google Scholar]
- D’Alessandro, A.; Costanzo, A.; Ladina, C.; Buongiorno, F.; Cattaneo, M.; Falcone, S.; La Piana, C.; Marzorati, S.; Scudero, S.; Vitale, G.; et al. Urban seismic networks, structural health and cultural heritage monitoring: The national earthquakes observatory (INGV, Italy) experience. Front. Built Environ. 2019, 5, 127. [Google Scholar] [CrossRef]
- Cochran, E.S.; Lawrence, J.F.; Christensen, C.; Jakka, R.S. The quake-catcher network: Citizen science expanding seismic horizons. Seismol. Res. Lett. 2009, 80, 26–30. [Google Scholar] [CrossRef]
- Luetgert, J.; Evans, J.; Hamilton, J.; Hutt, C.; Jensen, E.; Oppenheimer, D. NetQuakes-A new approach to urban strong-motion seismology. In Proceedings of the AGU Fall Meeting Abstracts, San Francisco, CA, USA, 14–18 December 2009; Volume 2009, p. S11B–1707. [Google Scholar]
- Calais, E.; Symithe, S.; Monfret, T.; Delouis, B.; Lomax, A.; Courboulex, F.; Ampuero, J.P.; Lara, P.; Bletery, Q.; Chèze, J.; et al. Citizen seismology helps decipher the 2021 Haiti earthquake. Science 2022, 376, 283–287. [Google Scholar] [CrossRef]
- Giardini, D.; Grünthal, G.; Shedlock, K.M.; Zhang, P. The GSHAP global seismic hazard map. Ann. Geofis. 1999, 42, 1225–1230. [Google Scholar] [CrossRef]
- Akyol, N.; Akıncı, A.; Eyidoǧan, H. Site amplification of S-waves in Bursa City and its vicinity, Northwestern Turkey: Comparison of different approaches. Soil Dyn. Earthq. Eng. 2002, 22, 579–587. [Google Scholar] [CrossRef]
- Lachet, C.; Hatzfeld, D.; Bard, P.Y.; Theodulidis, N.; Papaioannou, C.; Savvaidis, A. Site effects and microzonation in the city of Thessaloniki (Greece) comparison of different approaches. Bull. Seismol. Soc. Am. 1996, 86, 1692–1703. [Google Scholar] [CrossRef]
- Dutta, U.; Yang, Z. Anchorage Strong Motion Network: Maintenance and Data Archival; University of Alaska Anchorage: Anchorage, AK, USA, 2010. [Google Scholar]
- Thornley, J.; Douglas, J.; Dutta, U.; Yang, Z. Site Response Analysis of Anchorage, Alaska Using Generalized Inversions of Strong-Motion Data (2004–2019). Pure Appl. Geophys. 2022, 179, 499–525. [Google Scholar] [CrossRef]
- Casas, J.D.H.; Monsalve, G. Geological inferences about the upper crustal configuration of the Medellin–Aburra Valley (Colombia) using strong motion seismic records. Geod. Geodyn. 2018, 9, 67–76. [Google Scholar] [CrossRef]
- KNMI. Netherlands Seismic and Acoustic Network; Royal Netherlands Meteorological Institute (KNMI): De Bilt, The Netherlands, 1993. [Google Scholar] [CrossRef]
- Spetzler, J.; Dost, B. Hypocentre estimation of induced earthquakes in Groningen. Geophys. J. Int. 2017, 209, 453–465. [Google Scholar]
- Noorlandt, R.; Kruiver, P.P.; de Kleine, M.P.; Karaoulis, M.; de Lange, G.; Di Matteo, A.; von Ketelhodt, J.; Ruigrok, E.; Edwards, B.; Rodriguez-Marek, A.; et al. Characterisation of ground motion recording stations in the Groningen gas field. J. Seismol. 2018, 22, 605–623. [Google Scholar] [CrossRef] [PubMed]
- Spica, Z.J.; Nakata, N.; Liu, X.; Campman, X.; Tang, Z.; Beroza, G.C. The ambient seismic field at Groningen gas field: An overview from the surface to reservoir depth. Seismol. Res. Lett. 2018, 89, 1450–1466. [Google Scholar] [CrossRef]
- Midorikawa, S.; Abe, S. Real-time assessment of earthquake disaster in Yokohama based on dense strong-motion network. In Proceedings of the 12th World Conference in Earthquake Engineering, Auckland, New Zealand, 30 January–4 February 2000; Volume 30. [Google Scholar]
- Midorikawa, S. Dense strong-motion array in Yokohama, Japan, and its use for disaster management. In Directions in Strong Motion Instrumentation; Springer: Berlin/Heidelberg, Germany, 2005; pp. 197–208. [Google Scholar]
- Tsuda, K.; Archuleta, R.J.; Koketsu, K. Quantifying the spatial distribution of site response by use of the Yokohama high-density strong-motion network. Bull. Seismol. Soc. Am. 2006, 96, 926–942. [Google Scholar] [CrossRef]
- Evans, J.R.; Hamstra Jr, R.H.; Kündig, C.; Camina, P.; Rogers, J.A. TREMOR: A wireless MEMS accelerograph for dense arrays. Earthq. Spectra 2005, 21, 91–124. [Google Scholar] [CrossRef]
- Ojeda, A.; Martinez, S.; Bermudez, M.; Atakan, K. The new accelerograph network for Santa Fe De Bogota, Colombia and implications for microzonation. Soil Dyn. Earthq. Eng. 2002, 22, 791–797. [Google Scholar] [CrossRef]
- Cardona, O.D.; Bernal, G.A. Automatic system for post-earthquake evaluation of city damage in Bogota. In Proceedings of the 16th European Conference on Earthquake Engineering, Thessaloniki, Greece, 18 June 2018; pp. 18–21. [Google Scholar]
- Monsalve Jaramillo, H.; Correa Montaño, I.C.; Valencia Mina, W. Seismological observatory at Quindio University (OSQ): A firm long-term step toward resolving regional seismicity. Earth Sci. Res. J. 2005, 9, 85–98. [Google Scholar]
- Vargas, C.A.; Caneva, A.; Monsalve, H.; Salcedo, E.; Mora, H. Geophysical networks in Colombia. Seismol. Res. Lett. 2018, 89, 440–445. [Google Scholar] [CrossRef]
- Ito, A.; Uçer, B.; Bariʂ, S.; Nakamura, A.; Honkura, Y.; Kono, T.; Hori, S.; Hasegawa, A.; Pektaʂ, R.; Iʂikara, A.M. Aftershock activity of the 1999 Izmit, Turkey, earthquake revealed from microearthquake observations. Bull. Seismol. Soc. Am. 2002, 92, 418–427. [Google Scholar] [CrossRef]
- Papadimitriou, P.; Voulgaris, N.; Kassaras, I.; Kaviris, G.; Delibasis, N.; Makropoulos, K. The Mw = 6.0, 7 September 1999 Athens earthquake. Nat. Hazards 2002, 27, 15–33. [Google Scholar] [CrossRef]
- Kapetanidis, V.; Karakonstantis, A.; Papadimitriou, P.; Pavlou, K.; Spingos, I.; Kaviris, G.; Voulgaris, N. The 19 July 2019 earthquake in Athens, Greece: A delayed major aftershock of the 1999 Mw = 6.0 event, or the activation of a different structure? J. Geodyn. 2020, 139, 101766. [Google Scholar] [CrossRef]
- Abakanov, T.; Silacheva, N. Analysis of seismic effects in Almaty based on strong motion network data. Surv. Act.-Post-Earthq. Disaster. 2011, 53. Available online: https://www.researchgate.net/profile/Eka-Juliafad/publication/311087058_Brick_Characteristic_in_West_Sumatra/links/59b1eef8aca2728472d143e5/Brick-Characteristic-in-West-Sumatra.pdf#page=59 (accessed on 6 December 2023).
- Parolai, S.; Richwalski, S.M.; Milkereit, C.; Bormann, P. Assessment of the stability of H/V spectral ratios from ambient noise and comparison with earthquake data in the Cologne area (Germany). Tectonophysics 2004, 390, 57–73. [Google Scholar] [CrossRef]
- Wicks, C.; Weaver, C.; Bodin, P.; Sherrod, B. InSAR Evidence for an active shallow thrust fault beneath the city of Spokane Washington, USA. J. Geophys. Res. Solid Earth 2013, 118, 1268–1276. [Google Scholar] [CrossRef]
- Erdik, M.; Fahjan, Y.; Ozel, O.; Alcik, H.; Mert, A.; Gul, M. Istanbul earthquake rapid response and the early warning system. Bull. Earthq. Eng. 2003, 1, 157–163. [Google Scholar] [CrossRef]
- Kurtuluş, A. Istanbul geotechnical downhole arrays. Bull. Earthq. Eng. 2011, 9, 1443–1461. [Google Scholar] [CrossRef]
- Adams, J. Soil amplification in Ottawa from urban strong ground motion records. In Proceedings of the 9th Canadian Conference on Earthquake Engineering, Ottawa, ON, Canada, 26–29 June 2007; p. 1162. [Google Scholar]
- Craifaleanu, I.G.; Borcia, I.; Praun, I. Strong-motion networks in Romania and their efficient use in the structural engineering applications. In Earthquake Data in Engineering Seismology; Springer: Berlin/Heidelberg, Germany, 2011; pp. 247–259. [Google Scholar]
- Gok, E.; Polat, O. An assessment of the seismicity of the Bursa region from a temporary seismic network. Pure Appl. Geophys. 2012, 169, 659–675. [Google Scholar] [CrossRef]
- Ritter, J.R.; Balan, S.F.; Bonjer, K.P.; Diehl, T.; Forbriger, T.; Marmureanu, G.; Wenzel, F.; Wirth, W. Broadband urban seismology in the Bucharest metropolitan area. Seismol. Res. Lett. 2005, 76, 574–580. [Google Scholar] [CrossRef]
- Rosenberger, A.; Beverley, K.; Rogers, G. The new strong motion seismic network in southwest British Columbia, Canada. In Proceedings of the 13th World Conference on Earthquake Engineering, Vancouver, BC, Canada, 1–6 August 2004. [Google Scholar]
- Yamazaki, F.; Shimizu, Y. Super dense real-time monitoring of earthquakes for a city gas network in Japan. In Proceedings of the 17th International Symposium on Automation and Robotics in Construction, Madrid, Spain, 18–20 September 2000; pp. 581–586. [Google Scholar]
- Shimizu, Y.; Yamazaki, F.; Isoyama, R.; Ishida, E.; Koganemaru, K.; Nakayama, W. Development of realtime disaster mitigation system for urban gas supply network. In Proceedings of the the 13th WCEE, Vancouver, BC, Canada, 1–6 August 2004; pp. 1–6. [Google Scholar]
- Shimizu, Y.; Yamazaki, F.; Yasuda, S.; Towhata, I.; Suzuki, T.; Isoyama, R.; Ishida, E.; Suetomi, I.; Koganemaru, K.; Nakayama, W. Development of real-time safety control system for urban gas supply network. J. Geotech. Geoenviron. Eng. 2006, 132, 237–249. [Google Scholar] [CrossRef]
- Çelebi, M.; McCarthy, J.; Biswas, N.; Wald, L.; Page, R.; Steidl, J. Seismic monitoring of the Atwood building in Anchorage, Alaska; U.S. Geological Survey Fact Sheet 2004-3103; U.S. Geological Survey: Reston, VA, USA, 2004. [Google Scholar]
- Çelebi, M. Recorded earthquake responses from the integrated seismic monitoring network of the Atwood Building, Anchorage, Alaska. Earthq. Spectra 2006, 22, 847–864. [Google Scholar] [CrossRef]
- Thornley, P.J.; Dutta, P.U.; Yang, P.Z. Modeling the Site Response of a Downhole Array Site in Anchorage, Alaska. 2014. Available online: https://datacenterhub.org/resources/12292/download/10NCEE-000951.pdf (accessed on 6 December 2023).
- Çelebi, M. Highlights of a cursory study of behavior of three instrumented buildings during the Mw 7.1 Anchorage, Alaska, earthquake of 30 November 2018. Seismol. Res. Lett. 2020, 91, 56–65. [Google Scholar] [CrossRef]
- Jafari, M.K.; Ghayamghamian, M.R.; Davoodi, M.; Kamalian, M.; Sohrabi-Bidar, A. Site effects of the 2003 Bam, Iran, earthquake. Earthq. Spectra 2005, 21, 125–136. [Google Scholar] [CrossRef]
- Strollo, A.; Parolai, S.; Bindi, D.; Chiauzzi, L.; Pagliuca, R.; Mucciarelli, M.; Zschau, J. Microzonation of Potenza (Southern Italy) in terms of spectral intensity ratio using joint analysis of earthquakes and ambient noise. Bull. Earthq. Eng. 2012, 10, 493–516. [Google Scholar] [CrossRef]
- Haghshenas, E.; Jafari, M.; Bard, P.; Moradi, A.; Hatzfeld, D.; Chaljub, E.; Cornu, C.; Cotton, F.; Guéguen, P. Preliminary results of site effects assessment in the city of Tabriz (Iran) using earthquakes recording. In Proceedings of the Third Internation Symposium on the Effects of Surface Geology on Seismic Motion, Grenoble, France, 30 August–1 September 2006. [Google Scholar]
- Kahbasi, A.; Moradi, A. Earthquake-explosion discrimination using waveform cross-correlation technique for mines in southeast of Tehran. J. Seismol. 2016, 20, 569–578. [Google Scholar] [CrossRef]
- Frankel, A.; Grant, A. Site response, basin amplification, and earthquake stress drops in the Portland, Oregon Area. Bull. Seismol. Soc. Am. 2021, 111, 671–685. [Google Scholar] [CrossRef]
- Ripperger, J.; Kästli, P.; Fäh, D.; Giardini, D. Ground motion and macroseismic intensities of a seismic event related to geothermal reservoir stimulation below the city of Basel—observations and modelling. Geophys. J. Int. 2009, 179, 1757–1771. [Google Scholar] [CrossRef]
- Clinton, J.; Cauzzi, C.; Fäh, D.; Michel, C.; Zweifel, P.; Olivieri, M.; Cua, G.; Haslinger, F.; Giardini, D. The current state of strong motion monitoring in Switzerland. In Earthquake Data in Engineering Seismology: Predictive Models, Data Management and Networks; Springer: Dordrecht, The Netherlands, 2011; pp. 219–233. [Google Scholar]
- Michel, C.; Fäh, D.; Edwards, B.; Cauzzi, C. Site amplification at the city scale in Basel (Switzerland) from geophysical site characterization and spectral modelling of recorded earthquakes. Phys. Chem. Earth, Parts A/B/C 2017, 98, 27–40. [Google Scholar] [CrossRef]
- Swiss Seismological Service (SED). Monitoring of the Borehole Basel-1. Available online: http://www.seismo.ethz.ch/en/earthquakes/monitoring/special-networks/basel/monitoring-geothermal-borehole-in-basel/ (accessed on 28 August 2023).
- Quintanar, L.; Cárdenas-Ramírez, A.; Bello-Segura, D.; Espíndola, V.; Pérez-Santana, J.; Cárdenas-Monroy, C.; Carmona-Gallegos, A.; Rodríguez-Rasilla, I. A seismic network for the Valley of Mexico: Present status and perspectives. Seismol. Res. Lett. 2018, 89, 356–362. [Google Scholar] [CrossRef]
- Zega, B.; Zulfakriza, Z.; Rosalia, S.; Puspito, N. Seismic Hazard Potential in Yogyakarta Based on HVSR Curve Estimation. In IOP Conference Series: Earth and Environmental Science; IOP Publishing: Bristol, UK, 2022; Volume 1047, p. 012028. [Google Scholar]
- Brax, M.; Bard, P.Y.; Duval, A.M.; Bertrand, E.; Rahhal, M.E.; Jomaa, R.; Cornou, C.; Voisin, C.; Sursock, A. Towards a microzonation of the Greater Beirut area: An instrumental approach combining earthquake and ambient vibration recordings. Bull. Earthq. Eng. 2018, 16, 5735–5767. [Google Scholar] [CrossRef]
- Kumar, A.; Mittal, H.; Sachdeva, R.; Kumar, A. Indian strong motion instrumentation network. Seismol. Res. Lett. 2012, 83, 59–66. [Google Scholar] [CrossRef]
- Mittal, H.; Kumar, A.; Ramhmachhuani, R. Indian national strong motion instrumentation network and site characterization of its stations. Int. J. Geosci. 2012, 3, 25120. [Google Scholar] [CrossRef]
- Mittal, H.; Kumar, A.; Kumar, A. Site effects estimation in Delhi from the Indian strong motion instrumentation network. Seismol. Res. Lett. 2013, 84, 33–41. [Google Scholar] [CrossRef]
- Mittal, H.; Kumar, A.; Kumar, A.; Kumar, R. Analysis of ground motion in Delhi from earthquakes recorded by strong motion network. Arab. J. Geosci. 2015, 8, 2005–2017. [Google Scholar] [CrossRef]
- Halldorsson, B.; Sigbjornsson, R.; Schweitzer, J. ICEARRAY: The first small-aperture, strong-motion array in Iceland. J. Seismol. 2009, 13, 173–178. [Google Scholar] [CrossRef]
- Win-Gee, H.; Huang, B.S.; Wang, J.H.; Kou-Cheng, C.; Kuo-Liang, W.; Tsao, S.; Yu-Chung, H.; Chen, C.H. Seismic observations in the Taipei metropolitan area using the downhole network. Tao Terr. Atmos. Ocean. Sci. 2010, 21, 6. [Google Scholar]
- Nakamura, Y.; Saita, J.; Sato, T. On an earthquake early warning system (EEW) and its applications. Soil Dyn. Earthq. Eng. 2011, 31, 127–136. [Google Scholar] [CrossRef]
- Wen, R.; Ren, Y. Strong-motion observations of the Lushan earthquake on 20 April 2013. Seismol. Res. Lett. 2014, 85, 1043–1055. [Google Scholar] [CrossRef]
- Pilz, M.; Parolai, S.; Leyton, F.; Campos, J.; Zschau, J. A comparison of site response techniques using earthquake data and ambient seismic noise analysis in the large urban areas of Santiago de Chile. Geophys. J. Int. 2009, 178, 713–728. [Google Scholar] [CrossRef]
- Singh, A. Seismic hazard evaluation in Anjar city area of western India: Microtremor array measurement. Soil Dyn. Earthq. Eng. 2015, 71, 143–150. [Google Scholar] [CrossRef]
- Polat, O.; Ceken, U.; Uran, T.; Gok, E.; Yilmaz, N.; Beyhan, M.; Koc, N.; Arslan, B.; Yilmaz, D.; Utku, M. IzmirNet: A strong-motion network in metropolitan Izmir, Western Anatolia, Turkey. Seismol. Res. Lett. 2009, 80, 831–838. [Google Scholar] [CrossRef]
- Parolai, S.; Orunbaev, S.; Bindi, D.; Strollo, A.; Usupaev, S.; Picozzi, M.; Di Giacomo, D.; Augliera, P.; D’Alema, E.; Milkereit, C.; et al. Site effects assessment in Bishkek (Kyrgyzstan) using earthquake and noise recording data. Bull. Seismol. Soc. Am. 2010, 100, 3068–3082. [Google Scholar] [CrossRef]
- Ullah, S.; Bindi, D.; Pittore, M.; Pilz, M.; Orunbaev, S.; Moldobekov, B.; Parolai, S. Improving the spatial resolution of ground motion variability using earthquake and seismic noise data: The example of Bishkek (Kyrgyzstan). Bull. Earthq. Eng. 2013, 11, 385–399. [Google Scholar] [CrossRef]
- Pilz, M.; Abakanov, T.; Abdrakhmatov, K.; Bindi, D.; Boxberger, T.; Moldobekov, B.; Orunbaev, S.; Silacheva, N.; Ullah, S.; Usupaev, U.; et al. An overview on the seismic microzonation and site effect studies in Central Asia. Ann. Geophys. 2015, 58, S0104. [Google Scholar]
- Fleming, K.; Picozzi, M.; Milkereit, C.; Kuhnlenz, F.; Lichtblau, B.; Fischer, J.; Zulfikar, C.; Ozel, O. The self-organizing seismic early warning information network (SOSEWIN). Seismol. Res. Lett. 2009, 80, 755–771. [Google Scholar] [CrossRef]
- Zülfikar, A.; Fercan, N.; Tunç, S.; Erdik, M. Real-time earthquake shake, damage, and loss mapping for Istanbul metropolitan area. Earth Planets Space 2017, 69, 9. [Google Scholar] [CrossRef]
- Kaya, Y.; Ventura, C.; Huffman, S.; Turek, M. British Columbia smart infrastructure monitoring system. Can. J. Civ. Eng. 2017, 44, 579–588. [Google Scholar] [CrossRef]
- Pilz, M.; Parolai, S. Norcia Basin (Italy) Temporary Seismic Network. 2009. Available online: https://geofon.gfz-potsdam.de/doi/network/3H/2009 (accessed on 6 December 2023).
- Bindi, D.; Luzi, L.; Parolai, S.; Di Giacomo, D.; Monachesi, G. Site effects observed in alluvial basins: The case of Norcia (Central Italy). Bull. Earthq. Eng. 2011, 9, 1941–1959. [Google Scholar] [CrossRef]
- Pilz, M.; Bindi, D.; Boxberger, T.; Hakimov, F.; Moldobekov, B.; Murodkulov, S.; Orunbaev, S.; Pittore, M.; Stankiewicz, J.; Ullah, S.; et al. First steps toward a reassessment of the seismic risk of the city of Dushanbe (Tajikistan). Seismol. Res. Lett. 2013, 84, 1026–1038. [Google Scholar] [CrossRef]
- Laurendeau, A.; Courboulex, F.; Bonilla, L.F.; Alvarado, A.; Naya, V.A.; Guéguen, P.; Mercerat, E.D.; Singaucho, J.C.; Bertrand, E.; Perrault, M.; et al. Low-frequency seismic amplification in the Quito basin (Ecuador) revealed by accelerometric recordings of the RENAC network. Bull. Seismol. Soc. Am. 2017, 107, 2917–2926. [Google Scholar] [CrossRef]
- Wu, Y.M.; Chen, D.Y.; Lin, T.L.; Hsieh, C.Y.; Chin, T.L.; Chang, W.Y.; Li, W.S.; Ker, S.H. A high-density seismic network for earthquake early warning in Taiwan based on low cost sensors. Seismol. Res. Lett. 2013, 84, 1048–1054. [Google Scholar] [CrossRef]
- Wu, Y.M. Progress on development of an earthquake early warning system using low-cost sensors. Pure Appl. Geophys. 2015, 172, 2343–2351. [Google Scholar] [CrossRef]
- Wu, Y.M.; Mittal, H.; Chen, D.Y.; Hsu, T.Y.; Lin, P.Y. Earthquake early warning systems in Taiwan: Current status. J. Geol. Soc. India 2021, 97, 1525–1532. [Google Scholar] [CrossRef]
- Kaiser, A.E.; Benites, R.A.; Chung, A.; Haines, A.J.; Cochran, E.S.; Fry, B. Estimating seismic site response in Christchurch city (New Zealand) from dense low-cost aftershock arrays. In Proceedings of the 4th International IASPEI/IAEE Symposium on the Effects of Surface Geology on Seismic Motion, Los Angeles, CA, USA, 23–26 August 2011. [Google Scholar]
- Lawrence, J.F.; Cochran, E.S.; Chung, A.; Kaiser, A.; Christensen, C.M.; Allen, R.; Baker, J.W.; Fry, B.; Heaton, T.; Kilb, D.; et al. Rapid earthquake characterization using MEMS accelerometers and volunteer hosts following the M 7.2 Darfield, New Zealand, earthquake. Bull. Seismol. Soc. Am. 2014, 104, 184–192. [Google Scholar] [CrossRef]
- Clayton, R.; Heaton, T.; Chandy, M.; Krause, A.; Kohler, M.; Bunn, J.; Guy, R.; Olson, M.; Faulkner, M.; Cheng, M.; et al. Community seismic network. Ann. Geophys. 2011, 54, 738–747. [Google Scholar]
- Clayton, R.W.; Heaton, T.; Kohler, M.; Chandy, M.; Guy, R.; Bunn, J. Community seismic network: A dense array to sense earthquake strong motion. Seismol. Res. Lett. 2015, 86, 1354–1363. [Google Scholar] [CrossRef]
- Núñez-Cornú, F.J.; Sandoval, J.M.; Alarcón, E.; Gómez, A.; Suárez-Plascencia, C.; Núñez, D.; Trejo-Gómez, E.; Mariscal, O.S.; Ortiz, J.G.C.; Zúñiga-Medina, L.M. The Jalisco seismic accelerometric telemetric network (RESAJ). Seismol. Res. Lett. 2018, 89, 363–372. [Google Scholar] [CrossRef]
- Ullah, S.; Pilz, M.; Bindi, D.; Orunbaev, S.; Kamchybekov, Y.; Picozzi, M.; Parolai, S. Comparing site response techniques by means of earthquake data and ambient seismic noise analysis in Karakol (Kyrgyzstan). In Proceedings of the EGU General Assembly Conference Abstracts, Vienna, Austria, 7–12 April 2013. [Google Scholar]
- Peng, C.; Zhu, X.; Yang, J.; Xue, B.; Chen, Y. Development of an integrated onsite earthquake early warning system and test deployment in Zhaotong, China. Comput. Geosci. 2013, 56, 170–177. [Google Scholar] [CrossRef]
- Alkhatibi, E.; Abou Elenean, K. Dubai Smart Seismic Network. In Proceedings of the 10th Gulf Seismic Forum, Muscat, Oman, 19–22 March 2018. [Google Scholar]
- Zhang, H.; Jin, X.; Wei, Y.; Li, J.; Kang, L.; Wang, S.; Huang, L.; Yu, P. An earthquake early warning system in Fujian, China. Bull. Seismol. Soc. Am. 2016, 106, 755–765. [Google Scholar] [CrossRef]
- Karakostas, C.; Papanikolaou, V. A low-cost instrumentation approach for seismic hazard assessment in urban areas. Wit Trans. Inf. Commun. Technol. 2014, 47, 97–107. [Google Scholar]
- Papanikolaou, V.K.; Karakostas, C.Z.; Theodoulidis, N.P. A low-cost instrumentation system for seismic hazard assessment in urban areas. Sensors 2021, 21, 3618. [Google Scholar] [CrossRef] [PubMed]
- Skolnik, D.; Kaya, Y.; Safak, E.; Ciudad-Real, M. Structural health monitoring of unique structures in Abu Dhabi Emirate. In Proceedings of the EWSHM-7th European Workshop on Structural Health Monitoring, Nantes, France, 8–11 July 2014. [Google Scholar]
- Milutinovic, Z.; Garevski, M.; Salic, R.; Megahed, A.; Almulla, H. Abu Dhabi Emirate, UAE, system for seismic risk monitoring and management. In Proceedings of the 2nd European Conference on Earthquake Engineering and Seismology, Istanbul, Turkey, 25–29 August 2014. [Google Scholar]
- Swiss Seismological Service (SED). Project Description Geothermal Energy St. Gallen. Available online: http://www.seismo.ethz.ch/en/earthquakes/monitoring/special-networks/st.gallen-network/ (accessed on 28 August 2023).
- Orunbaev, S.; Pilz, M.; Usupaev, S.; Bindi, D.; Serenkov, A.; Mambetaliev, E.; Verjee, F.; Moldobekov, B.; Parolai, S. Site effect assessment in Naryn (Kyrgyzstan) using earthquake and noise data. In Proceedings of the A Joint Event of the 15th European Conference on Earthquake Engineering and 34th General Assembly of the European Seismological Commission, ESC, Istanbul, Turkey, 24–29 August 2014; Volume 24, p. 531. [Google Scholar]
- Ry, R.V.; Cummins, P.; Widiyantoro, S. Shallow shear-wave velocity beneath Jakarta, Indonesia revealed by body-wave polarization analysis. Geosciences 2019, 9, 386. [Google Scholar] [CrossRef]
- Galea, P.; Agius, M.R.; Bozionelos, G.; D’Amico, S.; Farrugia, D. A first national seismic network for the Maltese islands—The Malta seismic network. Seismol. Res. Lett. 2021, 92, 1817–1831. [Google Scholar] [CrossRef]
- Rovithis, E.; Makra, K.; Kirtas, E.; Manesis, C.; Bliziotis, D.; Konstantinidou, K. Field monitoring of strong ground motion in urban areas: The Kalochori Accelerometric Network (KAN), database and Web-GIS portal. Earthq. Spectra 2018, 34, 471–501. [Google Scholar] [CrossRef]
- Pratt, T.L.; Horton Jr, J.W.; Muñoz, J.; Hough, S.E.; Chapman, M.C.; Olgun, C.G. Amplification of earthquake ground motions in Washington, DC, and implications for hazard assessments in central and eastern North America. Geophys. Res. Lett. 2017, 44, 12–150. [Google Scholar] [CrossRef]
- Layadi, K.; Semmane, F.; Yelles-Chaouche, A. Site-effects investigation in the city of Chlef (formerly El-Asnam), Algeria, using earthquake and ambient vibration data. Bull. Seismol. Soc. Am. 2016, 106, 2185–2196. [Google Scholar] [CrossRef]
- Clayton, R.W.; Kohler, M.; Guy, R.; Bunn, J.; Heaton, T.; Chandy, M. CSN-LAUSD network: A dense accelerometer network in Los Angeles Schools. Seismol. Res. Lett. 2020, 91, 622–630. [Google Scholar] [CrossRef]
- Green, D.N.; Bastow, I.D.; Dashwood, B.; Nippress, S.E. Characterizing broadband seismic noise in Central London. Seismol. Res. Lett. 2017, 88, 113–124. [Google Scholar] [CrossRef]
- McLeod, L.; Brown, L.; Quiros, D.; Gustafson, J.O. Earthquakes in an Aseismic Region: Local Seismic Network Results for Central New York An AVF Investigation; Technical report; Cornell University: Ithaca, NY, USA, 2020. [Google Scholar]
- Boaga, J.; Casarin, F.; De Marchi, G.; Valluzzi, M.R.; Cassiani, G. 2016 central Italy earthquakes recorded by low-cost MEMS-distributed arrays. Seismol. Res. Lett. 2019, 90, 672–682. [Google Scholar] [CrossRef]
- Pacheco, D.; Mercerat, E.; Courboulex, F.; Bonilla, L.; Laurendeau, A.; Alvarado, A. Profiling the Quito basin (Ecuador) using seismic ambient noise. Geophys. J. Int. 2022, 228, 1419–1437. [Google Scholar] [CrossRef]
- Todd, E.K.; Stirling, M.W.; Fry, B.; Salichon, J.; Villamor, P. Characterising microseismicity in a low seismicity region: Applications of short-term broadband seismic arrays in Dunedin, New Zealand. N. Z. J. Geol. Geophys. 2020, 63, 331–341. [Google Scholar] [CrossRef]
- Kim, Y.; Kang, T.S.; Rhie, J. Development and Application of a Real-Time Warning System Based on a MEMS Seismic Network and Response Procedure for the Day of the National College Entrance Examination in South Korea. Seismol. Res. Lett. 2017, 88, 1322–1326. [Google Scholar] [CrossRef]
- Caserta, A.; Doumaz, F.; Costanzo, A.; Gervasi, A.; Thorossian, W.; Falcone, S.; La Piana, C.; Minasi, M.; Buongiorno, M.F. Assessing soil-structure interaction during the 2016 central Italy seismic sequence (Italy): Preliminary results. Ann. Geophys. 2016, 59, Fast Track 5. [Google Scholar] [CrossRef]
- Costanzo, A.; Caserta, A. Seismic response across the Tronto Valley (at Acquasanta Terme, AP, Marche) based on the geophysical monitoring of the 2016 Central Italy seismic sequence. Bull. Eng. Geol. Environ. 2019, 78, 5599–5616. [Google Scholar] [CrossRef]
- Gélis, C.; Cauchie, L.; Cushing, E.; Froment, B.; Franco, S.; Jomard, H.; Moiriat, D.; Provost, L.; Sariguzel, B.; Tebib, H. Estimation of the local seismic amplification on an industrialized site in the French Rhône Valley. Pure Appl. Geophys. 2022, 179, 2119–2145. [Google Scholar] [CrossRef]
- Nof, R.N.; Chung, A.I.; Rademacher, H.; Dengler, L.; Allen, R.M. MEMS Accelerometer Mini-Array (MAMA): A low-cost implementation for earthquake early warning enhancement. Earthq. Spectra 2019, 35, 21–38. [Google Scholar] [CrossRef]
- Massari, A.; Kohler, M.; Clayton, R.; Guy, R.; Heaton, T.; Bunn, J.; Chandy, K.; Demetri, D. Dense building instrumentation application for city-wide structural health monitoring. In Proceedings of the 16th World Conference on Earthquake, 16WCEE 2017, Santiago, Chile, 9–13 January 2017. [Google Scholar]
- Chatzopoulos, G.; Papadopoulos, I.; Vallianatos, F.; Makris, J.P.; Kouli, M. Strong ground motion sensor network for civil protection rapid decision support systems. Sensors 2021, 21, 2833. [Google Scholar] [CrossRef]
- Ma, Q.; Wang, F.; Tao, D.; Xie, Q.; Liu, H.; Jiang, P. Topographic site effects of Xishan Park ridge in Zigong city, Sichuan considering epicentral distance. J. Seismol. 2021, 25, 1537–1555. [Google Scholar] [CrossRef]
- Chen, K.H.; Yeh, T.C.; Chen, Y.; Johnson, C.W.; Lin, C.H.; Lai, Y.C.; Shih, M.H.; Guéguen, P.; Huang, W.G.; Huang, B.S.; et al. Characteristics and impact of environmental shaking in the Taipei metropolitan area. Sci. Rep. 2022, 12, 743. [Google Scholar] [CrossRef]
- Sairam, B.; Singh, A.; Patel, V.; Pancholi, V.; Chopra, S.; Dwivedi, V.; Kumar, M.R. Influence of local site effects in the Ahmedabad mega city on the damage due to past earthquakes in northwestern India. Bull. Seismol. Soc. Am. 2018, 108, 2170–2182. [Google Scholar] [CrossRef]
- Bravo, J.B.; Blanco, J.L.; Alcalde, J.M. The IGN MEMS Accelerographs Record the First Accelerograms in Different Locations in the Lorca City. J. Geol. Resour. Eng. 2019, 7, 71–92. [Google Scholar]
- Aoi, S.; Kimura, T.; Ueno, T.; Senna, S.; Azuma, H. Multi-data integration system to capture detailed strong ground motion in the Tokyo metropolitan area. J. Disaster Res. 2021, 16, 684–699. [Google Scholar] [CrossRef]
- Sinadinovski, C.; Pekevski, L.; Dojcinovski, D.; Cernih, D. Comparative analysis of strong motion (SM) records from the July 2017 Ohrid seismic sequence. J. Seismol. 2018, 22, 1451–1467. [Google Scholar] [CrossRef]
- Kim, K.H.; Seo, W.; Han, J.; Kwon, J.; Kang, S.Y.; Ree, J.H.; Kim, S.; Liu, K. The 2017 ML 5.4 Pohang earthquake sequence, Korea, recorded by a dense seismic network. Tectonophysics 2020, 774, 228306. [Google Scholar] [CrossRef]
- Seo, M.S.; Son, Y.O.; Kim, Y.; Kang, T.S.; Rhie, J.; Kim, K.H.; Ree, J.H. Measurement of seismometer misorientation based on P-wave polarization: Application to dense temporary broadband seismic array in the epicentral region of 2016 Gyeongju earthquake, South Korea. Geosci. J. 2022, 26, 385–397. [Google Scholar] [CrossRef]
- D’Alessandro, A.; Luzio, D.; D’Anna, G. Urban MEMS based seismic network for post-earthquakes rapid disaster assessment. Adv. Geosci. 2014, 40, 1–9. [Google Scholar] [CrossRef]
- D’Alessandro, A.; D’Anna, R.; Greco, L.; Passafiume, G.; Scudero, S.; Speciale, S.; Vitale, G. Monitoring Earthquake through MEMS Sensors (MEMS project) in the town of Acireale (Italy). In Proceedings of the 2018 IEEE International Symposium on Inertial Sensors and Systems (INERTIAL), Lake Como, Italy, 26–29 March 2018; pp. 1–4. [Google Scholar]
- D’Alessandro, A.; Vitale, G.; Scudero, S.; D’Anna, R.; Passafiume, G.; Greco, L.; Speciale, S.; Patanè, D.; Torrisi, O.; Di Prima, S.; et al. Real-time urban seismic network and structural monitoring by means of accelerometric sensors: Application to the historic buildings of Catania (Italy). In Proceedings of the 2018 IEEE International Conference on Environmental Engineering (EE), Milan, Italy, 12–14 March 2018; pp. 1–5. [Google Scholar]
- Scudero, S.; Vitale, G.; Greco, L.; Patanè, D.; D’Alessandro, A. Earthquake Early Warning and Structural Health Monitoring in the historical city centre of Catania (Italy). In Proceedings of the SER4SC “Seismic and Energy Renovation for Sustainable Cities” International Conference, Catania, Italy, 1–3 February 2018; pp. 389–395, ISBN 978-88-96386-56-9. [Google Scholar]
- Patanè, D.; Tusa, G.; Yang, W.; Astuti, A.; Colino, A.; Costanza, A.; D’Anna, G.; Di Prima, S.; Fertitta, G.; Mangiagli, S.; et al. The Urban Seismic Observatory of Catania (Italy): A Real-Time Seismic Monitoring at Urban Scale. Remote Sens. 2022, 14, 2583. [Google Scholar] [CrossRef]
- D’Alessandro, A.; Vitale, G.; Scudero, S. MEMS-based system for structural health monitoring and earthquake observation in Sicily. In European Workshop on Structural Health Monitoring: Special Collection of 2020 Papers-Volume 1; Springer: Berlin/Heidelberg, Germany, 2021; pp. 89–95. [Google Scholar]
- Gkogkas, K.; Lin, F.C.; Allam, A.A.; Wang, Y. Shallow damage zone structure of the Wasatch fault in Salt Lake City from ambient-noise double beamforming with a temporary linear array. Seismol. Soc. Am. 2021, 92, 2453–2463. [Google Scholar] [CrossRef]
- Hillers, G.T.; Vuorinen, T.A.; Uski, M.R.; Kortström, J.T.; Mäntyniemi, P.B.; Tiira, T.; Malin, P.E.; Saarno, T. The 2018 geothermal reservoir stimulation in Espoo/Helsinki, southern Finland: Seismic network anatomy and data features. Seismol. Res. Lett. 2020, 91, 770–786. [Google Scholar] [CrossRef]
- Lythgoe, K.; Loasby, A.; Hidayat, D.; Wei, S. Seismic event detection in urban Singapore using a nodal array and frequency domain array detector: Earthquakes, blasts and thunderquakes. Geophys. J. Int. 2021, 226, 1542–1557. [Google Scholar] [CrossRef]
- Diaz, J.; Ruiz, M.; Jara, J.A. Seismic monitoring of urban activity in Barcelona during the COVID-19 lockdown. Solid Earth 2021, 12, 725–739. [Google Scholar] [CrossRef]
- Janusz, P.; Perron, V.; Imperatori, W.; Bonilla, F.; Fäh, D. Evaluation of Seismic Site Response in Urban Areas: Insight from the case of Lucerne, Switzerland. In Proceedings of the 6th International Symposium on the Effects of Surface Geology on Seismic Motion (ESG6 2021), Online, 30 August 2021. [Google Scholar]
- Rintamäki, A.E.; Hillers, G.; Vuorinen, T.A.; Luhta, T.; Pownall, J.M.; Tsarsitalidou, C.; Galvin, K.; Keskinen, J.; Kortström, J.T.; Lin, T.C.; et al. A seismic network to monitor the 2020 EGS stimulation in the Espoo/Helsinki area, southern Finland. Seismol. Soc. Am. 2022, 93, 1046–1062. [Google Scholar] [CrossRef]
- Özcebe, A.G.; Tiganescu, A.; Ozer, E.; Negulescu, C.; Galiana-Merino, J.J.; Tubaldi, E.; Toma-Danila, D.; Molina, S.; Kharazian, A.; Bozzoni, F.; et al. Raspberry Shake-based rapid structural identification of existing buildings subject to earthquake ground motion: The case study of Bucharest. Sensors 2022, 22, 4787. [Google Scholar] [CrossRef] [PubMed]
- Swiss Seismological Service (SED). Temporary Deployments in Sion, Switzerland to Understand 3D Site Amplification; Swiss Seismological Service (SED): Zürich, Switzerland, 2004. [Google Scholar] [CrossRef]
- Costanzo, A.; Falcone, S.; D’Alessandro, A.; Vitale, G.; Giovinazzi, S.; Morici, M.; Dall’Asta, A.; Buongiorno, M.F. A technological system for post-earthquake damage scenarios based on the monitoring by means of an urban seismic network. Sensors 2021, 21, 7887. [Google Scholar] [CrossRef] [PubMed]
- Vitale, G.; D’Alessandro, A.; Di Benedetto, A.; Figlioli, A.; Costanzo, A.; Speciale, S.; Piattoni, Q.; Cipriani, L. Urban Seismic Network Based on MEMS Sensors: The Experience of the Seismic Observatory in Camerino (Marche, Italy). Sensors 2022, 22, 4335. [Google Scholar] [CrossRef] [PubMed]
- Myklebust, E.; Köhler, A.; Dichiarante, A.M. Towards an Automatic Real-Time Seismic Monitoring System for the City of Oslo; Technical Report; Copernicus Meetings. 2022. Available online: https://ui.adsabs.harvard.edu/abs/2022EGUGA..24.3601M/abstract (accessed on 6 December 2023).
- Bindi, D.; Boxberger, T.; Orunbaev, S.; Pilz, M.; Stankiewicz, J.; Pittore, M.; Iervolino, I.; Ellguth, E.; Parolai, S. On-site early-warning system for Bishkek (Kyrgyzstan). Ann. Geophys. 2015, 58, S0112. [Google Scholar] [CrossRef]
- Diaz, J.; Schimmel, M.; Ruiz, M.; Carbonell, R. Seismometers within cities: A tool to connect earth sciences and society. Front. Earth Sci. 2020, 8, 9. [Google Scholar] [CrossRef]
- Chandrakumar, C.; Rahubadde Kankanamge, R.; Stephens, M.; Tan, M. Earthquake early warning systems based on low-cost ground motion sensors: A systematic literature review. Front. Sens. 2022, 3, 1020202. [Google Scholar] [CrossRef]
- Satriano, C.; Wu, Y.M.; Zollo, A.; Kanamori, H. Earthquake early warning: Concepts, methods and physical grounds. Soil Dyn. Earthq. Eng. 2011, 31, 106–118. [Google Scholar] [CrossRef]
- Cremen, G.; Galasso, C. Earthquake early warning: Recent advances and perspectives. Earth-Sci. Rev. 2020, 205, 103184. [Google Scholar] [CrossRef]
- D’Alessandro, A.; Scudero, S.; Vitale, G.; Di Benedetto, A.; Bosco, G.L. Optimization of low-cost monitoring systems for on-site earthquake early-warning of critical infrastructures. In Proceedings of the Computational Science and Its Applications–ICCSA 2020: 20th International Conference, Cagliari, Italy, 1–4 July 2020; Proceedings, Part II 20; Springer: Berlin/Heidelberg, Germany, 2020; pp. 963–975. [Google Scholar]
- Erdik, M.; Şeşetyan, K.; Demircioğlu, M.; Hancılar, U.; Zülfikar, C. Rapid earthquake loss assessment after damaging earthquakes. Soil Dyn. Earthq. Eng. 2011, 31, 247–266. [Google Scholar] [CrossRef]
- Guérin-Marthe, S.; Gehl, P.; Negulescu, C.; Auclair, S.; Fayjaloun, R. Rapid earthquake response: The state-of-the art and recommendations with a focus on European systems. Int. J. Disaster Risk Reduct. 2021, 52, 101958. [Google Scholar] [CrossRef]
- Wald, D.J.; Quitoriano, V.; Heaton, T.H.; Kanamori, H.; Scrivner, C.W.; Worden, C.B. TriNet “ShakeMaps”: Rapid generation of peak ground motion and intensity maps for earthquakes in southern California. Earthq. Spectra 1999, 15, 537–555. [Google Scholar] [CrossRef]
- Michelini, A.; Faenza, L.; Lauciani, V.; Malagnini, L. ShakeMap implementation in Italy. Seismol. Res. Lett. 2008, 79, 688–697. [Google Scholar] [CrossRef]
- Pitilakis, K. Site effects. In Recent Advances in Earthquake Geotechnical Engineering and Microzonation; Springer: Berlin/Heidelberg, Germany, 2004; pp. 139–197. [Google Scholar]
- Bonnefoy-Claudet, S.; Cornou, C.; Bard, P.Y.; Cotton, F.; Moczo, P.; Kristek, J.; Fäh, D. H/V ratio: A tool for site effects evaluation. Results from 1-D noise simulations. Geophys. J. Int. 2006, 167, 827–837. [Google Scholar] [CrossRef]
- Strollo, A.; Parolai, S.; Jäckel, K.H.; Marzorati, S.; Bindi, D. Suitability of short-period sensors for retrieving reliable H/V peaks for frequencies less than 1 Hz. Bull. Seismol. Soc. Am. 2008, 98, 671–681. [Google Scholar] [CrossRef]
- Bonnefoy-Claudet, S.; Cotton, F.; Bard, P.Y. The nature of noise wavefield and its applications for site effects studies—A literature review. Earth Sci. Rev. 2006, 79, 205–227. [Google Scholar] [CrossRef]
- Foti, S.; Lai, C.G.; Rix, G.J.; Strobbia, C. Surface Wave Methods for Near-Surface Site Characterization; CRC Press: Boca Raton, FL, USA, 2014. [Google Scholar]
- Allen, R.M.; Stogaitis, M. Global growth of earthquake early warning. Science 2022, 375, 717–718. [Google Scholar] [CrossRef]
- Holland, A. Earthquake data recorded by the MEMS accelerometer: Field testing in Idaho. Seismol. Res. Lett. 2003, 74, 20–26. [Google Scholar] [CrossRef]
- D’Alessandro, A.; D’Anna, G. Suitability of low-cost three-axis MEMS accelerometers in strong-motion seismology: Tests on the LIS331DLH (iPhone) accelerometer. Bull. Seismol. Soc. Am. 2013, 103, 2906–2913. [Google Scholar] [CrossRef]
- Evans, J.; Allen, R.M.; Chung, A.; Cochran, E.; Guy, R.; Hellweg, M.; Lawrence, J. Performance of several low-cost accelerometers. Seismol. Res. Lett. 2014, 85, 147–158. [Google Scholar] [CrossRef]
- Kong, Q.; Allen, R.M.; Schreier, L.; Kwon, Y.W. MyShake: A smartphone seismic network for earthquake early warning and beyond. Sci. Adv. 2016, 2, e1501055. [Google Scholar] [CrossRef] [PubMed]
- D’Alessandro, A.; Vitale, G.; Scudero, S.; D’Anna, R.; Costanza, A.; Fagiolini, A.; Greco, L. Characterization of MEMS accelerometer self-noise by means of PSD and Allan Variance analysis. In Proceedings of the 2017 7th IEEE International Workshop on Advances in Sensors and Interfaces (IWASI), Vieste, Italy, 15–16 June 2017; pp. 159–164. [Google Scholar]
- Liu, H.F.; Luo, Z.C.; Hu, Z.K.; Yang, S.Q.; Tu, L.C.; Zhou, Z.B.; Kraft, M. A review of high-performance MEMS sensors for resource exploration and geophysical applications. Pet. Sci. 2022, 19, 2631–2648. [Google Scholar] [CrossRef]
- Scudero, S.; D’Alessandro, A.; Greco, L.; Vitale, G. MEMS technology in seismology: A short review. In Proceedings of the 2018 IEEE International Conference on Environmental Engineering (EE), Milan, Italy, 12–14 March 2018; pp. 1–5. [Google Scholar]
- D’Alessandro, A.; Scudero, S.; Vitale, G. A review of the capacitive MEMS for seismology. Sens. 2019, 19, 3093. [Google Scholar] [CrossRef] [PubMed]
- Hou, Y.; Jiao, R.; Yu, H. MEMS based geophones and seismometers. Sens. Actuators A Phys. 2021, 318, 112498. [Google Scholar] [CrossRef]
- Havskov, J.; Alguacil, G. Instrumentation in Earthquake Seismology, 2nd ed.; Springer: Cham, Switzerland, 2016; Volume XVI, p. 413. [Google Scholar]
- Keil, S.; Wassermann, J.; Megies, T.; Kraft, T. Optimal Network Design for Microseismic Monitoring in Urban Areas-A Case Study in Munich, Germany. Seismica 2023, 2. [Google Scholar] [CrossRef]
- Siino, M.; Scudero, S.; Greco, L.; D’Alessandro, A. Spatial analysis for an evaluation of monitoring networks: Examples from the Italian seismic and accelerometric networks. J. Seismol. 2020, 24, 1045–1061. [Google Scholar] [CrossRef]
- Scudero, S.; Marcocci, C.; D’Alessandro, A. Insights on the Italian Seismic Network from location uncertainties. J. Seismol. 2021, 25, 1061–1076. [Google Scholar] [CrossRef]
- Bilham, R. The seismic future of cities. Bull. Earthq. Eng. 2009, 7, 839–887. [Google Scholar] [CrossRef]
- Cremen, G.; Galasso, C.; McCloskey, J. Modelling and quantifying tomorrow’s risks from natural hazards. Sci. Total. Environ. 2022, 817, 152552. [Google Scholar] [CrossRef] [PubMed]
- Biondi, B.; Martin, E.; Cole, S.; Karrenbach, M.; Lindsey, N. Earthquakes analysis using data recorded by the Stanford DAS array. In Proceedings of the SEG International Exposition and Annual Meeting. SEG, Houston, TX, USA, 17 August 2017; p. SEG–2017. [Google Scholar]
- Martins, H.F.; Fernández-Ruiz, M.R.; Costa, L.; Williams, E.; Zhan, Z.; Martin-Lopez, S.; Gonzalez-Herraez, M. Monitoring of remote seismic events in metropolitan area fibers using distributed acoustic sensing (DAS) and spatiotemporal signal processing. In Proceedings of the Optical Fiber Communication Conference, San Diego, CA, USA, 3–7 March 2019; p. M2J-1. [Google Scholar]
- Fang, G.; Li, Y.E.; Zhao, Y.; Martin, E.R. Urban near-surface seismic monitoring using distributed acoustic sensing. Geophys. Res. Lett. 2020, 47, e2019GL086115. [Google Scholar] [CrossRef]
- Lindsey, N.J.; Yuan, S.; Lellouch, A.; Gualtieri, L.; Lecocq, T.; Biondi, B. City-scale dark fiber DAS measurements of infrastructure use during the COVID-19 pandemic. Geophys. Res. Lett. 2020, 47, e2020GL089931. [Google Scholar] [CrossRef] [PubMed]
- Zhan, Z. Distributed acoustic sensing turns fiber-optic cables into sensitive seismic antennas. Seismol. Res. Lett. 2020, 91, 1–15. [Google Scholar] [CrossRef]
- Spica, Z.J.; Perton, M.; Martin, E.R.; Beroza, G.C.; Biondi, B. Urban seismic site characterization by fiber-optic seismology. J. Geophys. Res. Solid Earth 2020, 125, e2019JB018656. [Google Scholar] [CrossRef]
- Song, Z.; Zeng, X.; Xie, J.; Bao, F.; Zhang, G. Sensing shallow structure and traffic noise with fiber-optic internet cables in an urban area. Surv. Geophys. 2021, 42, 1401–1423. [Google Scholar] [CrossRef] [PubMed]
- Zhu, T.; Shen, J.; Martin, E.R. Sensing Earth and environment dynamics by telecommunication fiber-optic sensors: An urban experiment in Pennsylvania, USA. Solid Earth 2021, 12, 219–235. [Google Scholar] [CrossRef]
- Zeng, X.; Bao, F.; Thurber, C.H.; Lin, R.; Wang, S.; Song, Z.; Han, L. Turning a telecom fiber-optic cable into an ultradense seismic array for rapid postearthquake response in an urban area. Seismol. Res. Lett. 2022, 93, 853–865. [Google Scholar] [CrossRef]
- Jousset, P.; Reinsch, T.; Ryberg, T.; Blanck, H.; Clarke, A.; Aghayev, R.; Hersir, G.P.; Henninges, J.; Weber, M.; Krawczyk, C.M. Dynamic strain determination using fibre-optic cables allows imaging of seismological and structural features. Nat. Commun. 2018, 9, 2509. [Google Scholar] [CrossRef]
- Ristvej, J.; Lacinák, M.; Ondrejka, R. On smart city and safe city concepts. Mob. Netw. Appl. 2020, 25, 836–845. [Google Scholar] [CrossRef]
Figure 1.
(a) Global distribution of the USNs collected in this review. Detailed maps are provided for North America (b) and Europe (c), where USNs are the most common.
Figure 1.
(a) Global distribution of the USNs collected in this review. Detailed maps are provided for North America (b) and Europe (c), where USNs are the most common.

Figure 3.
Temporal trends of the main objective adopted by USNs (c.f. Table 1) and frequency of occurrence of all the objectives.
Figure 3.
Temporal trends of the main objective adopted by USNs (c.f. Table 1) and frequency of occurrence of all the objectives.


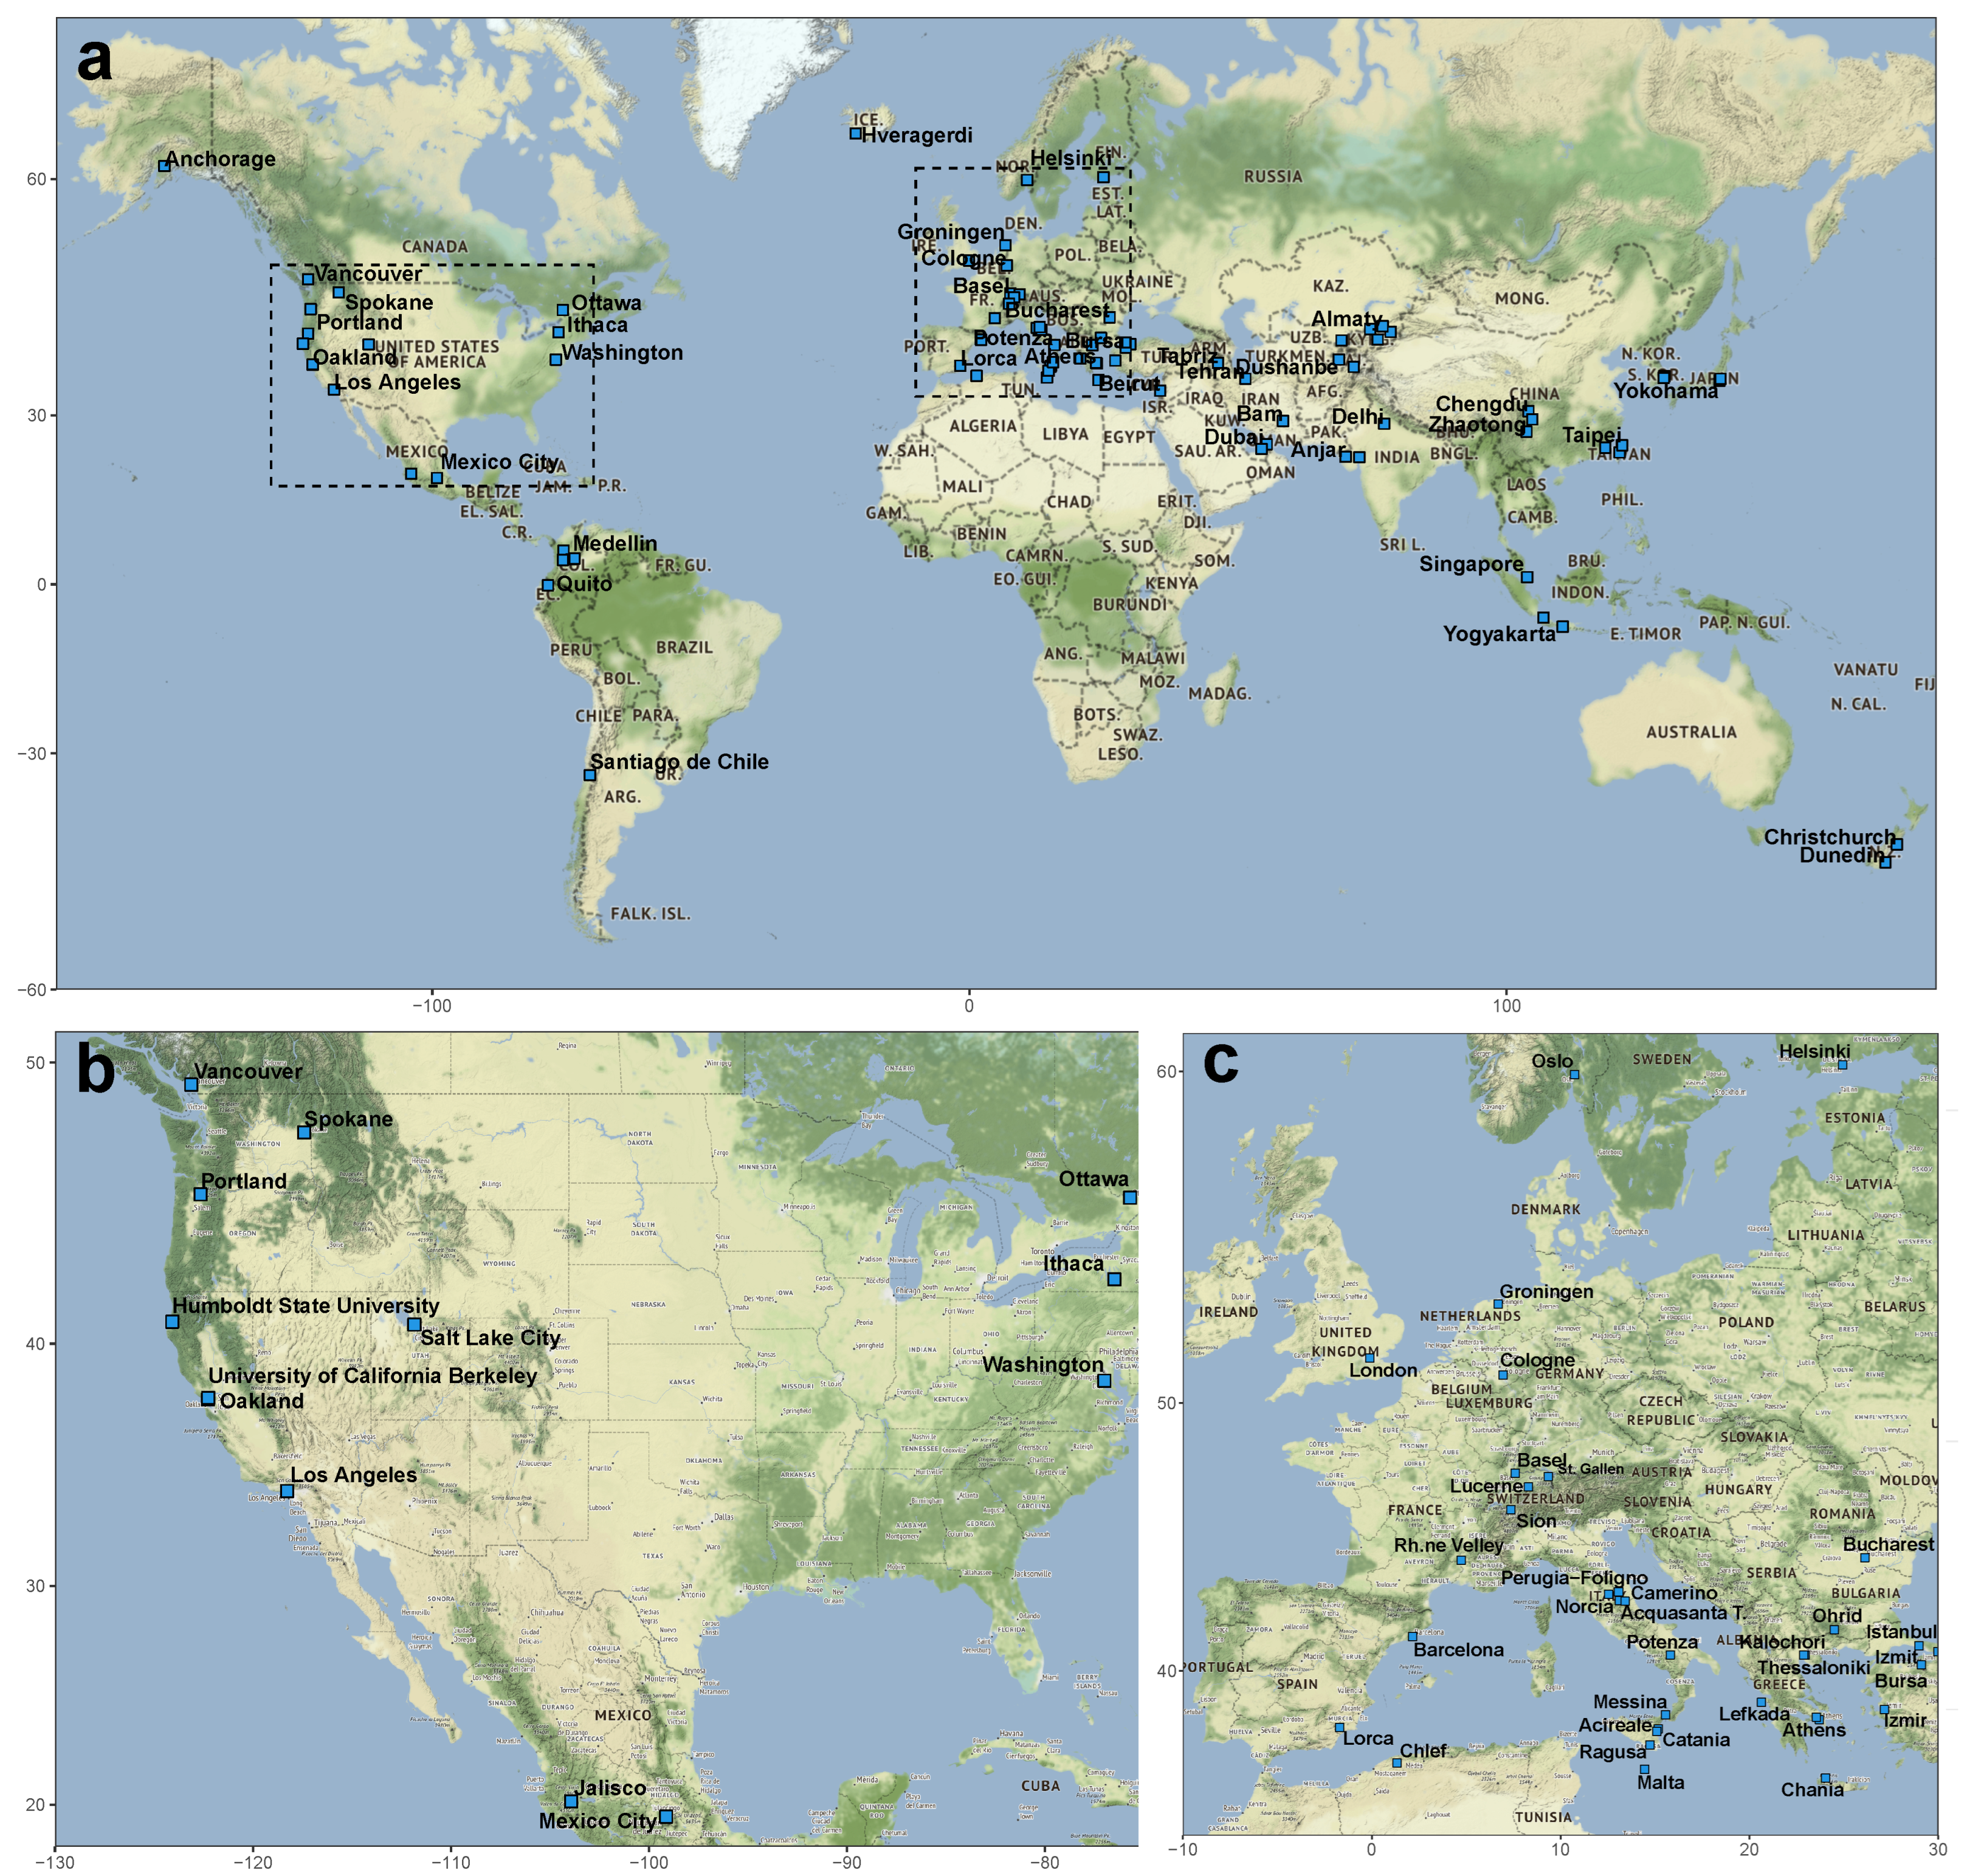
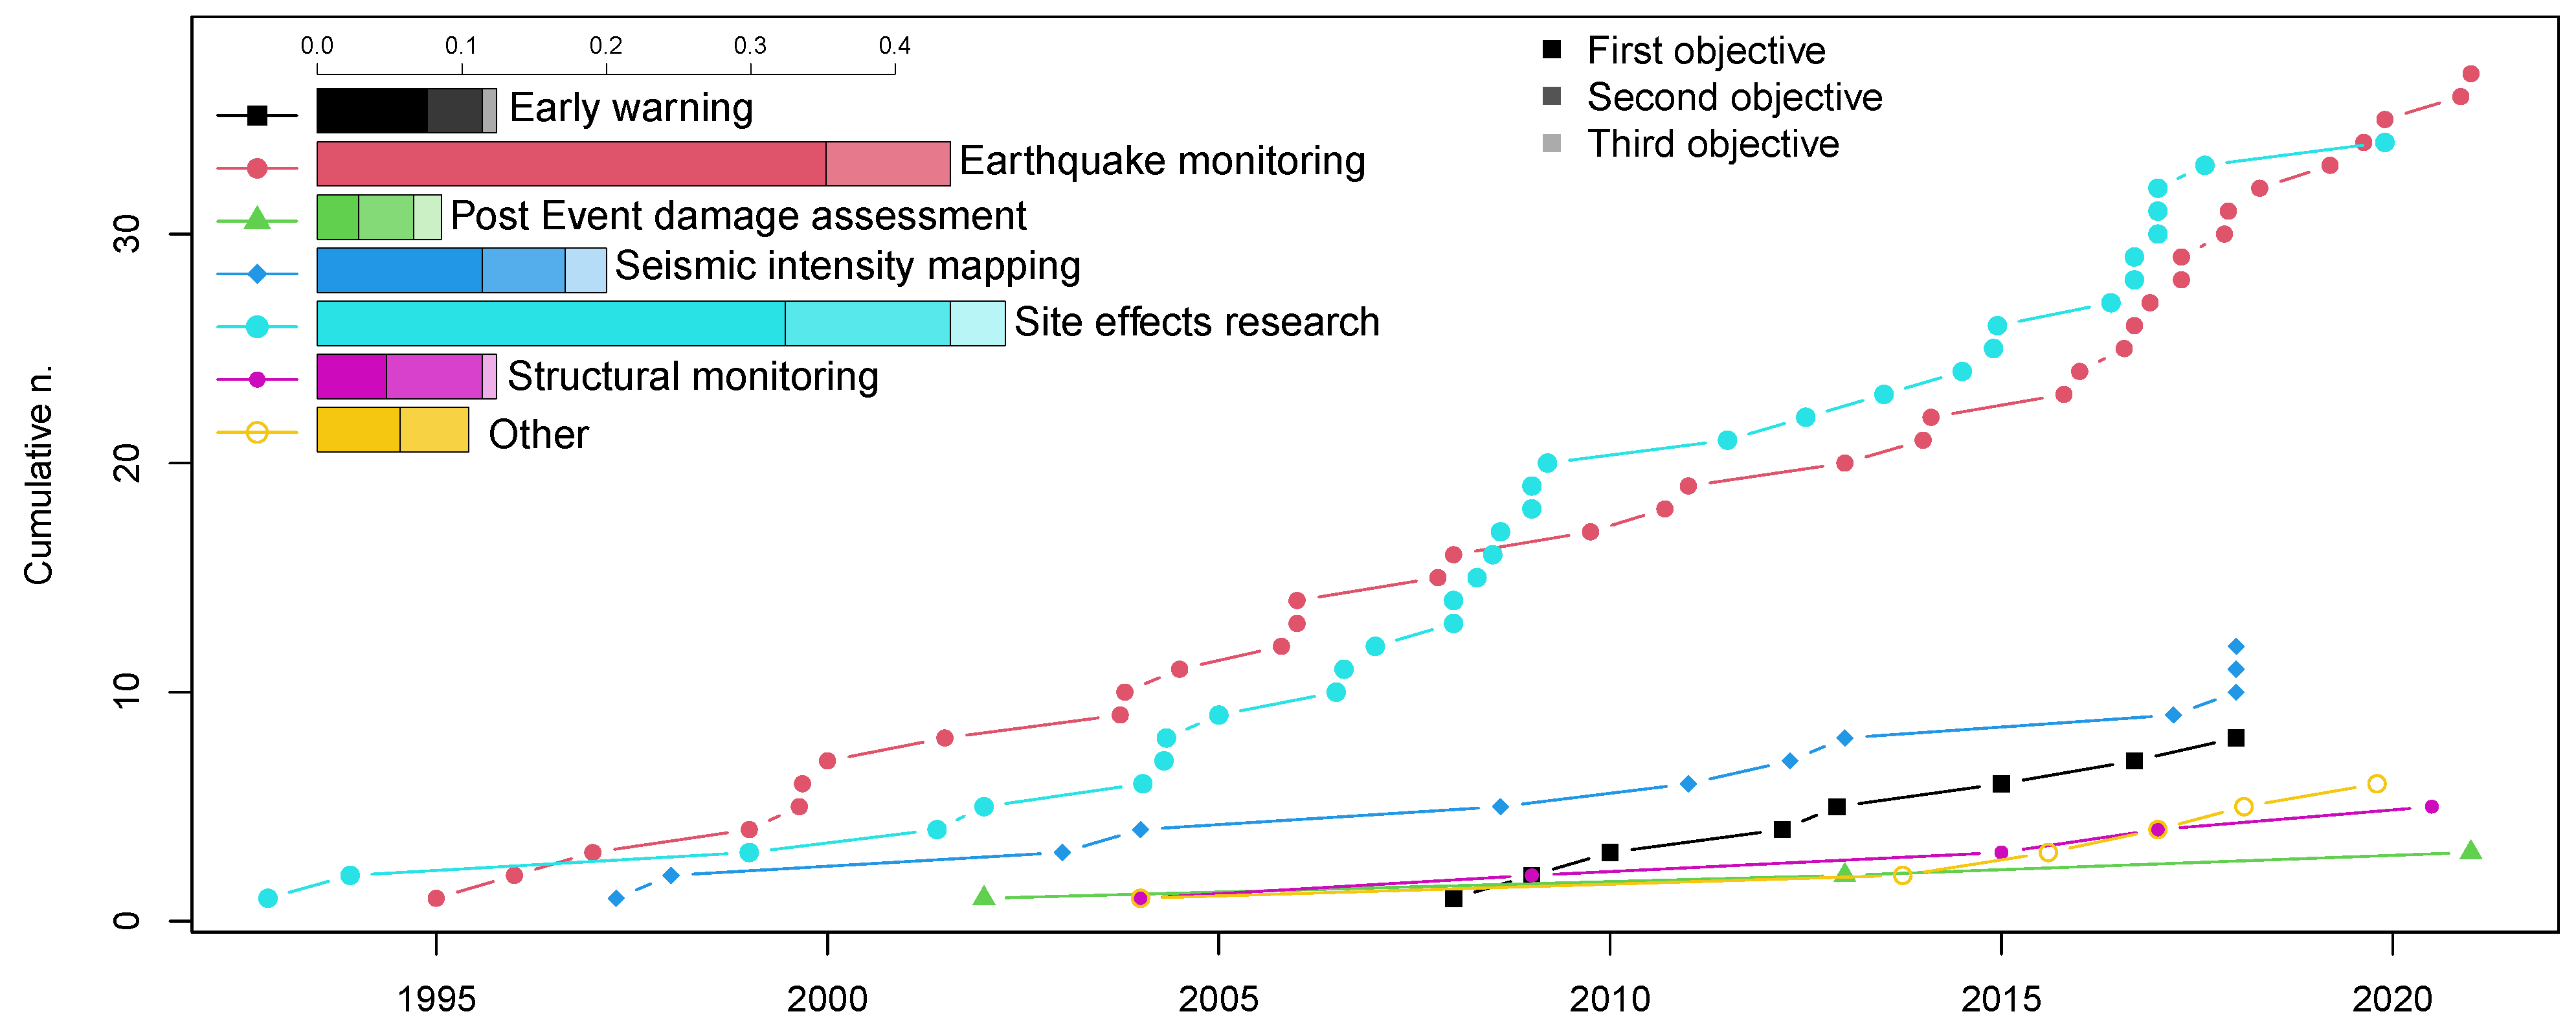
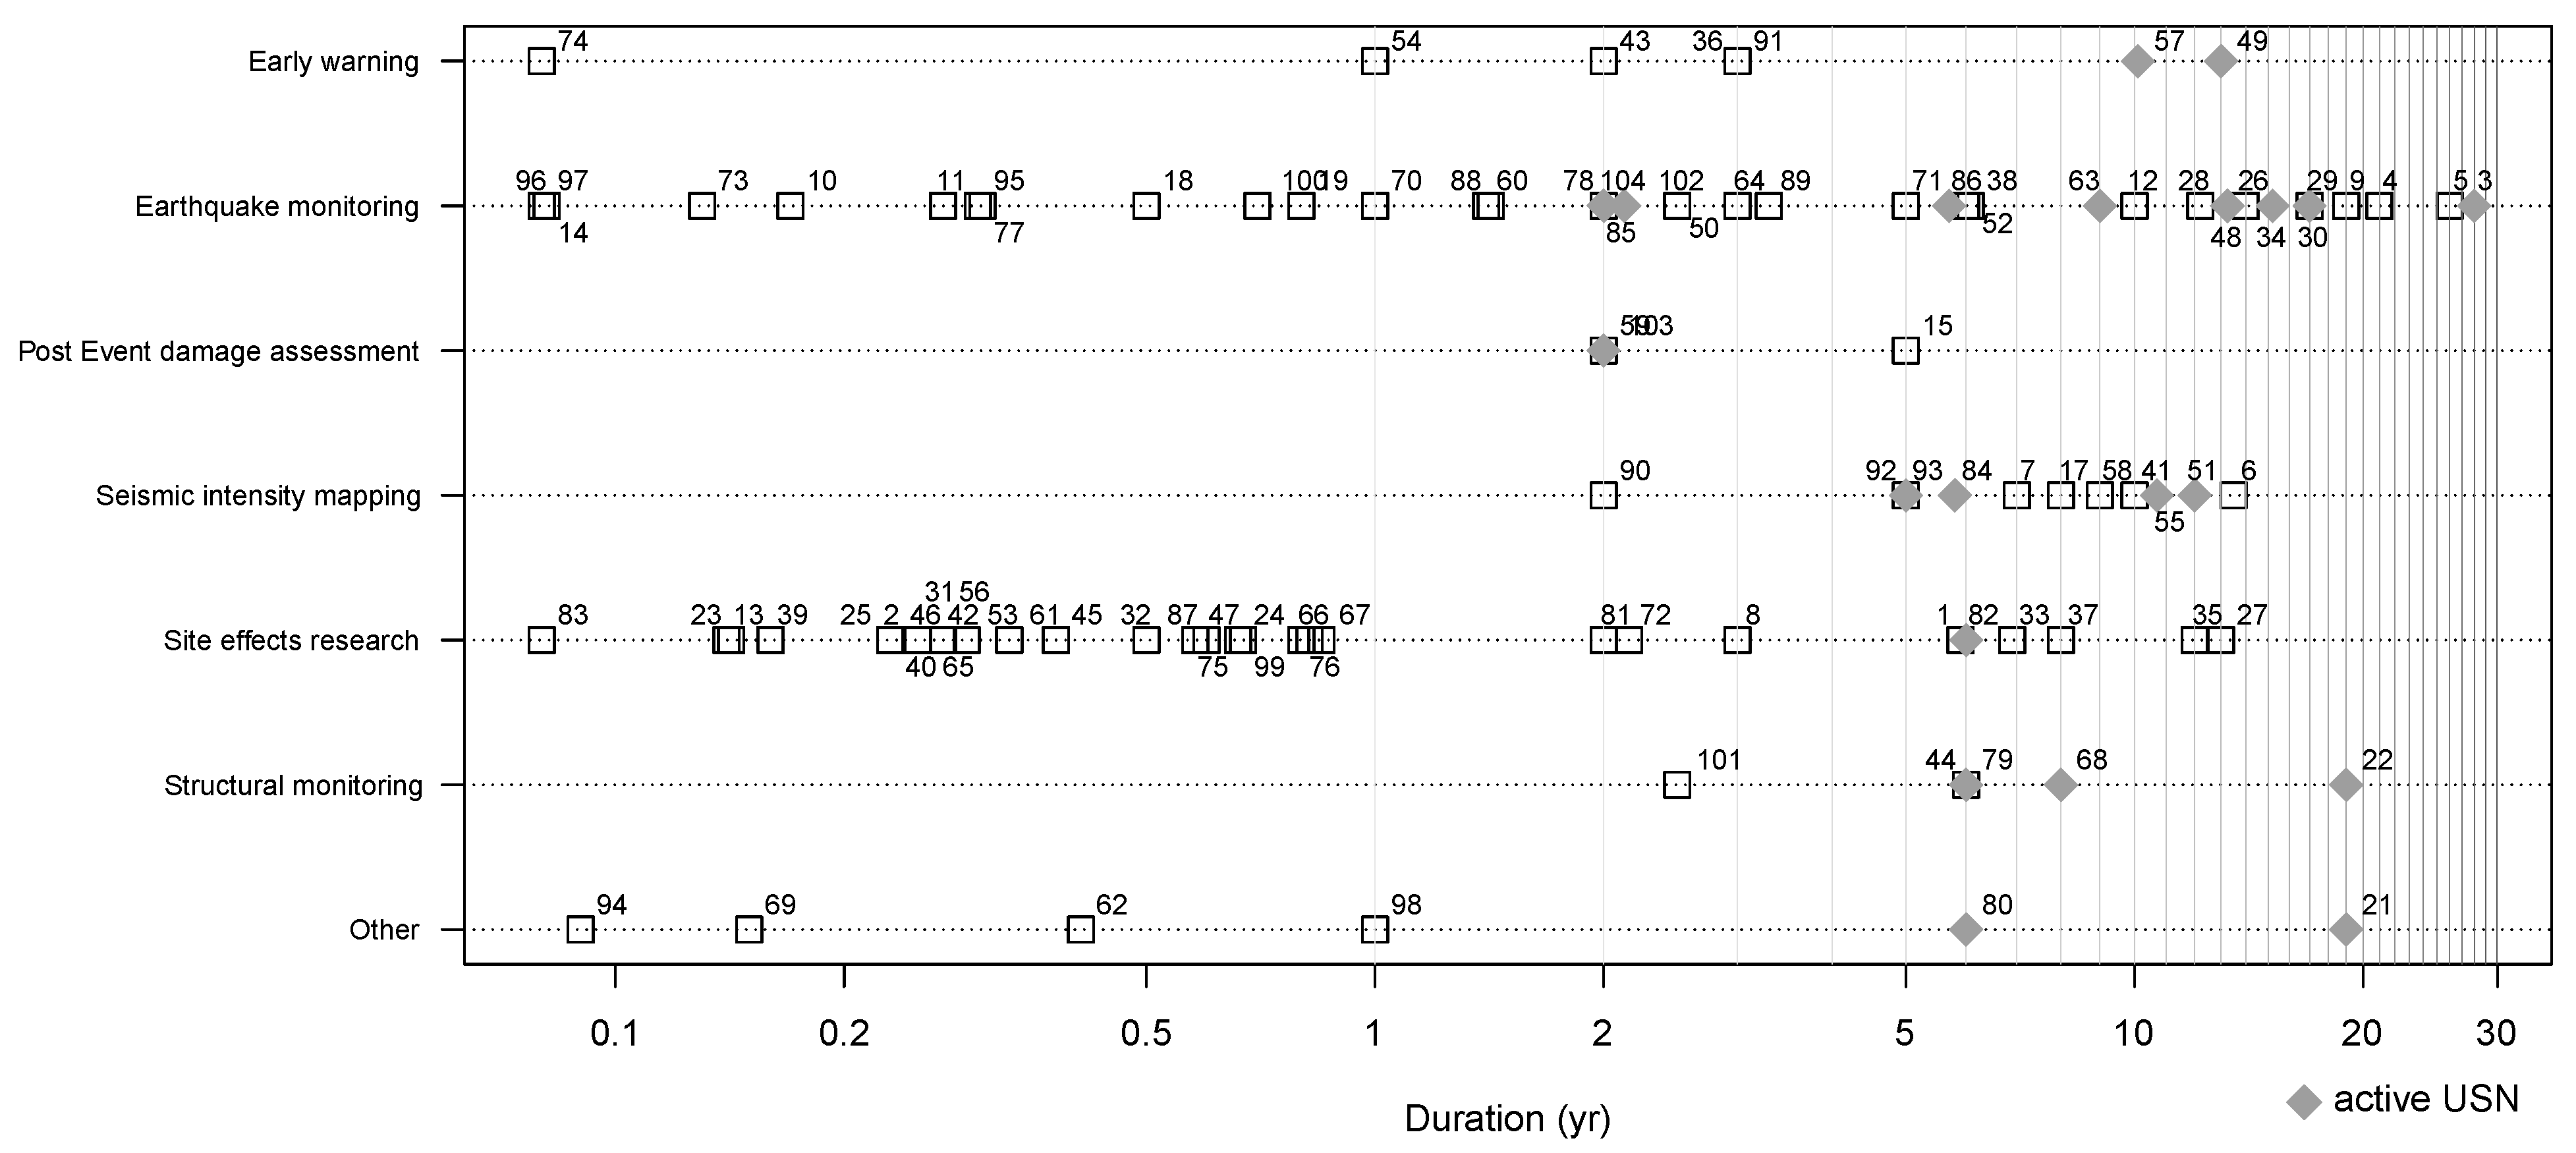
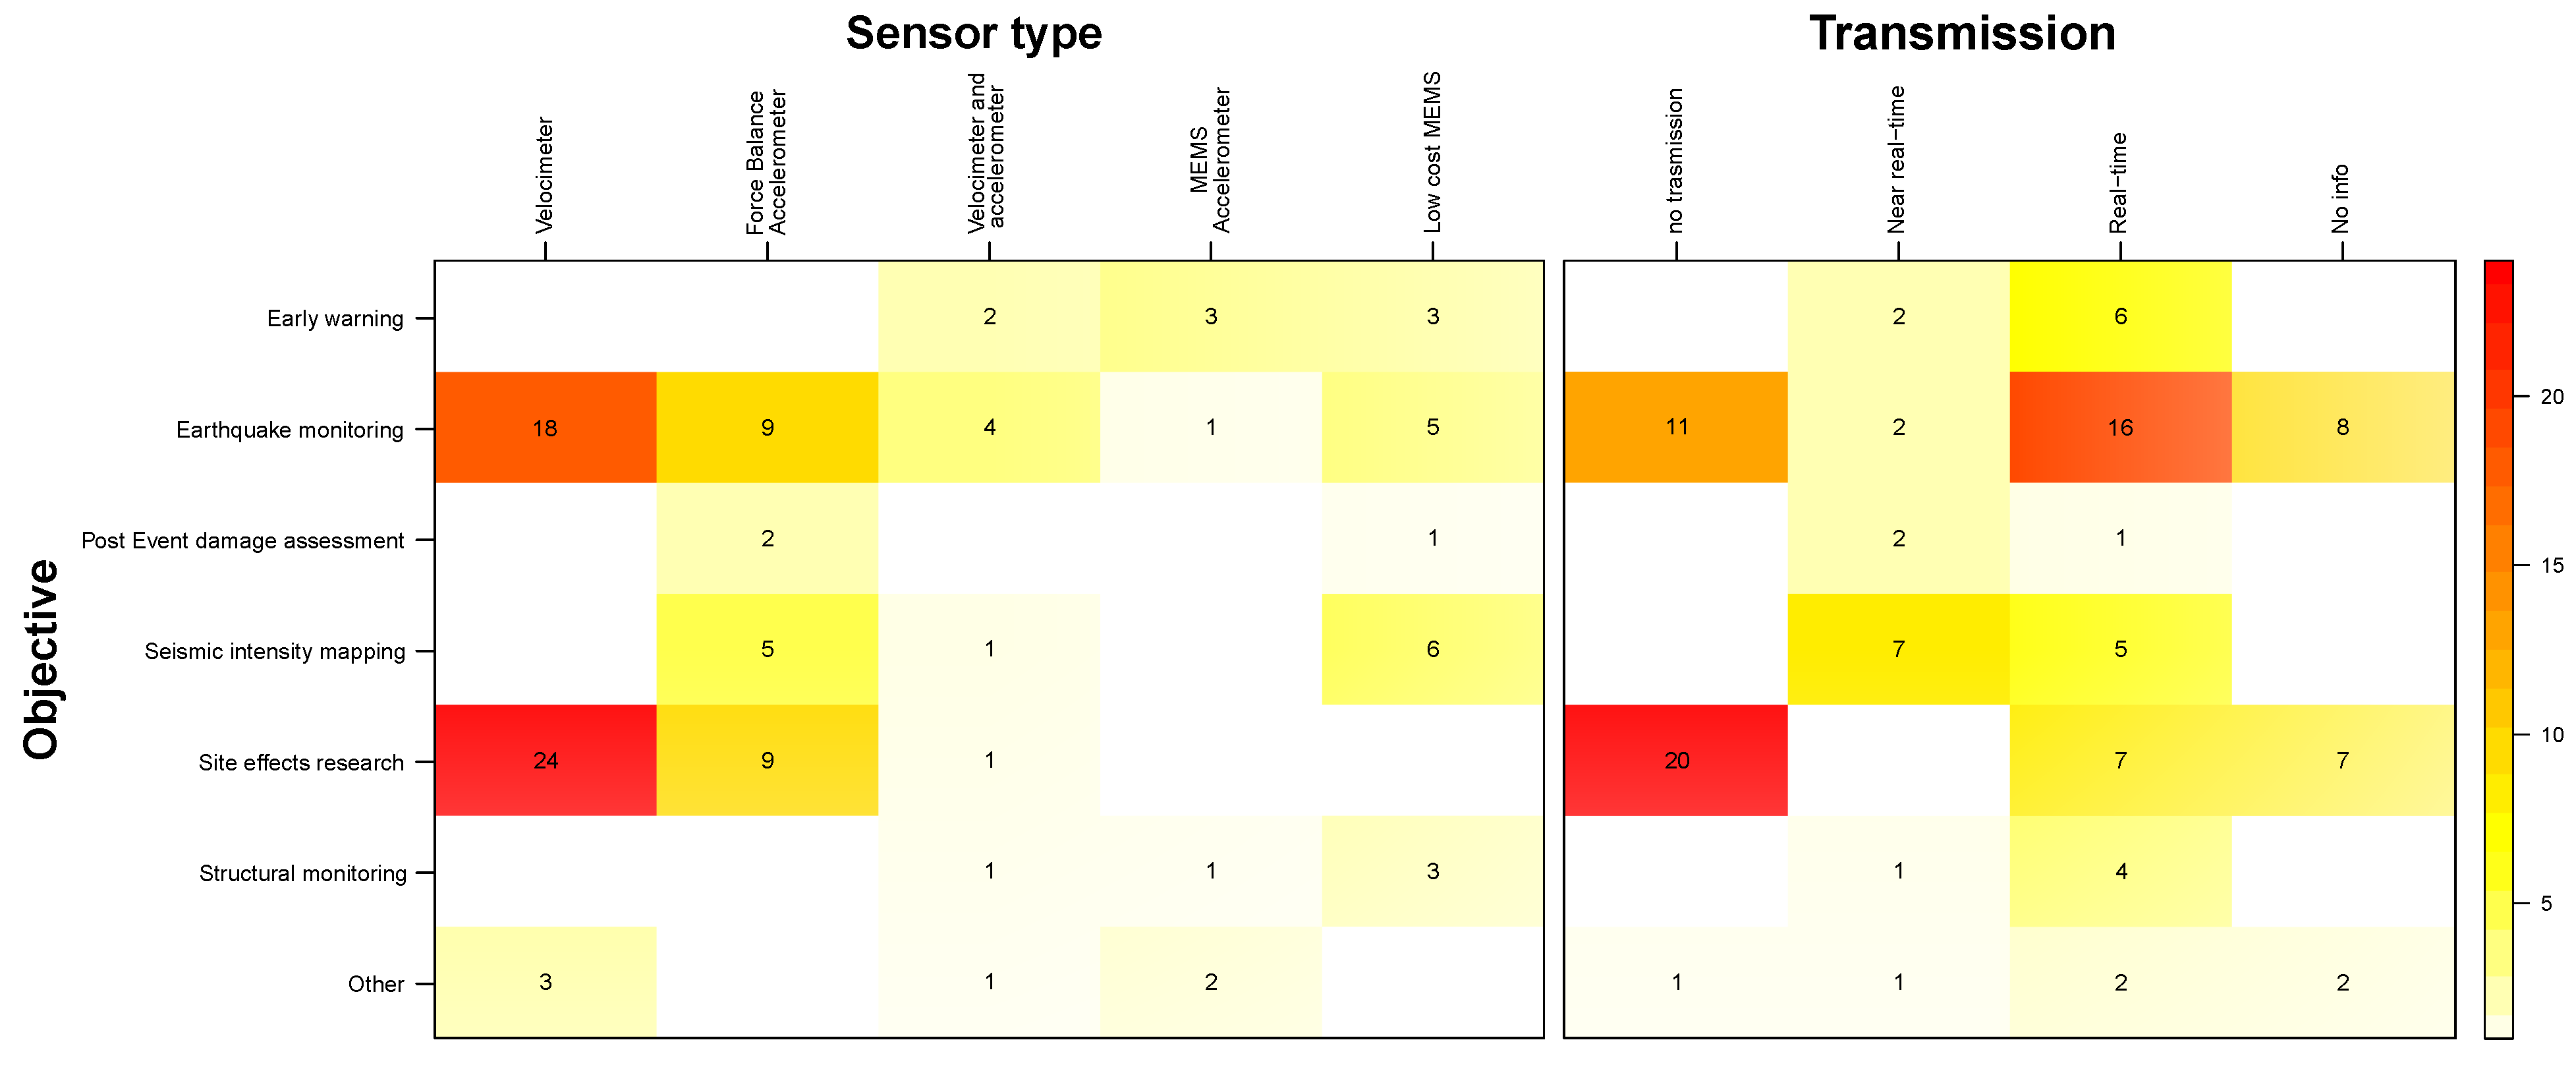
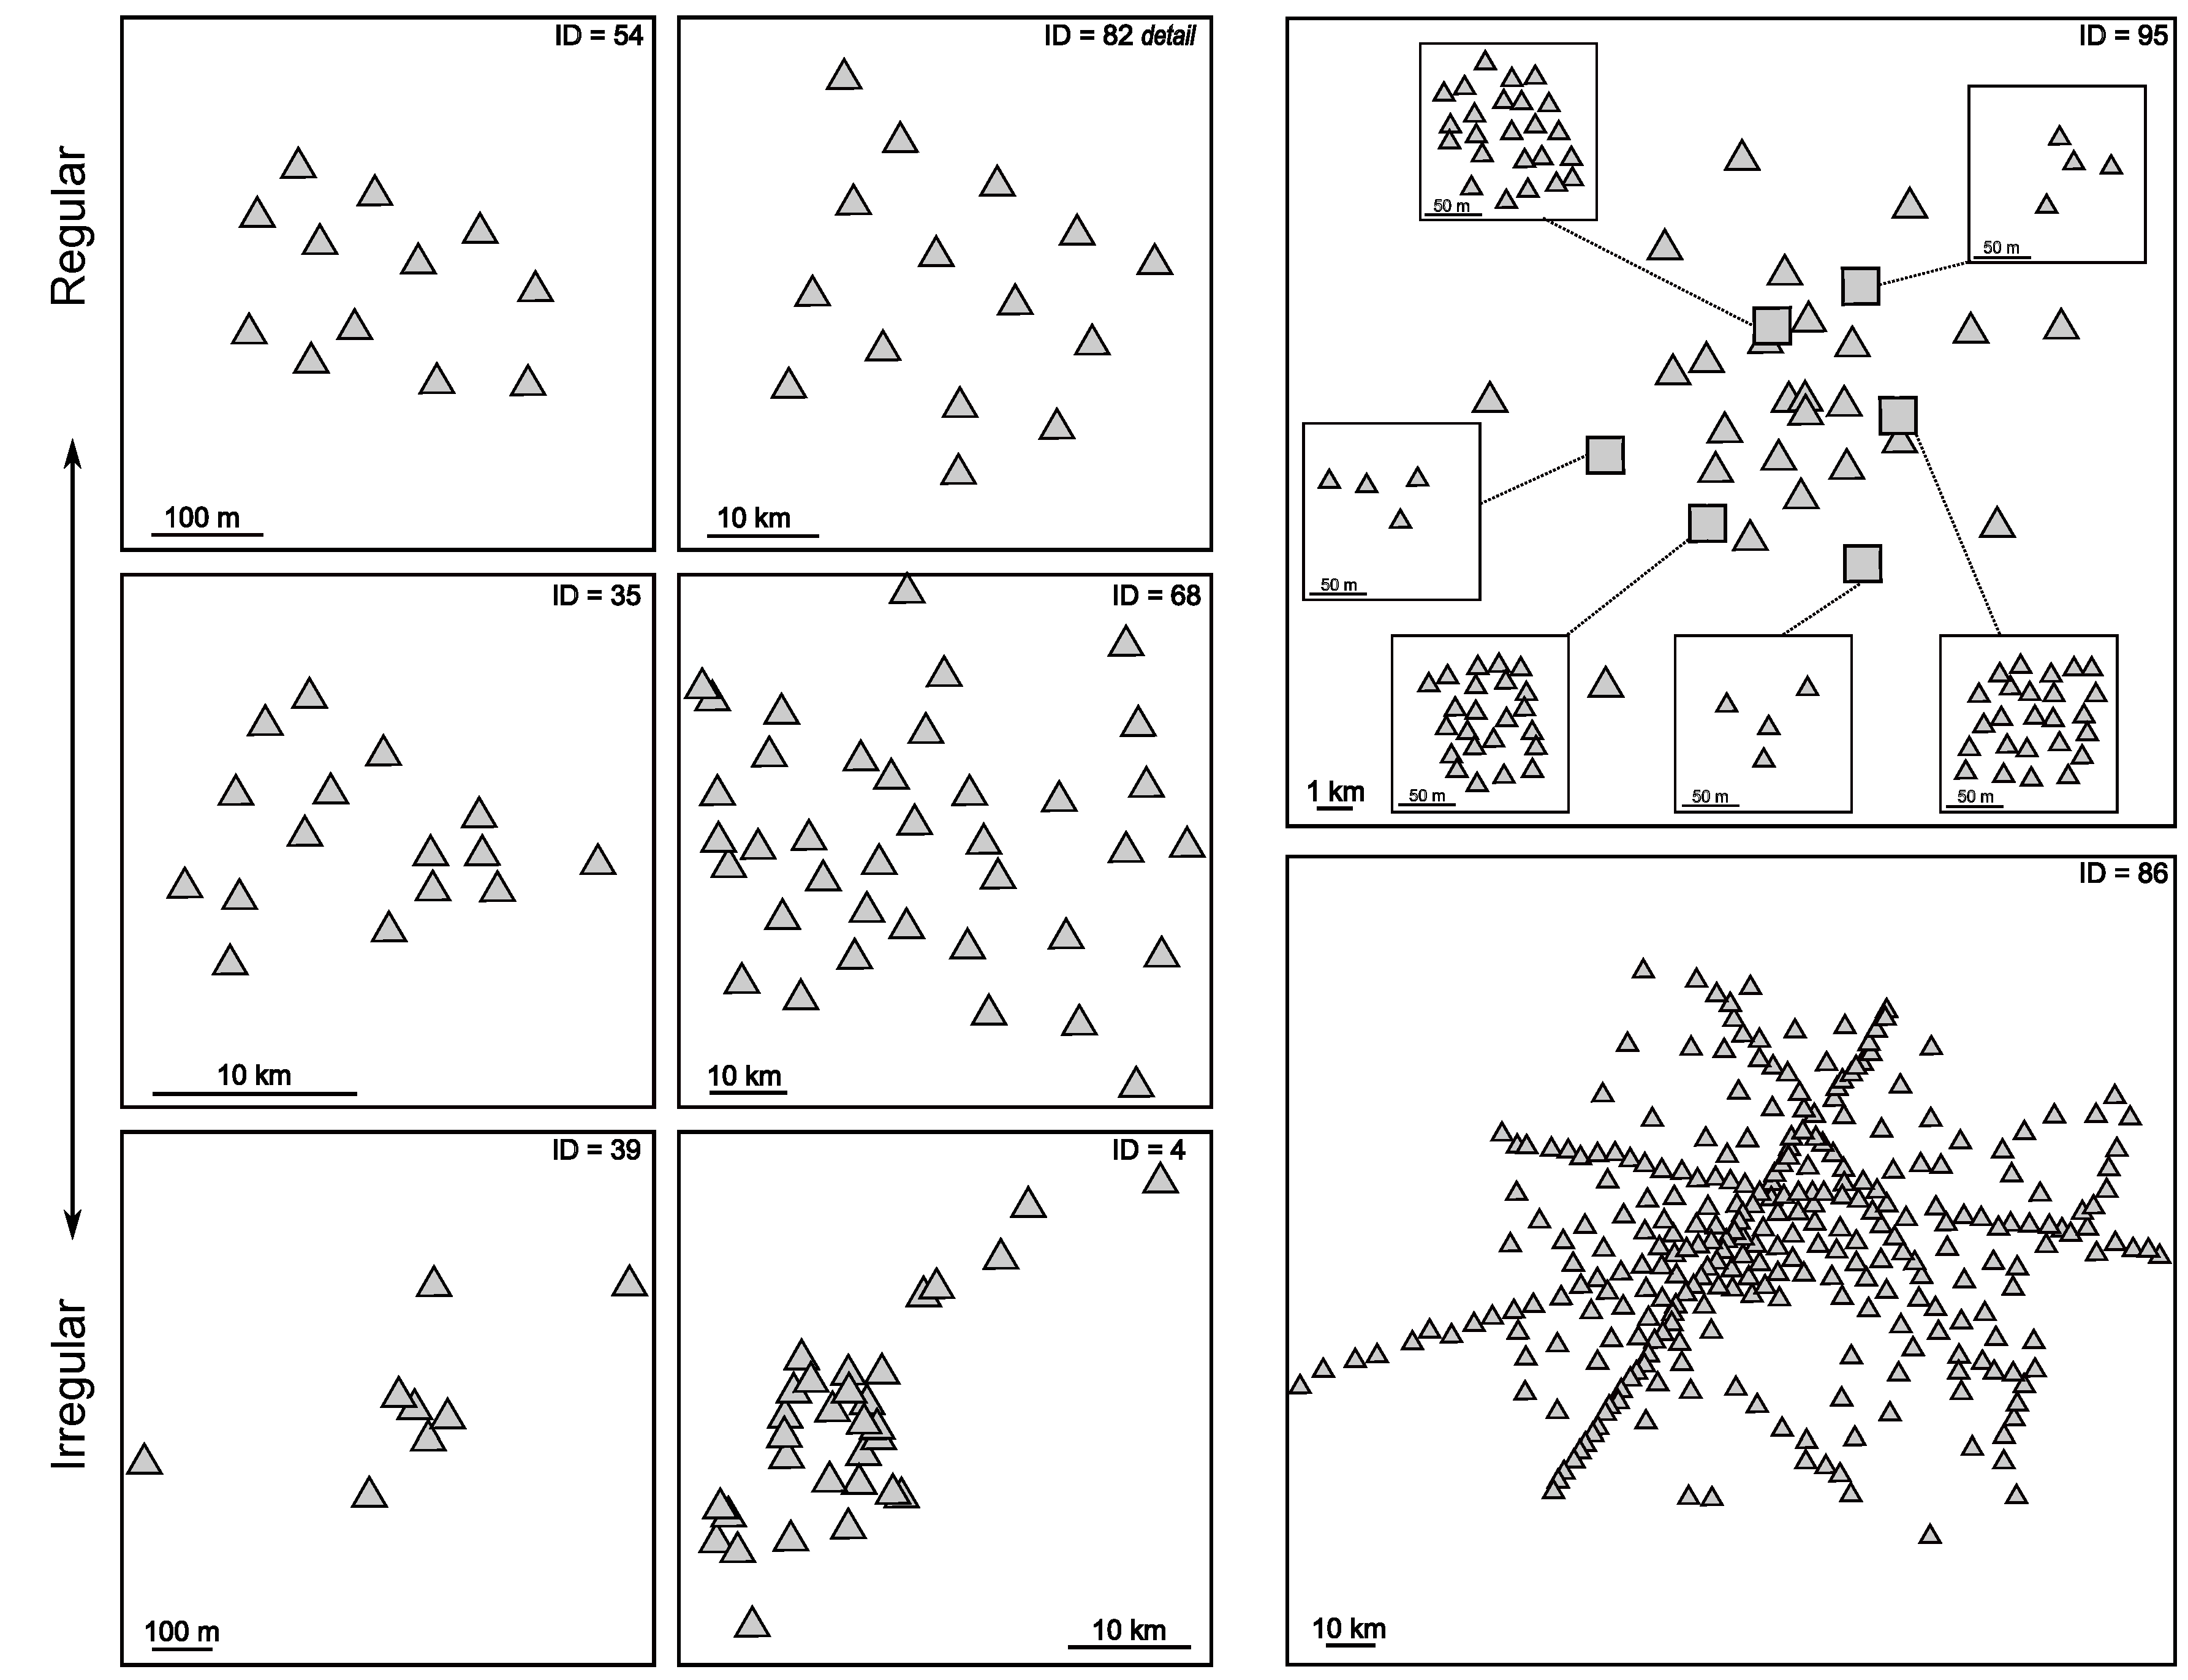
Disclaimer/Publisher’s Note: The statements, opinions and data contained in all publications are solely those of the individual author(s) and contributor(s) and not of MDPI and/or the editor(s). MDPI and/or the editor(s) disclaim responsibility for any injury to people or property resulting from any ideas, methods, instructions or products referred to in the content. |
© 2023 by the authors. Licensee MDPI, Basel, Switzerland. This article is an open access article distributed under the terms and conditions of the Creative Commons Attribution (CC BY) license (https://creativecommons.org/licenses/by/4.0/).
Share and Cite
MDPI and ACS Style
Scudero, S.; Costanzo, A.; D’Alessandro, A. Urban Seismic Networks: A Worldwide Review. Appl. Sci. 2023, 13, 13165. https://doi.org/10.3390/app132413165
AMA Style
Scudero S, Costanzo A, D’Alessandro A. Urban Seismic Networks: A Worldwide Review. Applied Sciences. 2023; 13(24):13165. https://doi.org/10.3390/app132413165
Chicago/Turabian StyleScudero, Salvatore, Antonio Costanzo, and Antonino D’Alessandro. 2023. "Urban Seismic Networks: A Worldwide Review" Applied Sciences 13, no. 24: 13165. https://doi.org/10.3390/app132413165
Note that from the first issue of 2016, this journal uses article numbers instead of page numbers. See further details here.