
Electromagnetic Fields Radiated by Electrostatic Discharges: A Review of the Available Approaches

Department of Electrical and Electronics Engineering Educators, ASPETE—School of Pedagogical and Technological Education, 14121 N. Heraklion, Greece
Electronics 2023, 12(12), 2577; https://doi.org/10.3390/electronics12122577
Submission received: 7 May 2023
/
Revised: 4 June 2023
/
Accepted: 5 June 2023
/
Published: 7 June 2023
(This article belongs to the Special Issue Advancements in Electromagnetic Compatibility (EMC) Techniques for Electronic Systems)
Abstract
:Electrostatic discharge (ESD) is a physical phenomenon that may destroy electronic components due to its high discharge current that may reach a few amperes in just a few ns. However, another major aspect of ESD is the related high-frequency electromagnetic (E/M) fields radiated by the ESD event. The electronic equipment that is affected by the ESD phenomenon is additionally affected by the induced voltages caused by these E/M fields. This is the reason that the current version of the IEC 61000-4-2 on ESD has a special reference to these fields and the measurement setup. Starting with the classical formulation of these fields, this paper reviews the most popular techniques for calculating the ESD electromagnetic fields while also emphasizing the best methods for minimizing computational effort. There is also a separate section for the measurement techniques that have been applied in research works, whose outcomes could be implemented in the next revision of the IEC 61000-4-2. It is extremely important for the next revision to include these measurement setups and the E/M field sensors because the ESD generators should comply with certain values related to the E/M fields they produce.
1. Introduction
The sudden transfer (discharge) of static electric charge between objects at various electrostatic potentials is referred to as electrostatic discharge (ESD). ESD is a member of the electrical overstress (EOS) category of issues [1]. Electromagnetic pulses (EMPs) and lightning are further EOS family members. Electronic components (transistors, diodes, and microcircuits) are seriously at risk from ESD, and this fact impacts on how well those components function in the systems in which they are used. For instance, the human body is capable of accumulating static charges up to 25 kV. These accumulations can quickly discharge into an object or an electronic gadget that is electrically grounded. Most electronic companies now classify all semiconductor devices as ESD sensitive due to the damage ESD may cause. ESD is a significant threat in the microelectronic and electronic sector. Magnetic recording heads, sensors, and disk drives made of electronic parts all raise ESD issues [2].
ESD is divided into two stages. The term “electrostatic” describes the locally accumulating static electric field and comparatively slow development of a differential voltage. Discharge refers to the quick transfer of the resulting built-up charge brought on by the failure of the intermediate insulator, usually atmospheric air. The fundamental ESD phases are as follows [3]: (1) radio frequency (RF) fields generated by corona discharges (2) pre-discharge effects, (3) discharge current, (4) electric field radiated by the discharge, and (5) magnetic field also radiated by the discharge. Each may have an impact on sensitive electronic equipment. The related currents and electromagnetic (E/M) fields that follow discharges, however, pose the biggest concern.
Direct or indirect contact through the E/M radiation or the formation of a secondary discharge within the piece of equipment are all possible ways for the ESD event to be conveyed to the system [4,5]. The ESD vulnerability in today’s electronic products has increased due to smaller manufacturing geometries and relatively less chip protection [4,6,7].
The system may continue to operate without any issues following an ESD incident, or strained systems may undergo soft failure and resume normal operation after rebooting with or without human action [6,8]. The system may potentially sustain a hard failure because of heat effects, dielectric breakdown, or a combination of the two [9,10,11,12]. The charged body creates a strong electric field that quickly collapses in the ESD environment, which can cause noise to affect the system [9,11,12,13]. The discharged current also causes a dramatic increase in the magnetic field. These electric and magnetic fields’ rate of variation introduces noise into the system. The density of the ESD current determines how serious the ESD threat is to the equipment under test (EUT) [9,11,12,14].
The IEC 61000-4-2 standard [15] describes the parameters of the ESD simulator for the representation of a specific scenario involving a charged human body with a metallic object, discharging on the EUT. This standard refers to the equation of the discharge current waveform during contact discharges as it has been defined after the implementation of genetic algorithms [16,17]. Due to the mismatch between the described circuit and the ESD current as described in the current standard, there have been publications on a new ESD circuit design [18,19].
The transient EM fields produced by the ESD generator during the discharge procedure are also important factors in the induced ESD coupling on the EUT [4,9,10,13,20,21,22]. Experimental methods [23,24,25], full wave numerical modeling [26,27,28,29,30,31], circuit modeling [5,32,33,34,35,36], and hybrid simulations of the EUT and ESD source [25,30] can all be used to carry out the ESD coupling study. However, it appears that modeling full wave has some constraints in computation resources and modeling accuracy based on the state of the art [12].
Annex D of the current IEC 61000-4-2 focuses on the E/M fields emitted by human metal discharge and ESD generators. While the measurement techniques described in Annex D are recommended, they are not required. Regarding the measurement of the E/M field radiated by ESD, it could be said that it is quite a challenge given that these discharges are very fast transient phenomena, with a total duration of a few hundred ns [37,38,39]. So far, the exact sensors that will be used to measure the E/M field have not been determined. From the measurements of the E/M field, listed previously for different arrangements, when the coaxial adapter was on an insulating material [39] or in the center of a metal surface [37,38] it was concluded that both the values and the waveforms of the generated fields differ depending on the experimental devices and the sensors used.
In addition, there are differences in the same generator depending on its orientation, since the electric and magnetic fields differ, in relation to the direction in which the measurement is taken. This fact affects each EUT differently depending on the position of the generator in relation to the EUT since the induced voltages are different in each case. This is a reason during ESD generator verification that the estimation of the E/M field has been studied in the past [40,41,42] and should be considered in the standard’s [15] next revision.
The current work begins by describing the ESD phenomenon and the definition of the IEC standard [15] for the ESD current (Section 2). Then, in Section 3, the state-of-the-art ESD E/M field computation, starting with the dipole model of the ESD radiated fields and continuing to all the approaches that reduce the computational effort, are presented. In Section 4, there is an analysis of the measurement setups and the field sensors that researchers have used for measuring the E/M field radiated by ESD discharges. In Section 5, a comparison of the experimental results for the measurement setups of Section 4 is made. Finally, in Section 6 (Discussion), there are revision suggestions for the current IEC standard [15].
2. Effects before the Electrostatic Discharge
Either inductively or triboelectrically, objects build up energy. Relative surface motion is a mechanical mechanism used in triboelectric charging to transfer energy. Parameters such as the type of contact, air humidity, smoothness of the surface, contact pressure, and the rate of relative motion affect the amount of the transferred charge [43]. A crucial stage in the prevention of ESD is taking precautions to avoid excessive charging. These include humidity management, anti-static carpets, and anti-static materials.
The capacitance of a person has a significant impact on the voltage up to which they can be charged. Cylinders and spheres can be used to simulate the capacitance of humans. [44]. For a charged person, common voltages are 8–10 kV [45], coming up to 30 kV in some cases. Voltages less than 3 kV generally do not cause electric arcs that can be felt by humans. Numerous potentially upsetting ESD events therefore go unnoticed.
An ungrounded item is subjected to an electrostatic field, which results in induction charging [43]. This frequently occurs when devices are being transported and packaged. A significant static load on a plastic box or container can be generated by handling, conveyor belts, and other friction sources. Consequently, the electrostatic field can affect solid-state logic via charge drainage and dielectric burn. [46].
A gas, like air, is a very good insulator under normal conditions. Since electrons are firmly bound, transferring electricity is challenging. Atoms can travel freely but are restricted by collisions. The kind of atmosphere, pressure, and temperature all affect how fast and frequently particles collide. Although they are typically in very small quantities and will move randomly, positive ions and free electrons may be present. The flow of charged particles is biased when an electrostatic field is applied. Now, positive ions will try to move toward the cathode while electrons will try to move toward the anode. With a mass ratio of 1:1800, electrons are lighter than positive ions and have lower collision cross sections. High-field levels may cause a channel of low impedance inside the gas, which would speed up the transmission of charges. The complicated process, also known as the electrical breakdown of gas, has been a significant field of study for more than a century.
The discharge current is affected by various factors, such as the charging voltage, the approach rate leading to the discharge, the geometry of the electrode, the characteristics of the conductive channel, and the RLC characteristics of the discharge victim. It is challenging to create a straightforward, all-encompassing model of an ESD event due to the broad range that these factors can span. To make ESD testing more repeatable and useful, however, the IEC [15] created standardized current shapes, targets, and test setups.
Figure 1 depicts the human body model (HBM) pulse that an ESD generator must produce in accordance with IEC 61000-4-2 [15]. The charging voltage of the ESD generator determines the discharge current’s amplitude, which has a rise time (tr) of 0.8 ns (±25%). The rise time (tr), peak discharge current (Ip), current at 30 ns (I30), and current at 60 ns (I60) are the four variables of the ESD current. These two current values, I30 and I60, are determined for periods of 30 ns and 60 ns, respectively, beginning when the current equals 10% of the peak current, as shown in Figure 1.
3. ESD Radiated Fields Approach Using the Dipole Model
The fields caused by ESD currents can couple to vulnerable internal circuits or directly enter equipment through openings such as apertures, seams, vents, and others. Therefore, at frequencies where issues are anticipated, the designer tries to reduce this coupling. Inefficient receivers must also be ineffective heaters, according to the law of reciprocity. Circuits that are voltage-sensitive and have high resistance tend to be excited by electric fields. Therefore, unwanted coupling can be reduced by keeping the receiving antenna’s impedance at low levels. There are usually trade-offs, but this might improve magnetic field collection. Boxleitner [5] provides a thorough explanation of the arrangement of circuit boards to reduce line–antenna issues.
Wilson and Ma [47] have modeled the E/M field of the ESD event utilizing the dipole in Figure 2, which is of length dl and is positioned above a perfect ground. A cylinder-shaped coordinate system (p, φ, z) is placed in the center of the dipole, and its mirror image at z = z′ is applied. Figure 2 shows the dipole as being above earth, but actual ESD incidents take place very near the victim conductor. Therefore, the dipole is permitted to touch the earth, or z′ = 0. R is the distance variable from the observation point to the source.
3.1. Electric Field
The electric field is derived from Equation (1):
where:
where c is the speed of light, l is the total length of the current path, and and are the unit vectors in the direction of p and z, respectively. i is the time variant current waveform evaluated at t − R/c. If the current is known, the electric field can be examined using this equation at the ground plane, which represents direct penetration into vulnerable EUT. The size of E is mainly determined by two variables. Geometrical variables come first, followed by the current form and its derivative. For instance, in the near field (small distance), E should perform as follows if geometry is the dominant factor:
Equations (4) and (5) indicate that the current waveform directly controls the near electric field. The part of the discharge that occurs on the hand and forearm is the most dangerous for the EUT, and it is also sensitive to peaks of the electric field. The discharge of the human body or current tail will be the main cause of the victim’s distress if the exposure was prolonged.
In the far field, Equations (2) and (3) are rewritten as follows:
According to Equations (6) and (7), the current’s time derivative shape makes the highest contribution in the far field. Low-voltage sparks with rapid rising times and, consequently, with high time derivatives of the current may be the most destructive. The main sources for the far ESD field to neighboring sensitive equipment are longer interference paths, such as indirect radiation.
3.2. Magnetic Field
Since magnetic fields can more easily pass through low-impedance shields than electric fields, they pose a greater interference risk. Along with electric fields, they also excite apertures and seams. Low-impedance antennas, especially circuit loops, can best receive them. As a result, since loops are frequently difficult to identify, eliminating loops presents a challenging design problem. Boxleitner [48] proposes ways to reduce loop area through effective routing strategies. Analyses of the E/M fields radiated by ESD are both possible. The derivative of the magnetic field from a dipole of length dz′ in cylindrical coordinates (ρ, φ, z) can be calculated by Equation (8):
Integrating Equation (8), the magnetic field strength is given by Equation (9):
According to Equation (9), the magnetic field is dependent on the current i(t), which predominates in the near field zone, and the current derivative , which predominates in the far field zone.
In the near field, the H-field behaves according to:
while in the far field, it is found as:
Similar to the electric field, the near magnetic field is directly affected by the ESD current form. As a result, we would anticipate that the highest fields would correspond to the highest current levels. Like the electric field, the magnetic far field depends on the time derivative of the current. Therefore, the low-voltage, quick rise-time sparks interfere the most with nearby equipment. D. Pommerenke [49] examined how the magnetic field alters with distance. Equation (12) can be used to determine the magnetic field at the ground plane if the current derivative term is negligible ():
If or then the Ampere’s law is valid, and Equation (12) can be simplified as follows:
It is rather simple to explain the E/M process when a charged human body is placed in front of an EUT. Between the fingertip and the EUT, an electrostatic field forms prior to the breakdown. The geometry of the conducting bodies, the distances, and the external factors affect this field. The ionization of the air uses a portion of the focused electric energy. Free electrons are driven by the strong electric field that causes a discharge current. Early in development, the magnetic energy increases while the electric field simultaneously decreases.
Wilson and Ma [47] were the first to model the ESD event using an elementary dipole above the ground. The radiated fields in the far field after computations from the model, compared with the measured ones, were found to have qualitatively good agreement between model and experiment. Later, Pommerenke [50] measured the near radiated fields, also finding a good agreement between theory and experiment.
Simulations of air ESD must combine a non-linear arc model with an object, combining an arc model with a geometry model. Pommerenke in [50] used a time step algorithm based on a method of moments. Its implementation is shown in Figure 3, and it uses a thin wire approximation, point matching, and square base functions based on a dipole structure. The thin wire approximation (of total length L and thickness b) limits the maximum thickness of the dipole to about one-third of the time/space steps (Δx = cΔt). The use of small-time steps is crucial because the charge near the arc affects the initial peak. Rompe and Weizel’s law is numerically expressed to simulate the arc:
where R is the arc resistance (in Ohms), d is the arc length (in m), i the discharge current (in A) and a is an empirical constant equal to (0.5 − 1) × 10−4 m2/V2.
4. Electromagnetic Field Measurement Radiated by ESD
4.1. Electric and Magnetic Field Coupling of the ESD Generator
The IC’s susceptibility to ESD is rising. The shrinking structural width of ICs is one cause of this greater sensitivity. Microcontrollers and application-specific integrated circuits (ASICs) are presently getting close to 10 nm. Higher switch rates for the transistor cells are made possible by shrinking structural geometries, which also lower the supply voltage. This inevitably makes ICs more susceptible to influence.
Typically, the ESD generator looks like a gun with a metal point. This metal tip is used to test “contact discharge” by lightly touching metallic components of the test apparatus to start the test pulse. The interference is pertinent to the current pulse that was introduced. This ESD current waveform is described in IEC 61000-4-2 [15]. The interference effect during the test process should be defined by its curve shape parameters. In real life, curve form specifications are not always tracked by the ESD generator. There are interference events that are challenging to understand. For instance, some EUT may only encounter interference when facing the right side of the generator, with no interference from the left or other sides. Fields from the generator’s housing that act on the EUT can explain this.
Rapid transient magnetic and electric fields are radiated by ESD generators. During testing, the EUT may be affected by these fields that come from the ESD generator’s casing. The electrical circuit’s ICs will consequently respond with failures in accordance with their sensitivity. The maker and technology have an impact on an IC’s sensitivity. An IC’s ability to detect and generate mistakes from shorter disturbance pulses increases with speed. These fields are generated by the structural elements inside the ESD generators. The toggling of the high voltage switch produces electric fields (Figure 4a). The consequent recharge currents result in magnetic fields (Figure 4b).
From the ESD generator, the electric pulse fields capacitively couple to the IC’s internal signal lines, test spots, pads, and pins. The frequency range corresponds to the coupling capability. The field strength E and its change over time (dE/dt) determine the interference impact of the generator. In the circuits, the magnetic field causes voltage to be induced in conductor loops. These loops may be present on the component or within the IC as conductive lines.
Many different internal conductor systems, switches, and components found in ESD generators can produce E- or H-fields. The ESD generator’s high-voltage trigger has a switching range of 100 ps. The user has the option of holding the generator tip in various positions and distances from the EUT. In some circumstances, the generator housing may press up against the EUT. This moves the generator’s various field-generating components and the electronics closer together. Practice has shown that different ESD generators have different interference patterns based on their type and placement.
4.2. Measurement Setups and Instrumentation for the Measurement of the E/M Field Produced by ESD
Table 1 presents the most significant research works on the E/M field measurement by electrostatic discharges with other measured magnitudes derived by the same experimental setups. Takai et al. [51] make recommendations for measurement tools designed specifically for E/M fields generated by ESD near electronic equipment. The observed EMI intensity is a relative number because this measurement apparatus was created with the intention of identifying ESD and documenting the moment it occurred. In [52], a new method for monitoring impulses was created. This system uses the associated fields to reliably identify ESD. With a bandwidth of more than 1 GHz, this monitoring device logs electric and magnetic field values and their peak derivatives. Additionally, time and environmental data (such as temperature and humidity) are logged. The monitoring system is explained, and approaches to data evaluation are given.
Bendjamin examined the magnetic field and optical radiation produced by electrostatic discharges [53,54,55]. The results presented showed that by reducing the conductivity of the material that the EUT is made from, one can reduce the peak current as well as the peak derivative of the magnetic field. In [56], Pommerenke and Aidam compared human ESD currents, current derivatives, and transient fields to currents and fields produced by commercial simulators. The findings highlight the standardized setup and undefinable yet important simulator characteristics. There are suggestions for potential enhancements to the ESD test standards. The ESD current can be calculated using the provided formula.
The aim of reducing the influence of the simulator was investigated by Frei and Pommerenke in [57], examining the field values on the horizontal coupling plane for various excitations and grounding topologies. In [58], it has been suggested and validated to use a numerical model to simulate ESD generators. Based on the charge voltage and the manufacturing details of the ESD generator, the simulation results can be used to forecast the current and field of ESD generators. For parametric research, the results’ precision is satisfactory. The model is appropriate for computing the coupling between structures. If the brand of the ESD generator is changed, it enables prediction and investigation into the causes of test result variations.
Even though ESD current curves for different generators are similar, regarding the Imax, tr, I30, and I60 parameters, tests show different outcomes (pass or fail) for the same EUT depending on the generator that has been used. This occurs because there is no specification for the generated transient field that differs for each ESD generator. The test’s repeatability must be improved by such a specification. Working in this direction, Pommerenke [58] investigates the requirements for the current derivative, fields, and induced voltages produced by ESD events. Comparisons are made between the reference event parameters and common ESD generators.
The study in [22] uses measurements collected by field sensors and an effective numerical prediction model to evaluate the electric and magnetic fields caused by electrostatic discharges (ESDs). Software that utilizes the finite integration technique (FIT) is used to implement the numerical prediction model. Considering the generator’s loading impact, the ESD generator is effectively modeled, and the contact mode discharge current is accurately captured.
During the verification of these generators and for contact discharges, Fotis et al. [37,38] measured the electric and magnetic fields radiated by commercial ESD generators at various distances from the discharge point and at various directions in the near field. The same E/M field sensors were used by Pommerenke et al. [12] for modeling electrostatic discharge. In [39], Fotis et al. conducted the same measurements but with different types of sensors. The sensors used were from Rohde Schwartz. The IEC standard on ESD [15] describes the measurement procedure for the measurement of the E/M field radiated by ESD generators. However, these measurements are not compulsory but informative, which maybe should be compulsory in its next revision.
4.3. E and H Field Sensors for the Measurement of the Electromagnetic Field from ESD
4.3.1. Ground-Based Field Sensors with Active Integration
A ground-based field sensor type with active integration has been created [37,38,56] using a multistep analog integration for the H-field sensor and an impedance converter made of GaAs for the E-field sensor. They are roughly 4 cm by 3 cm by 1 cm in size and have a rectangular shape. Figure 5 depicts these sensors, and Figure 6 depicts the circuit that can be used to describe how the compensatory function of the lower frequency response works. The authors in [58] provide a thorough examination of these sensors and their calibration.
The E-field sensor has a dynamic range of 20 V/m to 20 kV/m. When measured in an open strip line, the sensor has a 1.5 dB frequency response from 2.5 MHz to 2 GHz. Using a frequency response setup, the sensor’s 194 uV(V/m) sensitivity can be calibrated. A network analyzer and a sensor mounted on a strip line make up the calibration setup.
The H-field sensor has a dynamic range of 0.1 A/m to 200 A/m. When measured in an open strip line, the sensor has a 1.5 dB frequency response from 2.5 MHz to 2 GHz. The calibration process, which makes use of a frequency response setup, can identify the sensor’s sensitivity, which is 124.14 uV (A/m). A network analyzer and a sensor mounted on a strip line make up the calibration setup.
4.3.2. Passive E- and H-Field Sensors
The E-field sensors are ball probes that can detect signals up to 2.5 GHz and were used to measure the electric field [53,54]. The ball probe shaft is constructed of a length of 50-ohm coax. The coax is terminated at its end with a 50-ohm resistor to present a conjugate termination to the 50 ohm line. Then, the center conductor is extended beyond the 50 ohm termination and attached to a metal ball. The ball serves as an E-field pick-up. However, the absence of a closed loop prevents current flow, allowing the ball probe to reject the H-field.
The induced voltage in the E-field probe was calibrated to get the electric displacement vector using Gauss’s law:
where R is the resistor’s characteristic load impendence, which is 50 ohms, D is the magnitude of the electric displacement vector, V0 is output voltage of the probe (in volts), Aeq is the equivalent sensor’s (ball probe) given in (16), and ε0 = 8.854 × 10⁻¹² F⋅m−1. Since the ball probe’s diameter is 3.6 cm, the following equation is derived:
By numerically integrating the derivative of the electric field strength, the electric field strength E is obtained. This sensor type is shown in Figure 7a.
H-field sensors capable of sensing signals up to 1.5 GHz were used to measure the magnetic field [39,53,54]. A 3 cm diameter loop probe with a single-turn, shorted loop inside a balanced E-field shield operates as the sensor. To make the loop, a single piece of 50-ohm semi-rigid coax from the connector is turned into a loop. The coaxial cable’s center conductor and shield are arranged in a 360-degree circle around the shaft’s shield, where they connect to the shaft of the probe. As a result, a single, compacted turn is formed, and the E-field shield of the coax shield is balanced. The usual impedance of the loop and shield structure is 50 ohms, forming a balanced shield so that the loops effectively reflect E-field signals.
The induced voltage in the H-field probe was calibrated to get the magnetic flux density derivative using Faraday’s law of induction according to Equation (17):
where V0 is the sensor’s output (in volts) and Aeq is the equivalent sensor’s area (in m2). Consequently, a measured voltage of 1 volt with a loop probe of 3 cm in diameter equals to 1/7.0686 × 10−4 = 1414.71 tesla/s. By integrating the derivative of the magnetic field, the magnetic field (Bφ) or the magnetic field strength (Hφ) is obtained, where φ is the azimuthal coordinate around the tip axis. Figure 7b depicts this kind of sensor.
5. Comparison of Experimental Results from the International Literature
At this point, it is necessary to compare the experimental results for the measurement of the E/M field, as derived by various researchers. It must be emphasized that the study of the field produced by electrostatic discharges is a particularly difficult issue due to the rapid transient phenomenon of electrostatic discharge, which requires the use of specially constructed sensors. For this reason, there have been different results both in terms of the form of the magnetic or electric field produced and in terms of the values that are measured each time.
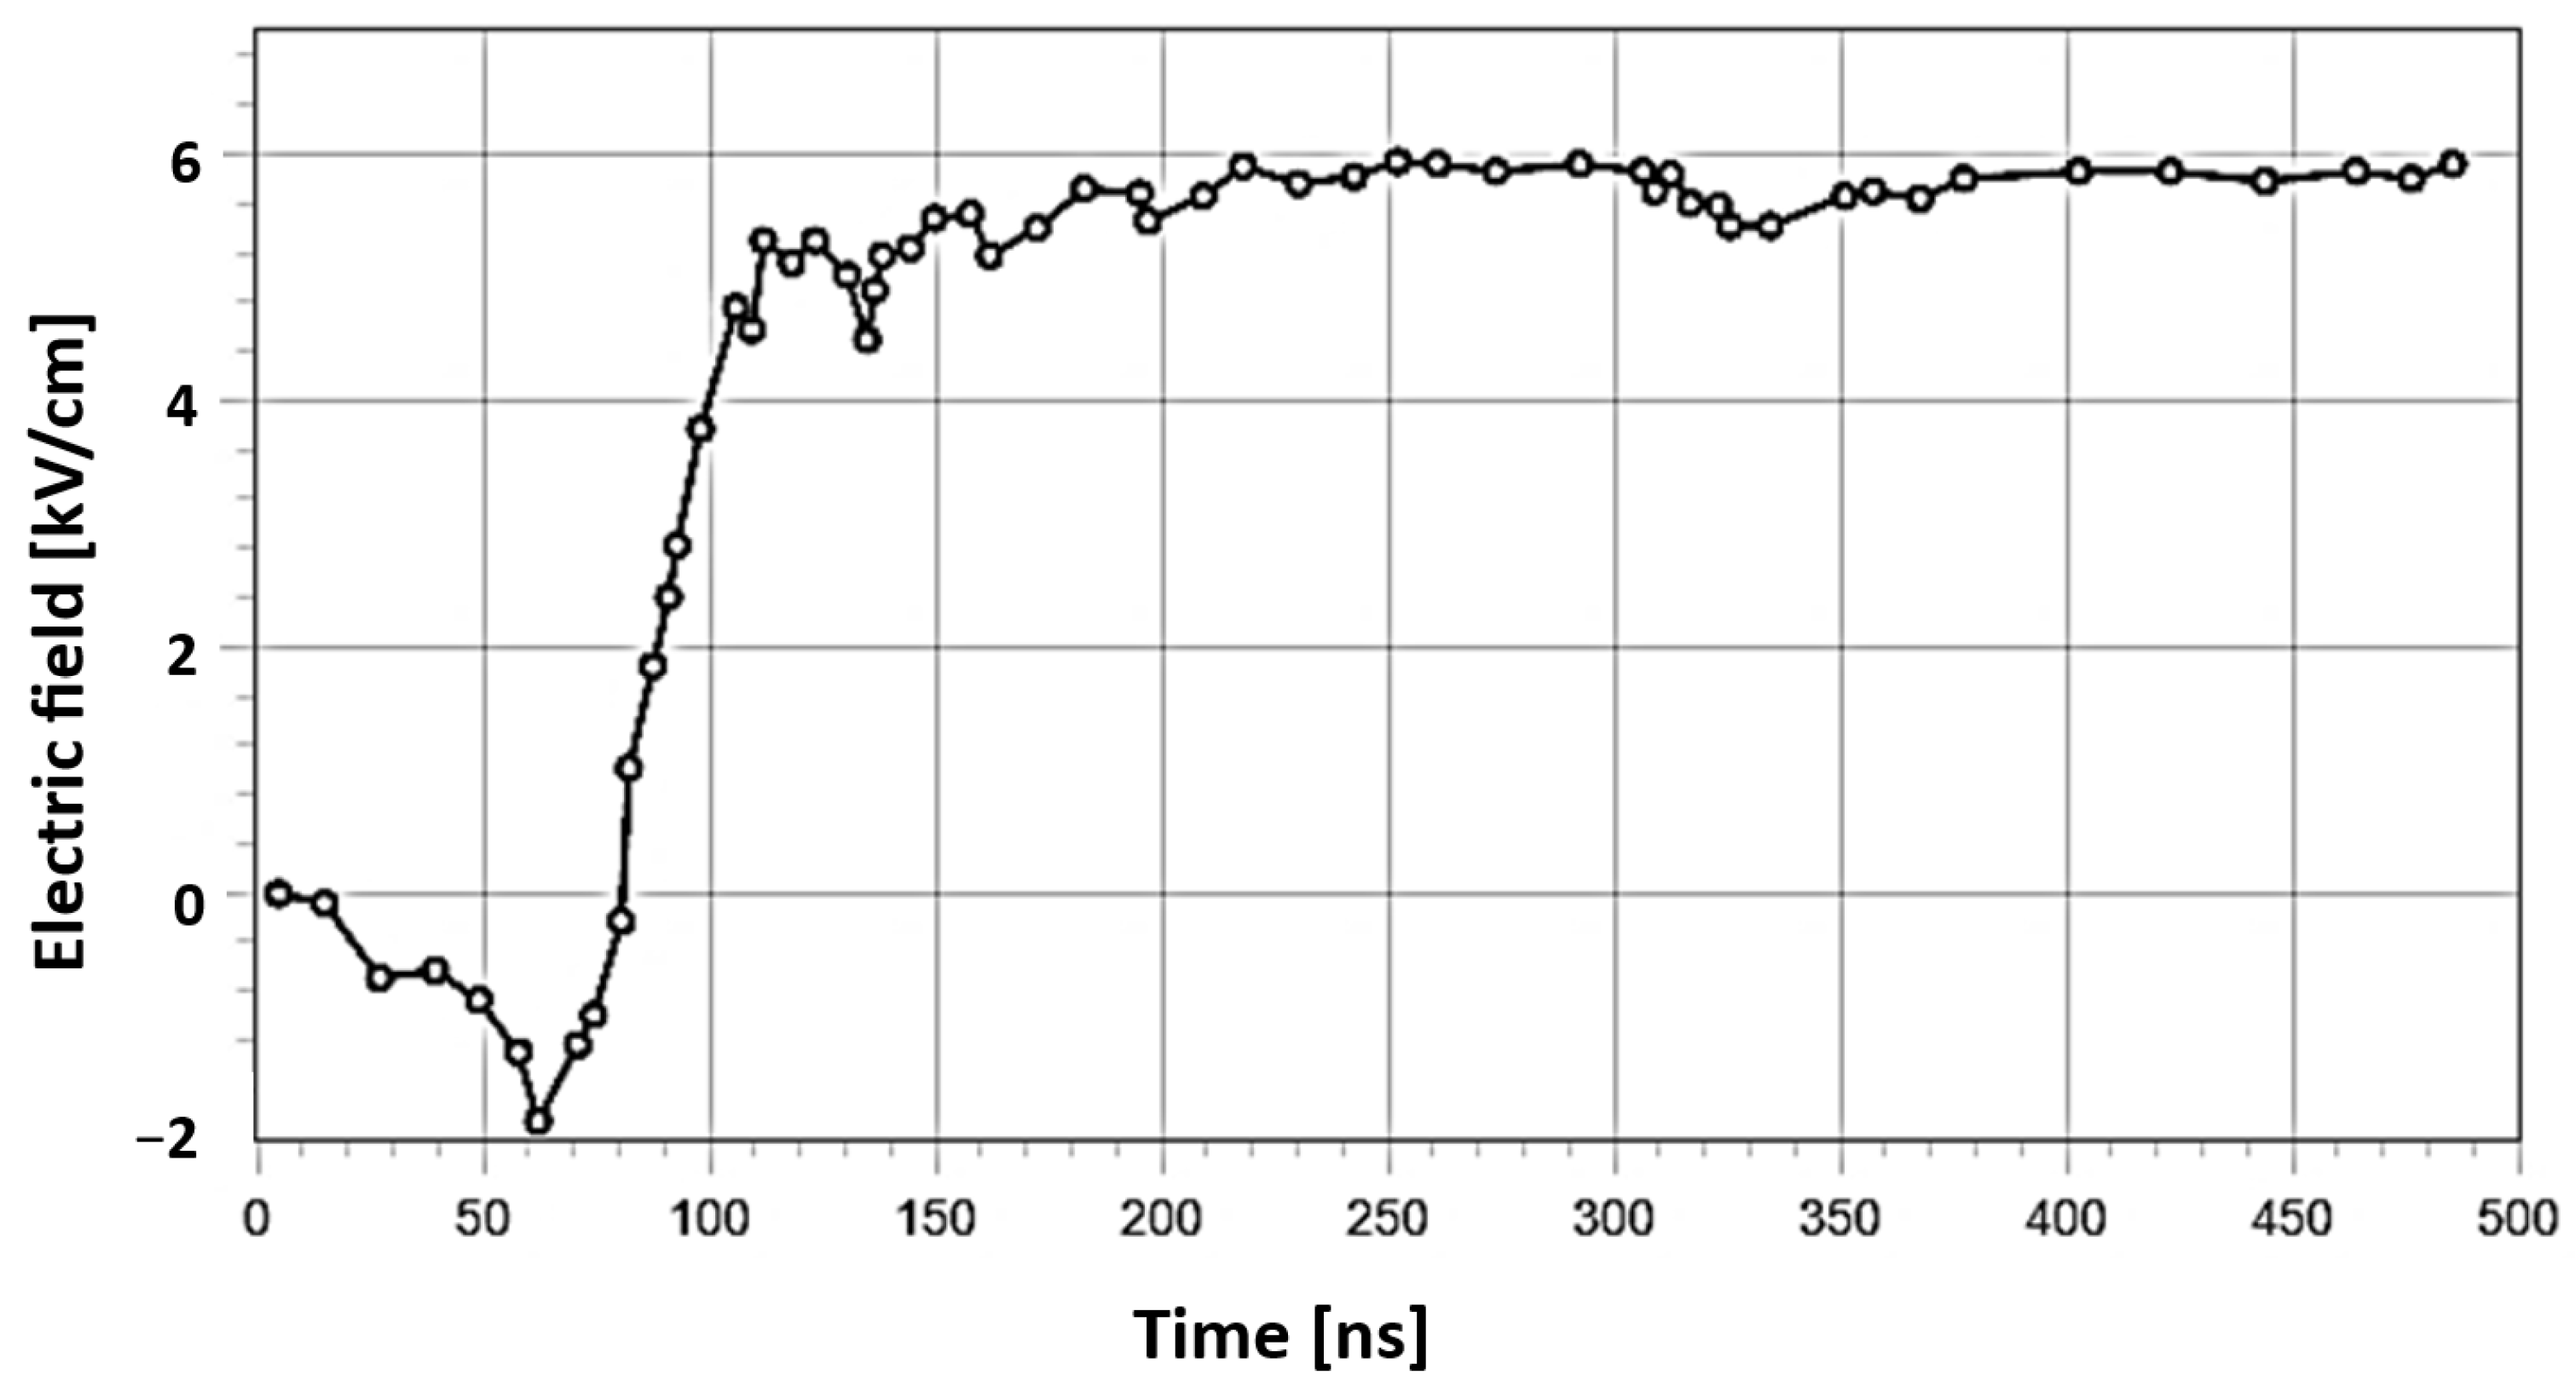
In [39], measurements of the E/M field were presented using passive sensors manufactured by Rohde & Schwartz, when the coaxial measuring adapter was on an insulating material. Typical waveforms for the measured magnetic and electric fields are shown in Figure 8 and Figure 9, respectively. The same type of sensor has been used by Bendjamin [53,54], who tried to examine the characteristics of electrostatic discharge based on the current, optical radiation, and the generated E/M field. He measured the radiated electric and magnetic fields for air discharges in small gaps. Examples of waveforms resulting from his measurements are shown in Figure 10 and Figure 11 below. A comparison between the experimental results of these two researchers proves that there are some differences in the measured E/M field. This has to do with differences in the experimental setups, the different types of generators and equipment that have been used to carry out the experiments, and the fact that the discharges studied by Bendjamin were air discharges and not contact discharges. It must be noted that due to the lack of specific measuring equipment for the E/M field, various researchers have been enabled in such measurements using different equipment and measuring setups. Consequently, a comparison of experimental results regarding the same or almost the same experimental setup using passive field sensors is not available in the literature.
Pommerenke in [57] measured the E/M field from electrostatic discharge generators with the sensors mentioned in Section 4.3.1. In Figure 12, measurements of the magnetic and electric fields with these sensors are presented, when the coaxial measuring adapter was in the center of a grounded metal plate, with dimensions of 1.6 m × 0.8 m. The measuring sensors for both the magnetic and the electric fields were placed at a 10 cm distance from the point of discharge, while measurements of the produced E/M field were made for three different generators for charging voltages of 3 kV.
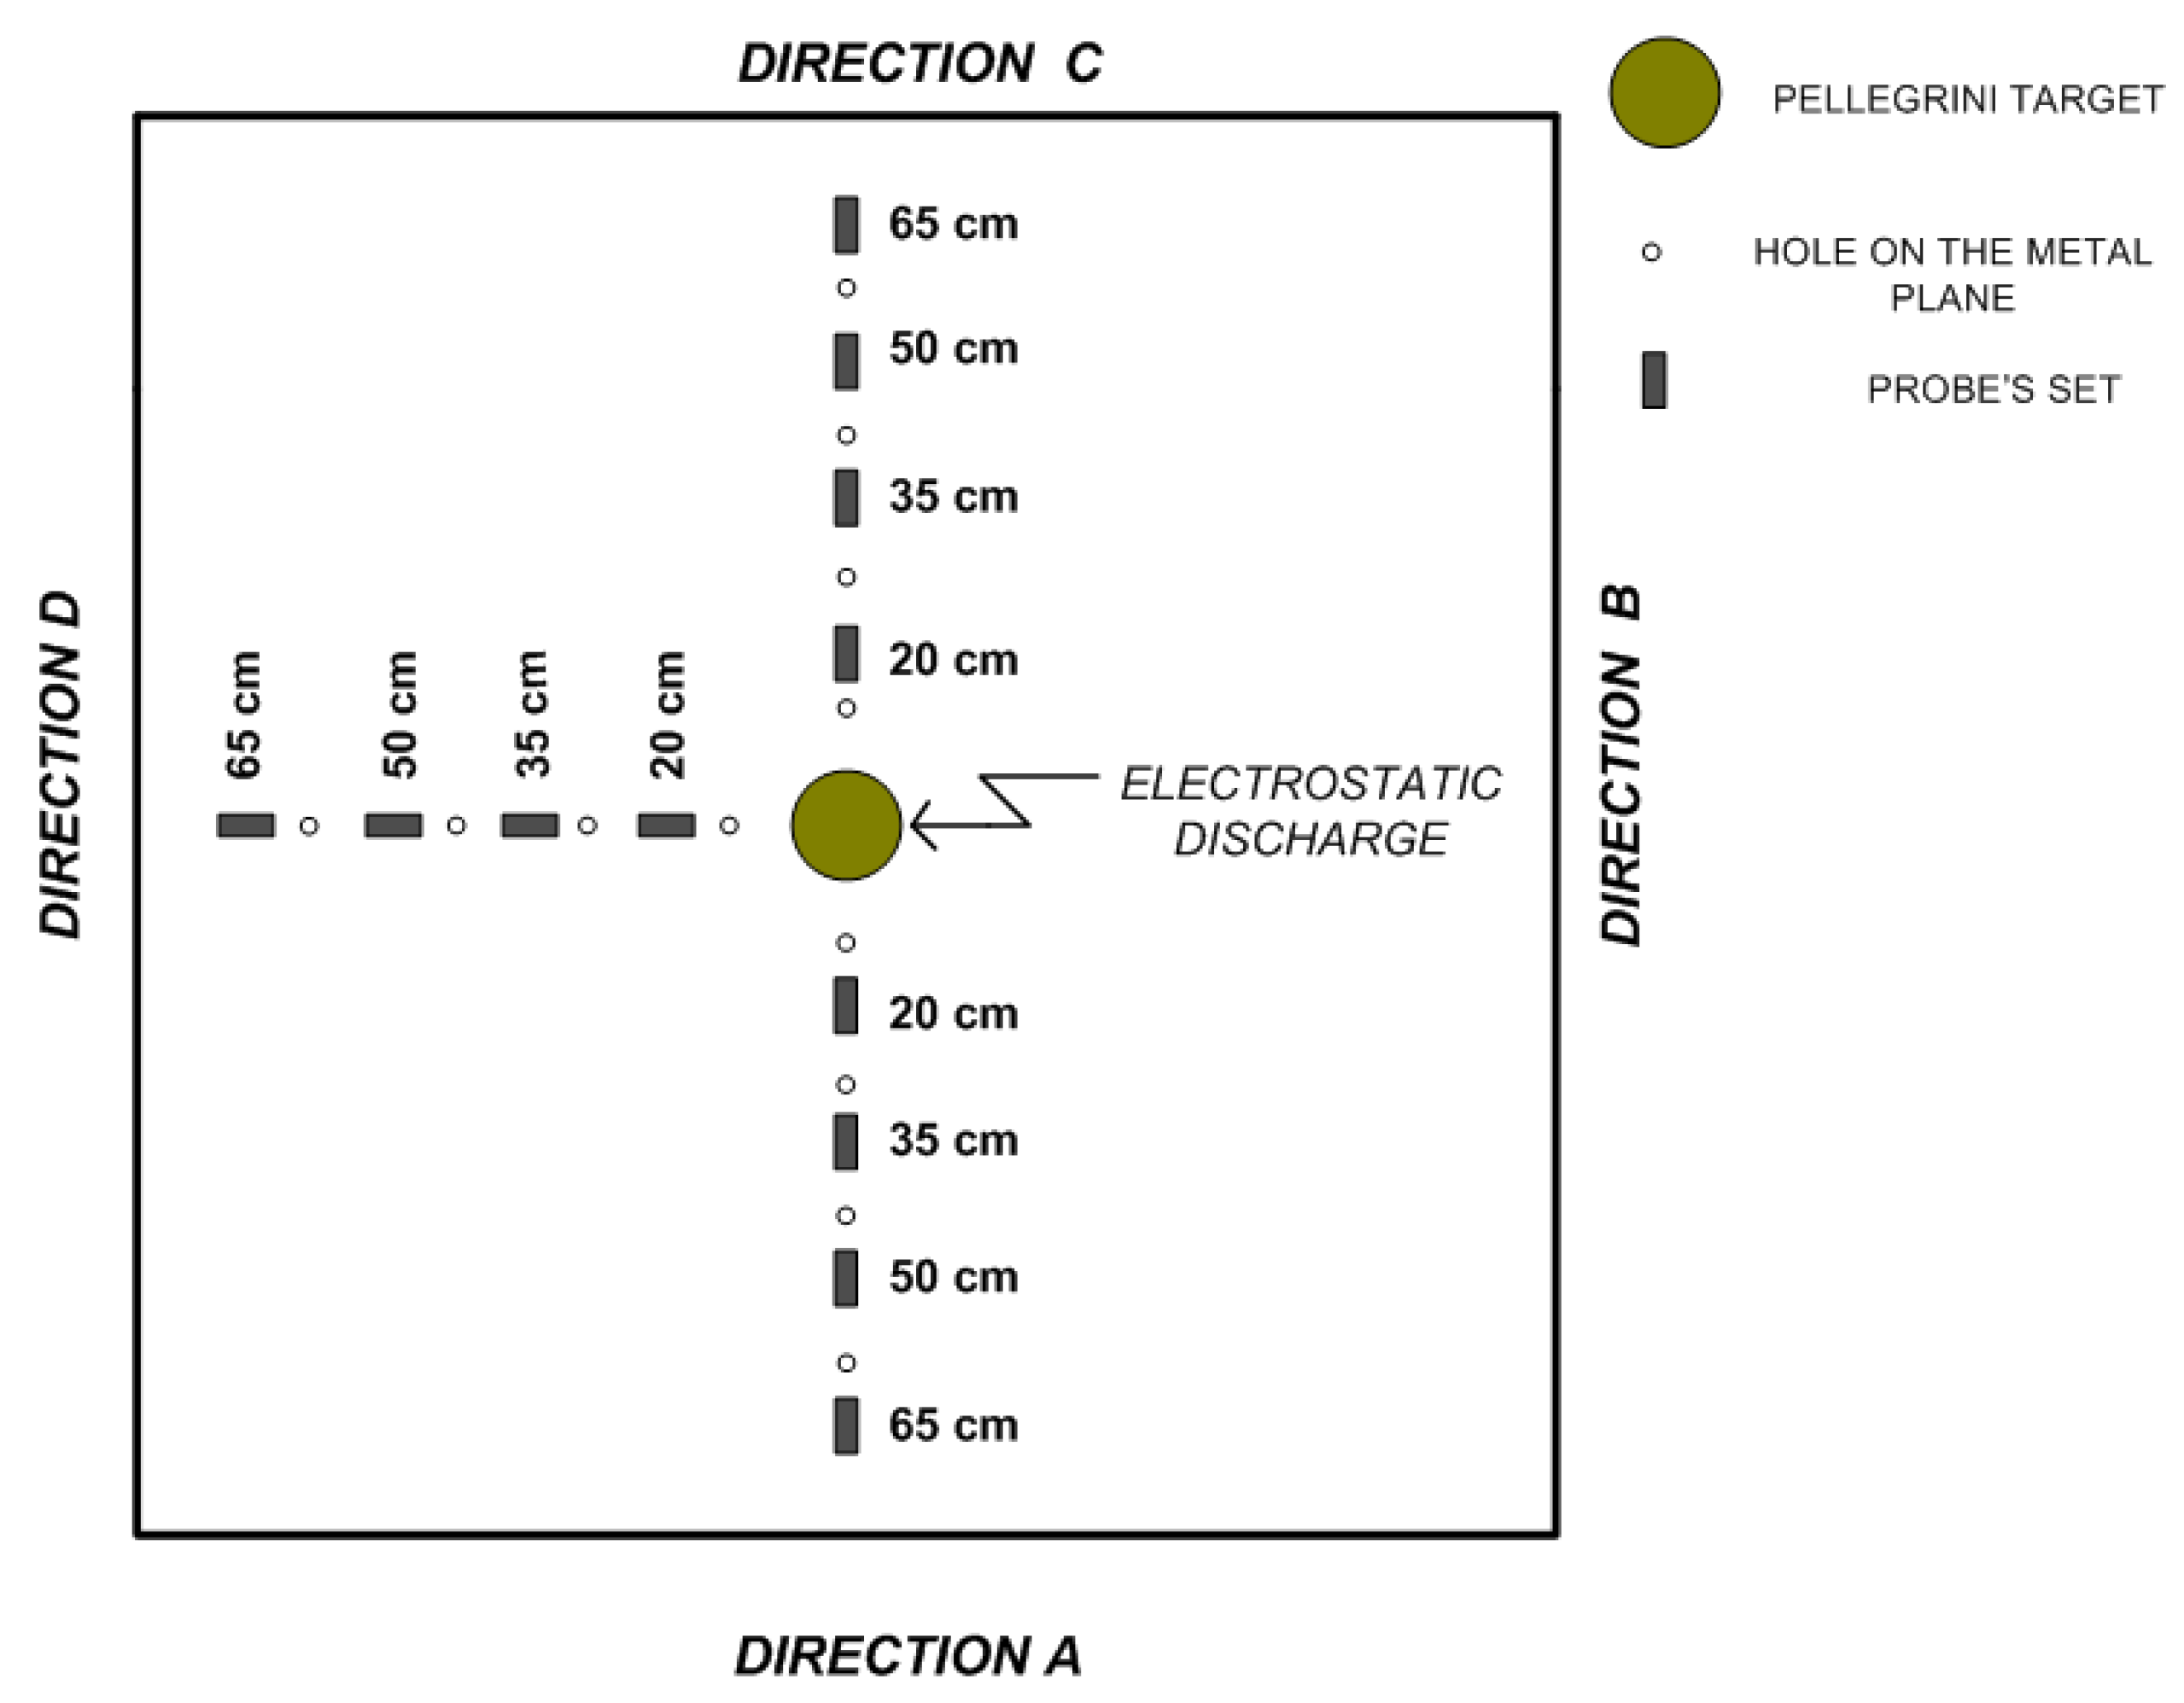
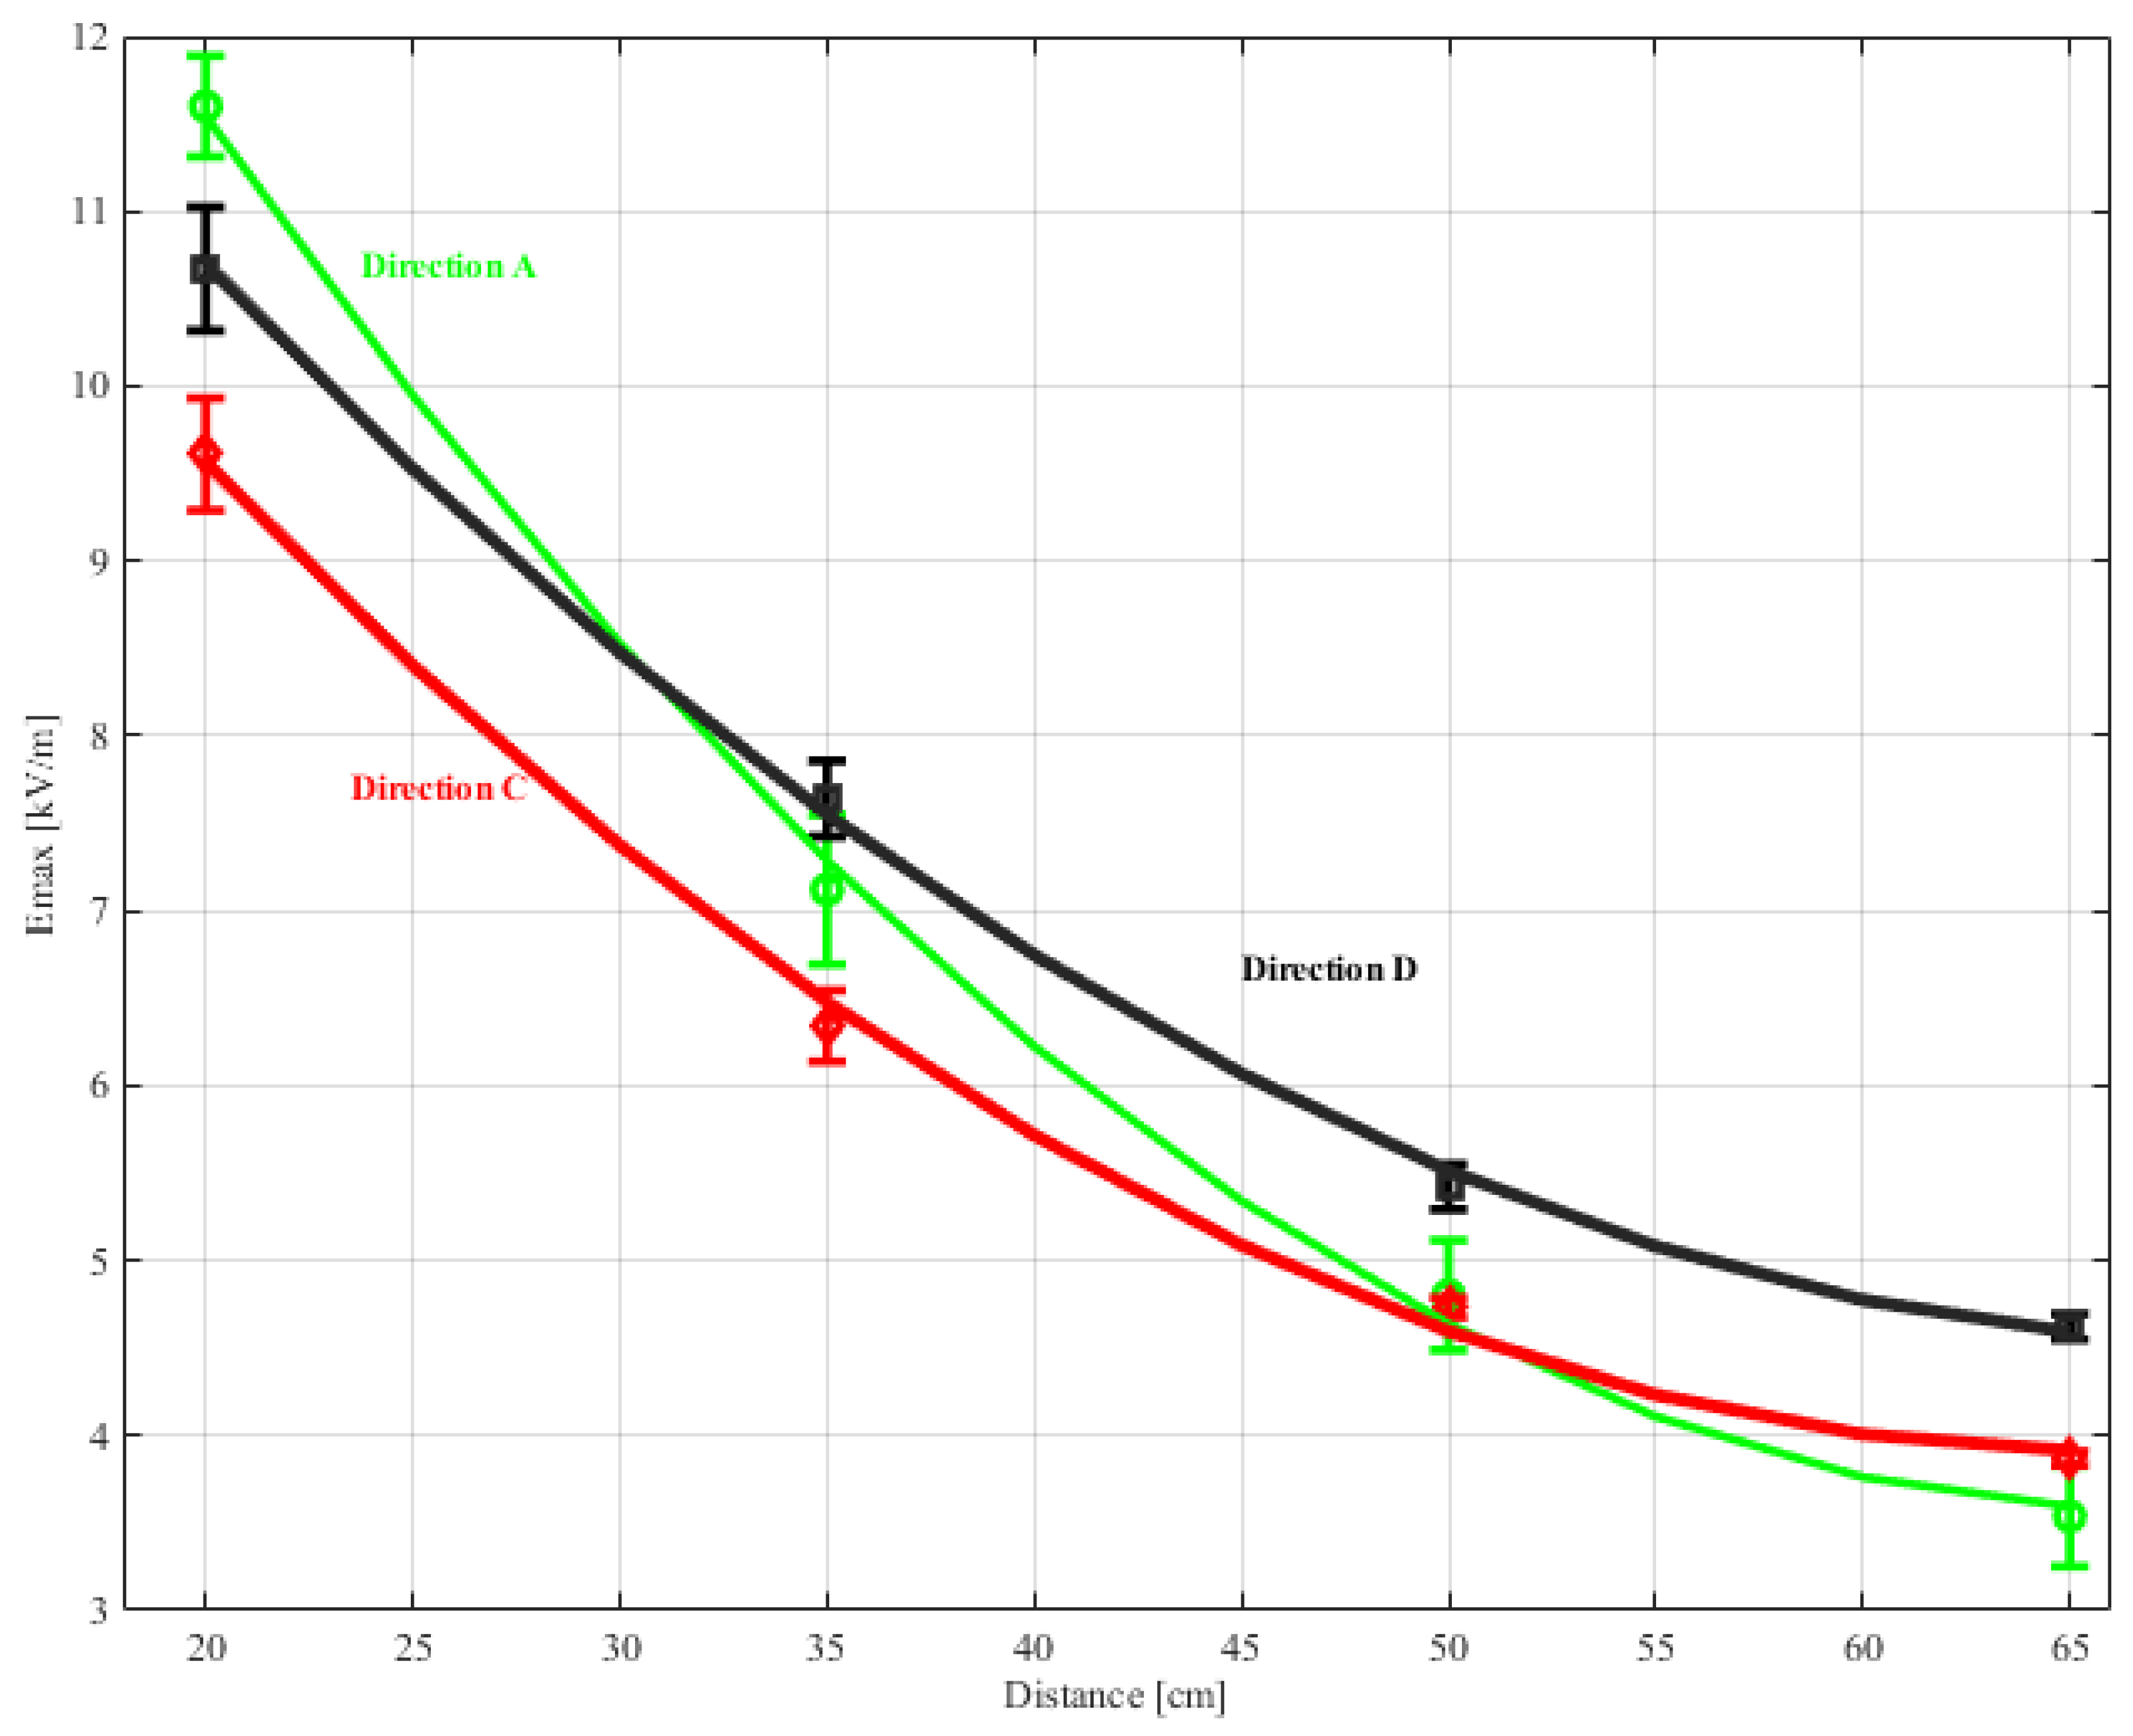
Fotis et al. [37,38] measured the radiated electric and magnetic fields from commercial ESD generators using the same sensors as Pommerenke when the Pellegrini target was mounted in the center of a 1.5 m × 1.5 m metal plate and for various directions and distances from the discharge point, as shown in Figure 13 and Figure 14, respectively. It was found that each generator produced a different electric and magnetic field, depending on its orientation. Figure 15 and Figure 16 present the average maximum values for the magnetic and electric field strengths, respectively, for the same ESD generator at various distances from the discharge point.
Regarding the maximum values of the magnetic and electric fields, it should be noted that comparisons between the maximum values of the magnetic and electric field measurements, which have been carried out in various research works, would not be correct to make on the one hand because the generators that have been used in each case are different and, on the other hand, because the equipment that has been used is also different. After all, according to Sroka and Leuchtmann [60], the results of the measurements differ depending on the measuring system used each time.
6. Discussion—Suggestions for the IEC 61000-4-2’s Next Revision
The different magnetic or electric fields, produced by different generators or by the same generator depending on its orientation, result in the induced voltages at adjacent points also being different. This implies that a test that is conducted by one generator passes the test according to IEC standard 61000-4-2 [15], while the other fails. This fact demonstrates the necessity of studying the E/M field produced by the various electrostatic discharge generators so that in the next revision of the standard [15] there will be manufacturing instructions for these generators, which will determine the limits of the generated fields. The fact that there is an asymmetry in the distribution of the E/M field around the electrostatic discharge generator occurs because of (a) the asymmetrical high voltage relays inside the generators and (b) the position of the generator ground cable. During the experiments, the ground wire must be in the same position so that the measurements of the produced field are repeatable.
Annex D of the current IEC 61000-4-2 is on the radiated fields from human metal discharge and ESD generators. However, Annex D is informative and the described measurement techniques are not compulsory. In the upcoming revision of the standard [15], the E/M field parameter, produced by electrostatic discharge generators, could be included as mandatory. Specifically, the setup that will be used for the measurement of the E/M field should be defined. The sensors should be similar to those of D. Pommerenke [58]. At the same time, limits could be set for some parameters of the magnitudes of the field during its verification, such as the maximum field strength of the electric or magnetic field, Emax and Hmax, respectively, the rise time of the electric or magnetic field, and, possibly, values of the field’s change (derivative). Additionally, the measurement of the E/M field during the verification of the generators should be done around 360 degrees, which is of course quite difficult from the point of view of implementation for the laboratories around the world. In this way, the uncertainty during the verification of the generators will be reduced, while the tests on real samples will be more reliable since their repeatability will be ensured to a greater extent than now. The research outcome for the prediction of the E/M field in [40,41,42] should also be included in the standard’s next revision, since it will be a valuable tool for the laboratories involved in ESD testing.
In the next revision of the standard [15], it could be defined how an electrostatic discharge generator should be constructed so that the produced E/M field is uniform around the generator. If such a thing is not yet feasible, the manufacturers of electrostatic discharge generators could, to make their products easier to use, write on the generators the direction in which the generator produces the greatest electric and magnetic field strength so that this is considered when using them. When testing equipment, and particularly in marginal situations where a product is on the borderline of passing or failing, the standard should state that the tests should be made in the direction that produces the highest field. In this way, the best reliability of the tests will be ensured.
Finally, it should be mentioned that the next revision of the standard [15] should aim to reduce the uncertainty of the conducted tests. It should be emphasized that the uncertainty of the tests will clearly be reduced if limits and magnitudes are adopted for the E/M field produced by electrostatic discharges. There will always be other causes even if the effect of the E/M field is zero, such as the different length of the electric arc in electrostatic air discharge tests or the different position of the generator ground wire.
7. Conclusions
In the present work, a review was made of the experimental setups and measurement sensors for the measurement of the electric and magnetic fields generated during ESD. Extensive reference was also made to the existing standard for ESD, and it was found that there is a need in its next revision to make it mandatory to measure the E/M field during the verification of ESD generators by setting specific limits. In addition, the E/M field derived by ESD generators should be considered by the designers of such generators during their design phase.
Funding
This research received no external funding.
Conflicts of Interest
The author declares no conflict of interest.
References
- Wang, A. Practical ESD Protection Design, 1st ed.; Wiley: Hoboken, NJ, USA; IEEE Press: Piscataway, NJ, USA, 2021. [Google Scholar]
- Bafleur, M.; Caignet, F.; Nolhier, N. ESD Protection Methodologies: From Component to System, 1st ed.; ISTE Press–Elsevier: Amsterdam, The Netherlands, 2017. [Google Scholar]
- Richman, P. ESD Simulation-Configuring a Full-Performance Facility. In Proceeding of the IEEE International Symposium on Electromagnetic Compatibility, Arlington, VA, USA, 23–25 August 1983; pp. 1–5. [Google Scholar] [CrossRef]
- Duvvury, C.; Gossner, H. System Level ESD Co-Design; Wiley-IEEE Press: London, UK, 2015. [Google Scholar]
- Yousaf, J.; Shin, J.; Kim, K.; Youn, J.; Lee, D.; Hwang, C.; Nah, W. System level esd coupling analysis using coupling transfer impedance function. IEEE Trans. Electromagn. Compat. 2018, 60, 310–321. [Google Scholar] [CrossRef]
- Muchaidze, G.; Koo, J.; Cai, Q.; Li, T.; Han, L.; Martwick, A.; Wang, K.; Min, J.; Drewniak, J.L.; Pommerenke, D. Susceptibility scanning as a failure analysis tool for system-level electrostatic discharge (ESD) problems. IEEE Trans. Electromagn. Compat. 2008, 50, 268–276. [Google Scholar] [CrossRef]
- Intra, P.; Tippayawong, N. Design and evaluation of a high concentration, high penetration unipolar corona ionizer for electrostatic discharge and aerosol charging. J. Electr. Eng. Technol. 2013, 8, 1175–1181. [Google Scholar] [CrossRef] [Green Version]
- Wang, K.; Pommerenke, D.; Zhang, J.M.; Chundru, R. The PCB level ESD immunity study by using 3-dimension ESD scan system. In Proceedings of the International Symposium on Electromagnetic Compatibility, Silicon Valley, CA, USA, 9–13 August 2004; pp. 343–348. [Google Scholar]
- Honda, M. Fundamental aspects of esd phenomena and its measurement techniques. IEICE Trans. Commun. 1996, 79, 457–4616. [Google Scholar]
- Leo, G.C.R.D.; Primiani, V.M. ESD in electronic equipment: Coupling mechanisms and compliance testing. In Proceedings of the Industrial Electronics ISIE 2002, L’Aquila, Italy, 8–11 July 2002; pp. 1382–1385. [Google Scholar]
- Caniggia, S.; Maradei, F. Circuit and numerical modeling of electrostatic discharge generators. IEEE Trans. Ind. Appl. 2006, 42, 1350–1357. [Google Scholar] [CrossRef]
- Pommerenke, D.; Fan, J.; Drewniak, J. Simulation challenges in system level electrostatic discharge modeling. In Proceedings of the IEEE/ACES International Conference on Wireless Information Technology and Systems (ICWITS) and Applied Computational Electromagnetics (ACES), Honolulu, HI, USA, 13–18 March 2016; pp. 1–2. [Google Scholar]
- Smith, D.C. Techniques for investigating the effects of ESD on electronic equipment. J. Phys. Conf. Ser. 2015, 646, 012036. [Google Scholar] [CrossRef]
- Berghe, S.V.; Zutter, D.D. Study of {ESD} signal entry through coaxial cable shields. J. Electrost. 1998, 44, 135–148. [Google Scholar] [CrossRef]
- IEC 61000-4-2; Electromagnetic Compatibility (EMC)-Part 4-2: Testing and Measurement Techniques Electrostatic Discharge (ESD) Immunity Test. IEC: London, UK, 2008.
- Fotis, G.; Gonos, I.F.; Assimakopoulou, F.E.; Stathopulos, I.A. Applying genetic algorithms for the determination of the parameters of the electrostatic discharge current equation. Inst. Phys. (IOP) Proc. Meas. Sci. Technol. 2006, 17, 2819–2827. [Google Scholar] [CrossRef] [Green Version]
- Fotis, G.; Gonos, I.F.; Stathopulos, I.A. Determination of the Discharge Current Equation Parameters of ESD using Genetic Algorithms. IEE Electron. Lett. 2006, 42, 797–799. [Google Scholar] [CrossRef] [Green Version]
- Katsivelis, P.; Fotis, G.; Gonos, I.F.; Koussiouris, T.G.; Stathopoulos, I.A. Electrostatic Discharge Current Linear Approach and Circuit Design Method. Energies 2010, 3, 1728–1740. [Google Scholar] [CrossRef] [Green Version]
- Fotis, G.; Vita, V. Circuit Modeling and Simulation of the ESD Generator for Various Tested Equipment According to the IEC 61000-4-2. WSEAS Trans. Circuits Syst. 2022, 21, 193–201. [Google Scholar] [CrossRef]
- Yousaf, J.; Shin, J.; Lee, H.; Youn, J.; Lee, D.; Hwang, C.; Nah, W. Esd triggered current analysis for floating eut with/without shielding of esd generator. In Proceedings of the 16th International Symposium on Microwave and Optical Technology, Seoul, Republic of Korea, 26–28 June 2017; p. 1. [Google Scholar]
- Yousaf, J.; Shin, J.; Leqian, R.; Nah, W.; Youn, J.; Lee, D.; Hwang, C. Effect of ESD generator ground strap configuration on esd waveform. In Proceedings of the Asia-Pacific International Symposium on Electromagnetic Compatibility (APEMC), Seoul, Republic of Korea, 20–23 June 2017; pp. 121–123. [Google Scholar]
- Caniggia, S.; Maradei, F. Numerical prediction and measurement of ESD radiated fields by free-space field sensors. IEEE Trans. Electromagn. Compat. 2007, 49, 494–503. [Google Scholar] [CrossRef]
- Zhang, J.; Beetner, D.G.; Moseley, R.; Herrin, S.; Pommerenke, D. Modeling electromagnetic field coupling from an ESD generator to an IC. In Proceedings of the Electromagnetic Compatibility (EMC) IEEE International Symposium, Long Beach, California, USA, 14–19 August 2011; pp. 553–558. [Google Scholar]
- Park, M.; Park, J.; Kim, J.; Seung, M.; Choi, J.; Lee, C.; Lee, S. Measurement and modeling of system level ESD noise voltages in real mobile products. In Proceedings of the 2016 Asia-Pacific International Symposium on Electromagnetic Compatibility (APEMC), Shenzhen, China, 17–21 May 2016; pp. 632–634. [Google Scholar]
- Lee, J.; Lim, J.; Jo, C.; Seol, B.; Nandy, A.; Li, T.; Pommerenke, D. A study of a measurement and simulation method on ESD noise causing soft errors by disturbing signals. In Proceedings of the 33rd EOS/ESD Symposium Proceedings, Anaheim, CA, USA, 11–16 September 2011; pp. 1–5. [Google Scholar]
- Antong, R.; Low, D.; Pommerenke, D.; Abdullah, M.Z. Prediction of electrostatic discharge (ESD) soft error on two-way radio using ESD simulation in CST and ESD immunity scanning technique. In Proceedings of the 36th International Electronics Manufacturing Technology Conference, Johor Bahru, Malaysia, 11–13 November 2014; pp. 1–10. [Google Scholar]
- Centola, F.; Pommerenke, D.; Kai, W.; Doren, T.V.; Caniggia, S. ESD excitation model for susceptibility study. In Proceedings of the IEEE Symposium on Electromagnetic Compatibility. Symposium Record (Cat. No. 03CH37446), Boston, MA, USA, 18–22 August 2003; pp. 58–63. [Google Scholar]
- Fujiwara, O.; Zhang, X.; Yamanaka, Y. FDTD simulation of electrostatic discharge current by ESD testing. IEICE Trans. Commun. 2003, 86, 2390–2396. [Google Scholar]
- Lee, J.S.; Pommerenke, D.; Lim, J.D.; Seol, B.S. ESD field coupling study in relation with PCB GND and metal chassis Pommerenke, D. In Proceedings of the 20th International Zurich Symposium on Electromagnetic Compatibility, Zurich, Switzerland, 12–16 January 2009; pp. 153–156. [Google Scholar]
- Kim, K.H.; Kim, Y. Systematic analysis methodology for mobile phone’s electrostatic discharge soft failures. IEEE Trans. Electromagn. Compat. 2011, 53, 611–618. [Google Scholar] [CrossRef]
- Park, J.; Lee, J.; Seol, B.; Kim, J. Efficient calculation of inductive and capacitive coupling due to electrostatic discharge (ESD) using PEEC method. IEEE Trans. Electromagn. Compat. 2015, 57, 743–753. [Google Scholar] [CrossRef]
- Nieden, F.; Scheier, S.; Frei, S. Circuit models for ESD-generator-cable field coupling configurations based on measurement data. In Proceedings of the Electromagnetic Compatibility (EMC EUROPE), Rome, Italy, 17–21 September 2012; pp. 1–6. [Google Scholar]
- Yoshida, T.; Masui, N. A study on system-level ESD stress simulation using circuit simulator. In Proceedings of the 2013 Asia-Pacific Symposium on Electromagnetic Compatibility (APEMC), Melbourne, VIC, Australia, 20–23 May 2013; pp. 1–4. [Google Scholar]
- Yoshida, T. A study on transmission line modeling method for system-level ESD stress simulation. In Proceedings of the 2015 Asia-Pacific Symposium on Electromagnetic Compatibility (APEMC), Taipei, Taiwan, 26–29 May 2015; pp. 577–580. [Google Scholar]
- Xiu, Y.; Thomson, N.; Mertens, R.; Rosenbaum, E. S-parameter based modeling of system-level ESD test bed. In Proceedings of the 37th Electrical Overstress/Electrostatic Discharge Symposium (EOS/ESD), Reno, NV, USA, 27 September–2 October 2015; pp. 1–10. [Google Scholar]
- Zhao, S.; Zhou, C.; Liang, Z.; Qian, Z.; Wang, Z. Modeling electromagnetic immunity of ldo under ESD electromagnetic field coupling. In Proceedings of the Asia-Pacific International Symposium on Electromagnetic Compatibility (APEMC), Shenzhen, China, 17–21 May 2016; pp. 355–358. [Google Scholar]
- Fotis, G.; Gonos, I.F.; Stathopulos, I.A. Measurement of the electric field radiated by electrostatic discharges. Inst. Phys. (IOP) Proc. Meas. Sci. Technol. 2006, 17, 1292–1298. [Google Scholar] [CrossRef] [Green Version]
- Fotis, G.; Rapanakis, A.G.; Gonos, I.F.; Stathopulos, I.A. Measurement of the magnetic field radiating by electrostatic discharges during the verification of the ESD generators. J. Int. Meas. Confed. 2007, 40, 428–436. [Google Scholar] [CrossRef]
- Fotis, G.; Christodoulou, C.A.; Pippis, C.D.; Ekonomou, L.; Zafeiropoulos, I.; Maris, T.I.; Karamousantas, D.C.; Chatzarakis, G.E.; Gonos, I.F.; Stathopulos, I.A. Measurement of the electromagnetic field radiating by commercial ESD generators with the Pellegrini target on insulating material. J. Int. Meas. Confed. 2009, 42, 1073–1081. [Google Scholar] [CrossRef]
- Fotis, G.; Ekonomou, L.; Maris, T.I.; Liatsis, P. Development of an artificial neural network software tool for the assessment of the electromagnetic field radiating by electrostatic discharges. IEE Proc. Sci. Meas. Technol. 2007, 1, 261–269. [Google Scholar] [CrossRef]
- Ekonomou, L.; Fotis, G.; Maris, T.I.; Liatsis, P. Estimation of the electromagnetic field radiating by electrostatic discharges using artificial neural networks. Simul. Model. Pract. Theory 2007, 15, 1089–1102. [Google Scholar] [CrossRef]
- Fotis, G.; Vita, V.; Ekonomou, L. Machine Learning Techniques for the Prediction of the Magnetic and Electric Field of Electrostatic Discharges. Electronics 2022, 11, 1858. [Google Scholar] [CrossRef]
- Miao, M.; Zhou, Y.; Salcedo, J.A.; Hajjar, J.-J.; Liou, J.J. A New Method to Estimate Failure Temperatures of Semiconductor Devices Under Electrostatic Discharge Stresses. IEEE Electron Device Lett. 2016, 37, 1477–1480. [Google Scholar] [CrossRef]
- Byrne, W.W. The meaning of electrostatic discharge (ESD) in relation to the human body characteristics and electronic equipment. In Proceedings of the IEEE International Symposium on Electromagnetic Compatibility, Arlington, VA, USA, 23–25 August 1983; pp. 1–12. [Google Scholar] [CrossRef]
- Gaskill, S.G.; Davuluri, P. Equivalent Circuit for I/O Electrical Fast Transient Testing. In Proceeding of the IEEE International Symposium on Electromagnetic Compatibility & Signal/Power Integrity (EMCSI), Spokane, WA, USA, 1–5 August 2022; pp. 141–145. [Google Scholar] [CrossRef]
- Woods, M.H.; Gear, G. A new electrostatic discharge failure mode. IEEE Trans. Electron Devices 1979, 26, 16–21. [Google Scholar] [CrossRef]
- Wilson, P.F.; Ma, M.T. Fields radiated by electrostatic discharges. IEEE Trans. Electromagn. Compat. 1991, 33, 10–18. [Google Scholar] [CrossRef]
- Boxleitner, W. How to defeat electrostatic discharge. IEEE Spectr. 1989, 26, 36–40. [Google Scholar] [CrossRef]
- Pommerenke, D. ESD: What has been achieved, what is less well understood. In Proceedings of the IEEE Symposium on EMC, Minneapolis, MN, USA, 19–23 August 2002; pp. 895–900. [Google Scholar]
- Pommerenke, D. ESD: Transient fields, arc simulation and rise time limit. J. Electrost. 1995, 36, 31–54. [Google Scholar] [CrossRef]
- Takai, T.; Kaneko, M.; Honda, M. One of the methods of observing ESD around electronic equipment. J. Electrost. 1998, 42, 305–320. [Google Scholar] [CrossRef]
- Frei, S.; Pommerenke, D. A transient field measurement system to analyze the severity and occurrence rate of electrostatic discharge (ESD). J. Electrost. 1998, 44, 191–203. [Google Scholar] [CrossRef]
- Bendjamin, J.; Gomes, C.; Cooray, V. Remote sensing of ESD through optical and magnetic radiation fields. IEEE Trans. Dielectr. Electr. Insul. 1999, 6, 896–899. [Google Scholar] [CrossRef]
- Bendjamin, J.; Thottappillil, R.; Scuka, V. Time varying electromagnetic fields generated by electrostatic discharges. In Proceedings of the 1st IEEE International Symposium on Polymeric Electronics Packaging, PEP ‘97 (Cat. No.97TH8268), Norrkoping, Sweden, 30 October 1997; pp. 197–202. [Google Scholar] [CrossRef]
- Bendjamin, J.; Thottappillil, R.; Scuka, V. Time varying magnetic fields generated by human metal (ESD) electrostatic discharges. J. Electrost. 1999, 46, 259–269. [Google Scholar] [CrossRef]
- Pommerenke, D.; Aidam, M. ESD: Waveform calculation, field and current of human and simulator ESD. J. Electrost. 1996, 38, 33–51. [Google Scholar] [CrossRef]
- Frei, S.; Pommerenke, D. Fields on the horizontal coupling plane excited by direct ESD and discharges to the vertical coupling plane. J. Electrost. 1998, 44, 177–190. [Google Scholar] [CrossRef]
- Wang, K.; Pommerenke, D.; Chundru, R.; Van Doren, T.; Drewniak, J.L.; Shashindranath, A. Numerical modeling of electrostatic discharge generators. IEEE Trans. Electromagn. Compat. 2003, 45, 258–271. [Google Scholar] [CrossRef]
- Chundru, R.; Pommerenke, D.; Wang, K.; Doren, T.V.; Centola, F.P.; Huang, J.S. Characterization of human Metal ESD reference discharge event and correlation of generator parameters to failure levels-part I: Reference event. IEEE Trans. Electromagn. Compat. 2004, 46, 498–504. [Google Scholar] [CrossRef]
- Leuchtmann, P.; Sroka, J. Transient field simulation of electrostatic discharge (ESD) in the calibration setup (acc. IEC 61000-4-2). In Proceedings of the IEEE International Symposium on EMC, Washington, DC, USA, 21–25 August 2000; pp. 443–448. [Google Scholar]
Figure 1.
ESD current waveform for contact discharges.

Figure 2.
The dipole source model.

Figure 3.
Geometry used for field simulation during air discharges.

Figure 4.
Coupling of the ESD generator for (a) the electric field and (b) the magnetic field.

Figure 5.
Ground-based field sensors with active integration for: (a) the E-field and (b) the H-field.
Figure 5.
Ground-based field sensors with active integration for: (a) the E-field and (b) the H-field.

Figure 6.
Circuit describing the compensation function for the E-field sensor. For the H-field sensor a circuit having four such networks have been used.
Figure 6.
Circuit describing the compensation function for the E-field sensor. For the H-field sensor a circuit having four such networks have been used.

Figure 7.
(a) Passive E-field sensor and (b) passive H-field sensor.

Figure 8.
Comparison of the magnetic field strength at different distances from the discharge point (charging voltage −2 kV) [39]. Adapted with permission from Ref. [39]. 2023, Elsevier.

Figure 9.
Comparison of the electric field strength for a ESD generator at three different distances on the same axis from the discharge point (charging voltage –2 kV) [39]. Adapted with permission from Ref. [39]. 2023, Elsevier.

Figure 10.
The magnetic field strength produced for a gap length of 2 mm and a charging voltage of 10 kV at distances from the discharge point: (1) 10 mm, (2) 20 mm, and (3) 30 mm [53].
Figure 10.
The magnetic field strength produced for a gap length of 2 mm and a charging voltage of 10 kV at distances from the discharge point: (1) 10 mm, (2) 20 mm, and (3) 30 mm [53].

Figure 11.
The generated electric field 3 cm from the discharge point for a charging voltage of 10 kV [54].
Figure 11.
The generated electric field 3 cm from the discharge point for a charging voltage of 10 kV [54].

Figure 12.
Comparison for three different ESD generators 10 cm from the discharge point for a charging voltage of + 3 kV [57] for: (a) the H-field strength and (b) the E-field strength. Adapted with permission from Ref. [57]. 2023, Elsevier.

Figure 13.
Laboratory setups: (a) measurement of the H-field and (b) measurement of the E-field.


Figure 14.
Distances and directions on the grounded metal plate for the field sensors.

Figure 15.
The average maximum values of the H-field strength and their standard deviations in the three directions and for all distances for contact discharges with the same generator (charging voltage equals to +4 kV) [38]. Adapted with permission from Ref. [38]. 2023, Elsevier.

Figure 16.
The average maximum values of the E-field strength and their standard deviations in the three directions and for all distances for contact discharges with the same generator (charging voltage equals to +4 kV) [37]. Adapted with permission from Ref. [37]. 2023, IOP Publishing.


Table 1.
Summary of measurement configurations for the E/M field radiated by electrostatic discharges.
Table 1.
Summary of measurement configurations for the E/M field radiated by electrostatic discharges.
| Ref. | Measured Magnitudes | Discharge Type | ||||
|---|---|---|---|---|---|---|
| Discharge Current | Electric Field | Magnetic Field | Optical Radiation | Induced Voltages | ||
| [51] | X | X | Χ | Both air and contact discharges | ||
| [52] | X | X | Contact discharges | |||
| [53,54,55] | X | X | X | Air discharges | ||
| [56] | X | X | X | Both air and contact discharges | ||
| [57] | X | X | X | X | Contact discharges | |
| [58] | X | X | X | Contact discharges | ||
| [59] | X | X | X | X | Both air and contact discharges | |
| [22] | X | X | X | X | Contact discharges | |
| [37,38] | X | X | X | Contact discharges | ||
| [39] | X | X | X | Contact discharges | ||
| [15] | X | X | X | Contact discharges | ||
Disclaimer/Publisher’s Note: The statements, opinions and data contained in all publications are solely those of the individual author(s) and contributor(s) and not of MDPI and/or the editor(s). MDPI and/or the editor(s) disclaim responsibility for any injury to people or property resulting from any ideas, methods, instructions or products referred to in the content. |
© 2023 by the author. Licensee MDPI, Basel, Switzerland. This article is an open access article distributed under the terms and conditions of the Creative Commons Attribution (CC BY) license (https://creativecommons.org/licenses/by/4.0/).
Share and Cite
MDPI and ACS Style
Fotis, G. Electromagnetic Fields Radiated by Electrostatic Discharges: A Review of the Available Approaches. Electronics 2023, 12, 2577. https://doi.org/10.3390/electronics12122577
AMA Style
Fotis G. Electromagnetic Fields Radiated by Electrostatic Discharges: A Review of the Available Approaches. Electronics. 2023; 12(12):2577. https://doi.org/10.3390/electronics12122577
Chicago/Turabian StyleFotis, Georgios. 2023. "Electromagnetic Fields Radiated by Electrostatic Discharges: A Review of the Available Approaches" Electronics 12, no. 12: 2577. https://doi.org/10.3390/electronics12122577
Note that from the first issue of 2016, this journal uses article numbers instead of page numbers. See further details here.