In a unique experiment, The Guardian published online the full manuscript of its major investigation into the climate science emails stolen from the University of East Anglia, which revealed apparent attempts to cover up flawed data; moves to prevent access to climate data; and to keep research from climate sceptics out of the scientific literature.
As well as including new information about the emails, we allowed web users to annotate the manuscript to help us in our aim of creating the definitive account of the controversy. This was an attempt at a collaborative route to getting at the truth.
We hoped to approach that complete account by harnessing the expertise of people with a special knowledge of, or information about, the emails. We wanted the protagonists on all sides of the debate to be involved, as well as people with expertise about the events and the science being described or more generally about the ethics of science. The only conditions are the comments abide by our community guidelines and add to the total knowledge or understanding of the events.
The annotations - and the real name of the commenter - were added to the manuscript, initially in private. The most insightful comments were then added to a public version of the manuscript. We hoped the process will be a form of peer review.
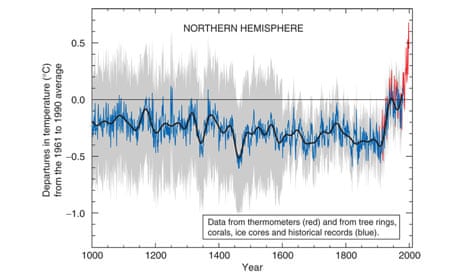
It is a persuasive image. The "hockey stick" graph shows the average global temperature over the past 1,000 years. For the first 900 years there is little variation, like the shaft of an ice-hockey stick. Then, in the 20th century, comes a sharp rise like the stick's blade.
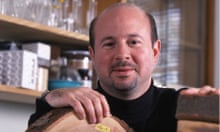
The IPCC put the graph in the summary of its 2001 assessment reports. Although it was intended as an icon of global warming, the hockey stick has become something else – a symbol of the conflict between mainstream climate scientists and their critics. The contrarians have made it the focus of their attacks for a decade, hoping that by demolishing the hockey stick graph they can destroy the credibility of climate scientists. And in the man who first drew the hockey stick, a young paleoclimatologist called Professor Michael Mann of Penn State University, they have found an angry, outspoken and sometimes vulnerable foe.
Damagingly for the mainstreamers, the Guardian has discovered that there was a vitriolic debate within the mainstream science community in 1999, during preparation of the IPCC report, about the validity of the graph. Mann and CRU's tree-ring specialist Dr Keith Briffa are often portrayed by their enemies as co-conspirators, but the CRU emails reveal that back then they were actually in competing camps. Mann promoted his hockey stick. Briffa was very dubious, especially about the prominence the IPCC wanted to give it.
The stakes were high. In the late 1990s, the heat was on to demonstrate the level of natural variability in climate change. In 1996, I visited Briffa at his lab at the CRU. He told me: "Five years ago, the climate modellers wanted nothing to do with the paleo community [scientist studying past climate]. But now they realise they need our data. We can help them define natural variability."
For many years, scientists like Briffa had been analysing the annual growth rings in ancient trees. It was an arcane discipline. They knew that in hot summers, trees grew more, leaving wider and denser growth rings that could be dated by simply counting backwards from the bark. All sorts of data began to emerge. They saw thin rings in trees around the world after major volcanic eruptions, but also longer-term trends visible only by assembling and averaging different data sets from tree ring studies round the word.
At the same time other analysts were producing other kinds of proxy climate data, from the size of glaciers and air bubbles trapped in ice, to the temperature imprint left in coral reefs and sediments in lakes and the temperature of water at different depths in deep boreholes.
Tim Barnett, then of the Scripps Institution of Oceanography, part of the University of California, San Diego, joined Jones to form a small group within the IPCC to mine this data for signs of global warming, ready to report in the next assessment due in 2001. "What we hope is that the current patterns of temperature change prove distinctive, quite different from the patterns of natural variability in the past," Barnett told me in 1996. Even then they were looking for a hockey stick.
Up stepped Mann, then at the University of Virginia. He and colleagues Ray Bradley and Malcolm Hughes began one of the first serious attempts to work out the average global temperature over the past millennium. Most tree-ring records were from Europe and North America. So Mann's team tried to build a more global picture by including proxies of different sorts from as many different regions as possible.
It was pioneering work, assembling and collating data that had never been put together before and aiming for a single graph of global temperature. They published their first graph, showing average temperatures in the northern hemisphere going back to AD 1400 in Nature in 1998. The following year the team extended the reconstruction back to AD 1000, relying on the few proxy records that go back this far. This 1999 version, published in the journal Geophysical Research Letters, was dubbed the "hockey stick" not by Mann but by Jerry Mahlman of the National Centre for Atmospheric Research in Boulder, Colorado.
The long straight shaft of the hockey stick was a surprise. Conventional climate histories recorded a much more wavey line, with a warm period in the medieval period around AD 1000, followed by a little ice age. Mann's explanation has always been that these phenomena were largely European and North Atlantic phenomena. They were not global. Indeed it was likely that if it was warmer in some places back then, it would be cooler in others.
But many tree ring researchers in particular doubted whether the graph had got it right. Initially Mann shared such concerns. The title of their 1999 paper, "Northern hemisphere temperature during the past millennium: inferences, uncertainties and limitations" was hardly bombastic.
Reconstructing past temperatures from proxy data is fraught with danger. Tree ring records, the biggest component of the hockey stick record, sometimes reflect rain or drought rather than temperature. When I investigated the continuing row surrounding the graph in 2006, Gordon Jacoby of Columbia University in New York, said: "Mann has a series from central China that we believe is more a moisture signal than a temperature signal... He included it because he had a gap. That was a mistake and it made tree-ring people angry." A large data set he used from bristlecone pines in the American west has attracted similar concern.
Deciding which data sets to include in such reconstructions was, if not arbitrary, then open to dispute. And dispute there was. In the late 1990s, the researchers in heated debate about what they could and could not reliably show about past temperatures, and how to represent their findings. And they were under pressure to "deliver" for the IPCC.
Decade that just got hotter
As the hockey stick began to appear in the scientific literature, it emerged that 1998 was the warmest year in Phil Jones's 150-year record of thermometer data. The length of the hockey stick blade just grew. Those in charge of publicising the work of climate scientists and making the case for man-made climate change were understandably excited. Controversial science swiftly morphed into a propaganda tool.
The World Meteorological Organization put the hockey stick on the cover of its 1999 report on climate change. Then IPCC chiefs decided to give it pride of place in their 2001 IPCC report. Moreover, based on the hockey stick, they stated that "it is likely that the 1990s was the warmest decade and 1998 the warmest year during the past thousand years". That attracted attention — and trouble. The doubts expressed in that paper title about "uncertainties and limitations" were melting away.
Emails exchanged in September 1999 reveal intense disagreement about whether Mann's hockey stick should go into the IPCC summary for policymakers – the only bit of the report that usually gets read outside the scientific community – or whether other reconstructions using tree ring data alone should get priority. One of the main tree-ring constructions was by Briffa. The emails also expose major tensions between a desire for scrupulous honesty about uncertainties, and the desire for a simple story to tell the policymakers. The IPCC's core job is to present a "consensus" on the science, but in this critical case there was no easy consensus.
The tensions were summed up in an email sent on 22 September 1999 by Met Office scientist Chris Folland, in which he alerted key researchers that a diagram of temperature change over the past thousand years "is a clear favourite for the policy makers' summary"
But there were two competing graphs – Mann's hockey stick and another, by Jones, Briffa and others. Mann's graph was clearly the more compelling image of man-made climate change. The other "dilutes the message rather significantly," said Folland. "We want the truth. Mike [Mann] thinks it lies nearer his result." Folland noted that "this is probably the most important issue to resolve in chapter 2 at present."
Three hours after receiving Folland's response, Briffa sent a long and passionate email demanding caution over the use of Mann's hockey stick. "It should not be taken as read that Mike's series is THE CORRECT ONE," he warned. "I know there is pressure to present a nice tidy story as regards 'apparent unprecedented warming in a thousand years or more in the proxy data', but in reality the situation is not quite so simple... For the record, I believe that the recent warmth was probably matched about 1000 years ago... and that there is strong evidence for major changes in climate over the Holocene that require explanation and that could represent part of the current or future background variability of our climate." This last point is important. Briffa was saying not only that the hockey stick might not be right, but that any graph of the last thousand years could not be taken to represent the limits of natural variability.
The September spat was the last in a simmering row. Only hints appear in the published emails. But they underline the anger behind the scenes. In April 1999, Ray Bradley of the University of Massachusetts, a co-author of Mann on the hockey stick papers, was apologising for Mann's stance. "I would like to dissociate myself from Mike Mann's view...I find this notion quite absurd. I have worked with the UEA group for 20+ years and have great respect for them. As for thinking that is it 'better that nothing appear, than something unacceptable to us'... as though we are the gatekeepers of all that is acceptable in the world of paleoclimatology seems amazingly arrogant." The row concerned an article Briffa and colleague Tim Osborn were writing for Science magazine.
Days later, back from holiday, Jones laid into Mann: "You seem quite pissed off with us all in CRU... It is clear from the emails that this relates to the emphasis placed on a few words/phrases in Keith/Tim's Science piece. I've not seen the censored email that Ray has mentioned, but this doesn't seem to me the way you should be responding. We have disagreements, but we have never resorted to slanging one another off to a journal (as in this case)."
Mann, Jones and Briffa eventually settled their differences. And the hockey stick was given pride of place in the IPCC report. Folland says: "My recollection is that the final version [of the IPCC summary], which contains the hockey stick, satisfied Keith and everyone else in the end — after the usual vigorous scientific debate." And after the three came under attack from climate sceptics, all reference to these past spats disappeared from the emails as they faced a common foe.
Annotations
The text below consists of invited comments made on the Climate wars articles. They can be accessed in the main body of the article by clicking on the text to which they refer, which is highlighted in yellow.


Comments (…)
Sign in or create your Guardian account to join the discussion